
- Moving the markets
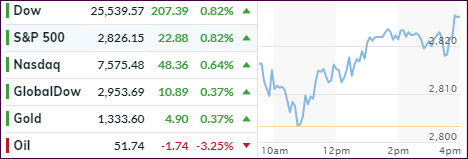
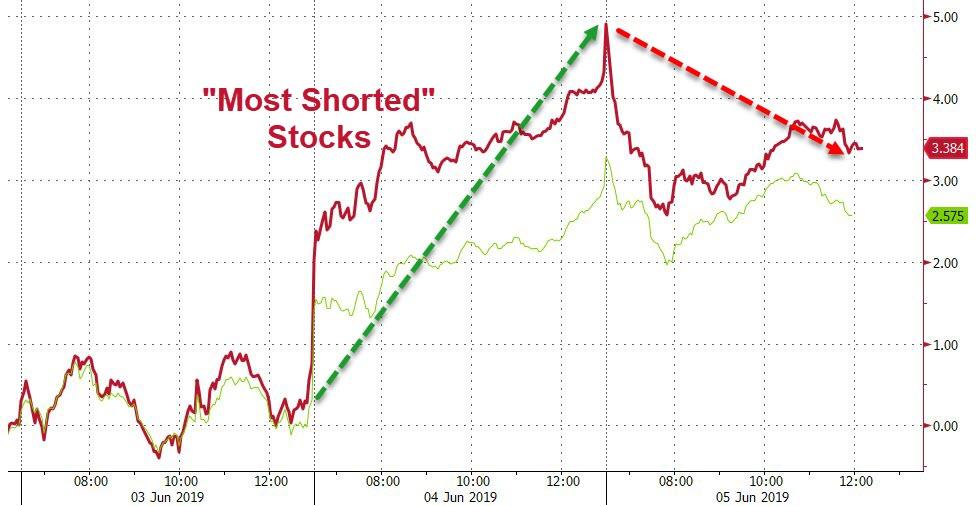
Equities started the session in the positive, before a mid-day pullback interrupted follow through buying from yesterday. The pause was short-lived and, despite conflicting economic data, the bulls charged ahead with the major indexes closing around their session highs, despite yesterday’s short squeeze running out of ammo.
ADP payroll data painted a bleak picture with only 27k job additions for May vs. an expexted 185k, which was the weakest growth since early 2010. That was another feather in Fed’s cap, since it may find even more justification for another cut in interest rates.
This was the reasoning behind today’s rally, which was boosted by hopes that the global economy is deteriorating fast enough to validate a cut, perhaps as soon as this month, to avoid a possible recession. At least that’s how the theory goes.
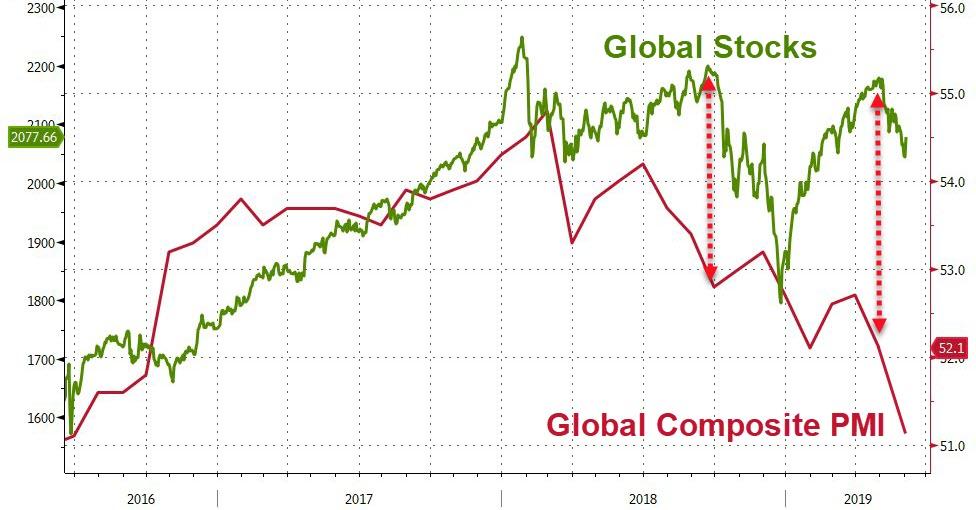
Some strategists are pointing towards the disconnect between the economy and stocks, which has reached a record high, making the case for a potential return to bear market territory, along with a revisit of the December lows, a real likelihood.
Economist David Rosenberg summed things up in this concise tweet:
Does this chart look bullish? 16 months of nothing except the dividend, volatility, and acute anxiety. The S&P 500 has crossed above and below the 2,800 threshold no fewer than 19x since first testing the milestone in Jan/18. Looks like an elongated topping formation to me.
I could not have said it better myself.
2. ETFs in the Spotlight
In case you missed the announcement and description of this section, you can read it here again.
It features 10 broadly diversified and sector ETFs from my HighVolume list as posted every Saturday. Furthermore, they are screened for the lowest MaxDD% number meaning they have been showing better resistance to temporary sell offs than all others over the past year.
The below table simply demonstrates the magnitude with which some of the ETFs are fluctuating regarding their positions above or below their respective individual trend lines (%+/-M/A). A break below, represented by a negative number, shows weakness, while a break above, represented by a positive percentage, shows strength.
For hundreds of ETF choices, be sure to reference Thursday’s StatSheet.
For this current domestic “Buy” cycle, here’s how some our candidates have fared:
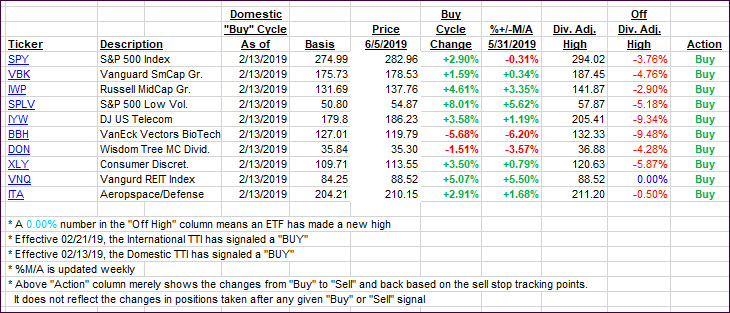
Again, the %+/-M/A column above shows the position of the various ETFs in relation to their respective long-term trend lines, while the trailing sell stops are being tracked in the “Off High” column. The “Action” column will signal a “Sell” once the -8% point has been taken out in the “Off High” column. For more volatile sector ETFs, the trigger point is -10%.
3. Trend Tracking Indexes (TTIs)
Our Trend Tracking Indexes (TTIs) headed higher with the International one now closing in on a trend line break into bullish territory.
Here’s how we closed 06/05/2019:
Domestic TTI: +2.98% above its M/A (last close +2.17%)—Buy signal effective 02/13/2019
International TTI: -0.18% below its M/A (last close -0.55%)—Sell signal effective 05/30/2019
Disclosure: I am obliged to inform you that I, as well as my advisory clients, own some of the ETFs listed in the above table. Furthermore, they do not represent a specific investment recommendation for you, they merely show which ETFs from the universe I track are falling within the specified guidelines.
Contact Ulli