
ETF Tracker StatSheet
You can view the latest version here.
STARTING AUGUST IN A SEA OF RED
- Moving the markets
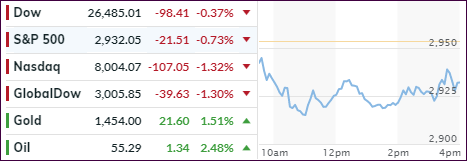
Equities spent most of their day surrounded by a sea of red, thanks in part to further fallout from the Fed cutting rates by “only” 0.25%. The bigger impact, however, came from the follow through of tough language after Trump had announced further tariffs on Chinese goods.
That pushed the markets into bearish mode and today’s counter punch from the Chinese via words like “temperamental US will suffer more pain,” did nothing to soothe the raw nerves. This aggravated Wall Street traders/algos and down we went again recording the worst week of 2019.
As the chart above shows, the outcome could have been a lot worse, but thanks to buyers stepping in at mid-day, the losses were sharply reduced, but we still closed in the red. This was the S&P 500’s 5th successive drop in a row.
Today’s payroll report did not contain any surprises with 164k jobs added, which was just about the expected number. This decent headline was weakened by the fact that substantial historical downward revisions pulled employment gains for May and June down by 41,000 from what was previously reported.
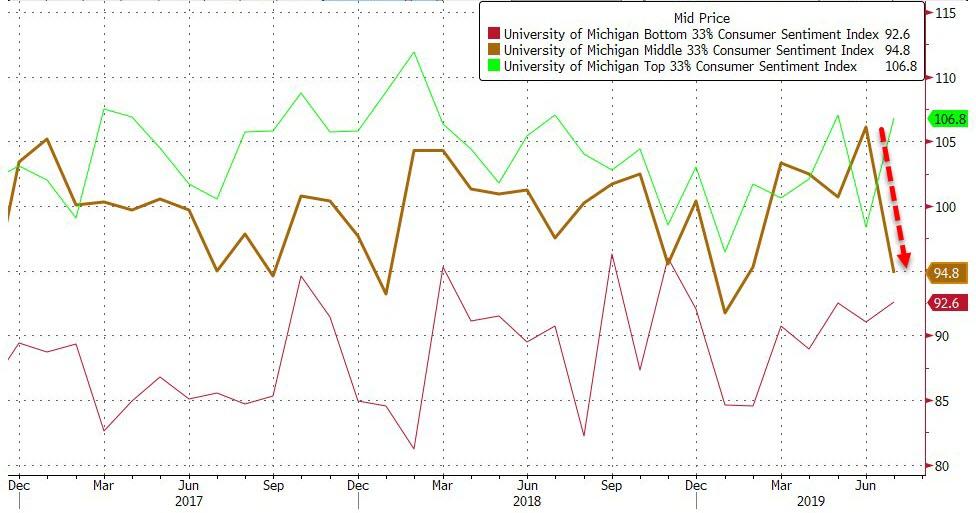
On the economic front, the dire news continues with Consumer Confidence dropping to 5-month lows, but only in the arena considered to be the middle-income Americans, while the bottom and top numbers improved.
Factory orders contracted for the 2nd month in a row due to a reduction in war-spending, which is a good thing…
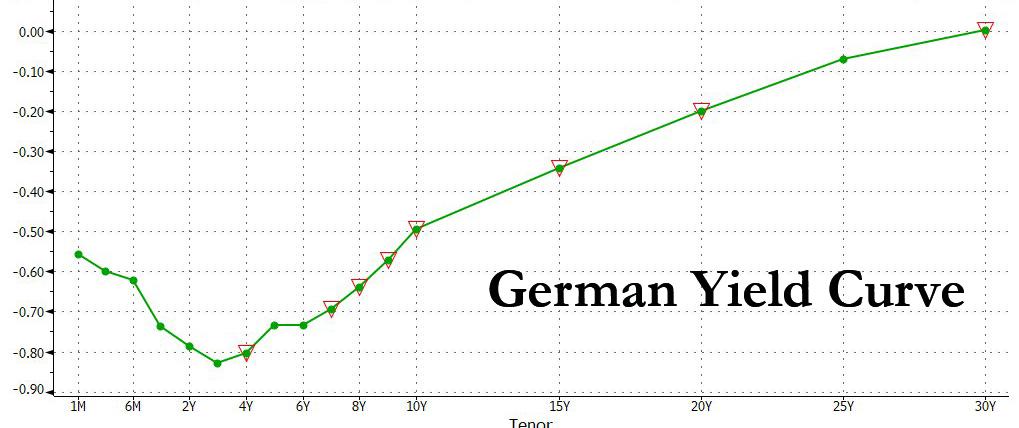
Looking towards Europe, we learned that the entire yield curve of economic powerhouse Germany dropped below zero for the first time ever. What that means is that the idiocy continues in bond land, where every bond you want to buy has now a negative return. Yes, even the 30-year dropped into minus territory by a tad.
It’s a race to the bottom, with now some $14 trillion in global bonds now yielding less than zero. I am afraid, it’s just a matter of time that the US will follow suit.
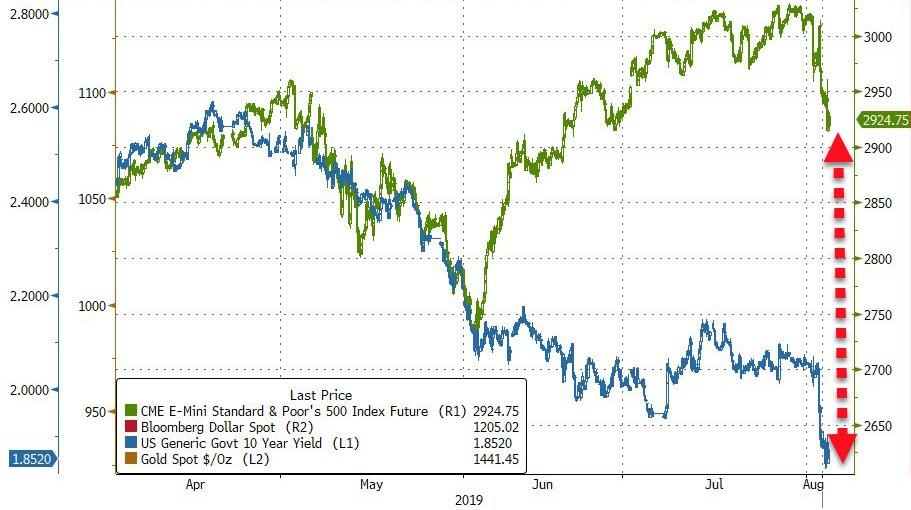
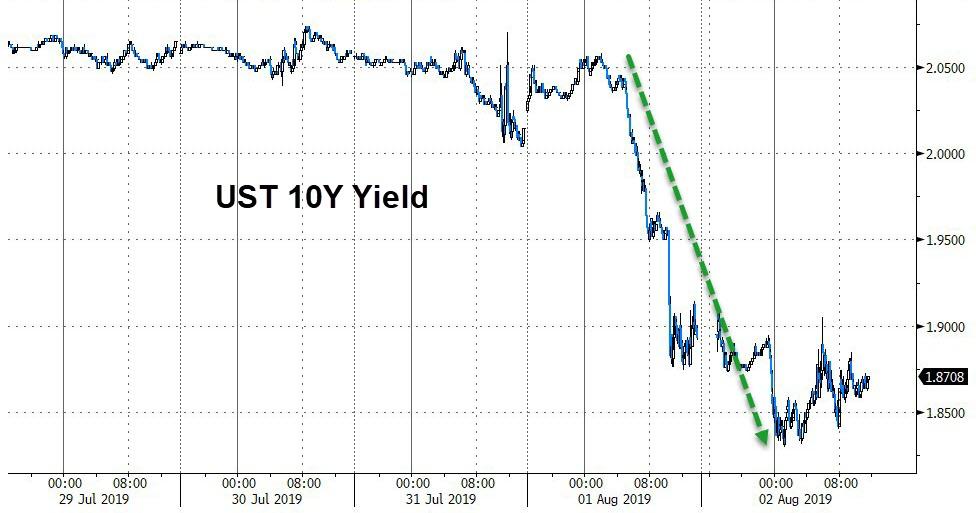
As ZH pointed out, despite this week’s carnage, bonds and stocks remain dramatically decoupled, as the 10-year yield experienced its biggest drop in a week, since the end of 2014.
If the last few days are an indication of what we can expect in the markets, it promises to be an August to be remembered.
2. ETFs in the Spotlight
In case you missed the announcement and description of this section, you can read it here again.
It features 10 broadly diversified and sector ETFs from my HighVolume list as posted every Saturday. Furthermore, they are screened for the lowest MaxDD% number meaning they have been showing better resistance to temporary sell offs than all others over the past year.
The below table simply demonstrates the magnitude with which some of the ETFs are fluctuating regarding their positions above or below their respective individual trend lines (%+/-M/A). A break below, represented by a negative number, shows weakness, while a break above, represented by a positive percentage, shows strength.
For hundreds of ETF choices, be sure to reference Thursday’s StatSheet.
For this current domestic “Buy” cycle, here’s how some our candidates have fared:
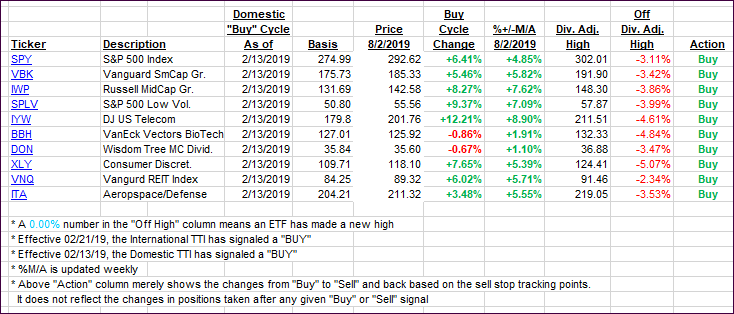
Again, the %+/-M/A column above shows the position of the various ETFs in relation to their respective long-term trend lines, while the trailing sell stops are being tracked in the “Off High” column. The “Action” column will signal a “Sell” once the -8% point has been taken out in the “Off High” column. For more volatile sector ETFs, the trigger point is -10%.
3. Trend Tracking Indexes (TTIs)
Our Trend Tracking Indexes (TTIs) retreated again as more fallout from the US-China trade dispute weighed on markets.
Here’s how we closed 08/02/2019:
Domestic TTI: +4.15% above its M/A (last close +5.20%)—Buy signal effective 02/13/2019
International TTI: +1.25% above its M/A (last close +2.74%)—Buy signal effective 06/19/2019
Disclosure: I am obliged to inform you that I, as well as my advisory clients, own some of the ETFs listed in the above table. Furthermore, they do not represent a specific investment recommendation for you, they merely show which ETFs from the universe I track are falling within the specified guidelines.
———————————————————-
WOULD YOU LIKE TO HAVE YOUR INVESTMENTS PROFESSIONALLY MANAGED?
Do you have the time to follow our investment plans yourself? If you are a busy professional who would like to have his portfolio managed using our methodology, please contact me directly or get more details here.
———————————————————
Back issues of the ETF Tracker are available on the web.
Contact Ulli