1. From the universe of over 1,800 ETFs, I have selected only those with a
trading volume of over $5 million per day (HV ETFs), so that liquidity and a
small bid/ask spread are assured.
2. Trend Tracking Indexes (TTIs)
Buy or Sell decisions for Domestic and International ETFs (section 1 and
2), are made based on the respective TTI and its position either above or below
its long-term M/A (Moving Average). A crossing of the trend line from below
accompanied by some staying power above constitutes a “Buy” signal. Conversely,
a clear break below the line constitutes a “Sell” signal. Additionally, I use a
7.5% trailing stop loss on all positions in these categories to control
downside risk.
3. All other investment arenas do not have a TTI and should be traded
based on the position of the individual
ETF relative to its own respective trend line (%M/A). That’s why those signals
are referred to as a “Selective Buy.” In other words, if an ETF crosses its own
trendline to the upside, a “Buy” signal is generated. Since these areas tend to
be more volatile, I recommend a wider trailing sell stop of 7.5% -10% depending
on your risk tolerance.
If you are unfamiliar with some of the terminology, please see Glossary of Termsand new subscriber information in section 9.
1. DOMESTIC EQUITY ETFs: BUY
— since 02/13/2019
Click on chart to enlarge
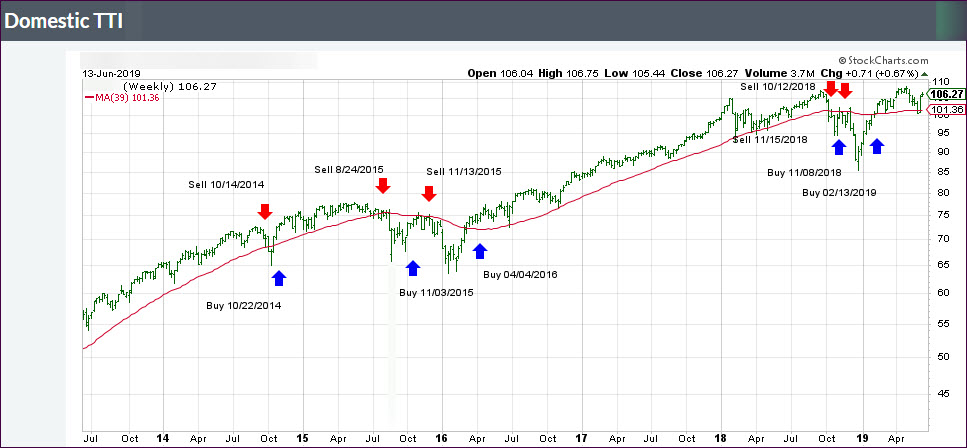
Our main directional indicator, the Domestic Trend Tracking Index (TTI-green line in the above chart) is now positioned above its long-term trend line (red) by +4.84% after having generated a new Domestic “Buy” signal effective 2/13/19 as posted.
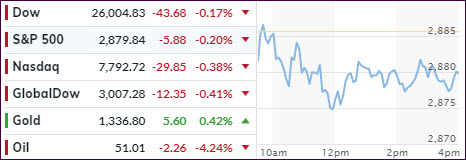
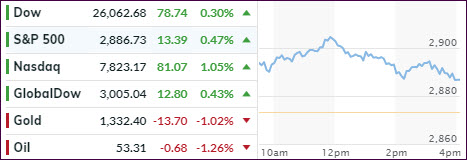
Equities managed a small rebound, after 2 days of modest
losses kept the major indexes in check. Oil prices spiked as two oil tankers were
damaged in suspected attacks off the coast of Iran, increasing tensions between
Teheran and Washington.
Of course, by default, no matter if it makes sense or
not, Iran is suspected to be the guilty party—at least for the time being. Be
that as it may, the energy sector was the beneficiary of this event with Crude
Oil reclaiming its $52 marker.
Trade tensions with China saw a tiny positive development
when Trump mentioned that he “doesn’t have a deadline” for imposing additional
tariffs and adding that he had a “feeling” a deal could be reached. I am
sure, the jawboning is far from being over…
In the end, it turned out to be a roller coaster ride,
with the major indexes giving back most of their early gains. However, during
the last 30 minutes of trading, a sudden burst of upward momentum pushed the
indexes close to the opening high, but the Nasdaq was unable to get back above its
50-day M/A.
There was not much gained or lost regarding our Trend
Tracking Indexes (TTIs).
Upward momentum was conspicuously absent during this session,
which had stocks drift aimlessly lower, interrupted by the occasional bounce to
nowhere. The major indexes followed yesterday’s theme by slipping moderately.
On the menu was the Consumer Price Index (CPI), which showed
prices advancing by an expected +0.1% in April, while the cost of living over the
past year slowed to 1.8% from 2%. This slowing of price growth was another feather
in the cap of those hoping that the Fed will cut rates sooner rather than
later.
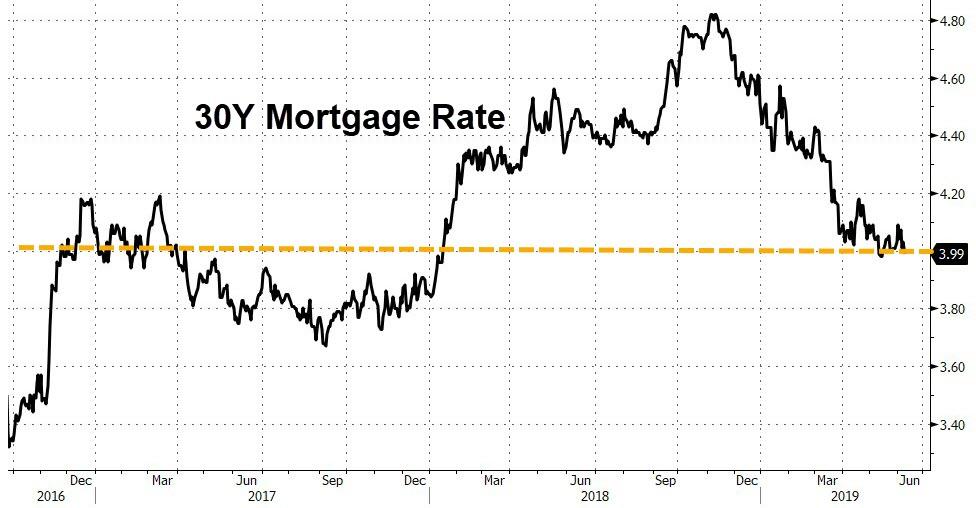
The already declining bonds yields, as well as mortgage rates,
have created a new Refi boom, as mortgage applications surged impressively by
26.8% WoW, which was its largest jump since 2015. 30-year
rates have now tumbled below 4%, a level last seen in January 2019.
Regarding China, Trump came out and said that he was the one
“holding up a trade deal with China,” adding that the two countries
would “either do a great deal…or we’re not doing a deal at all.”
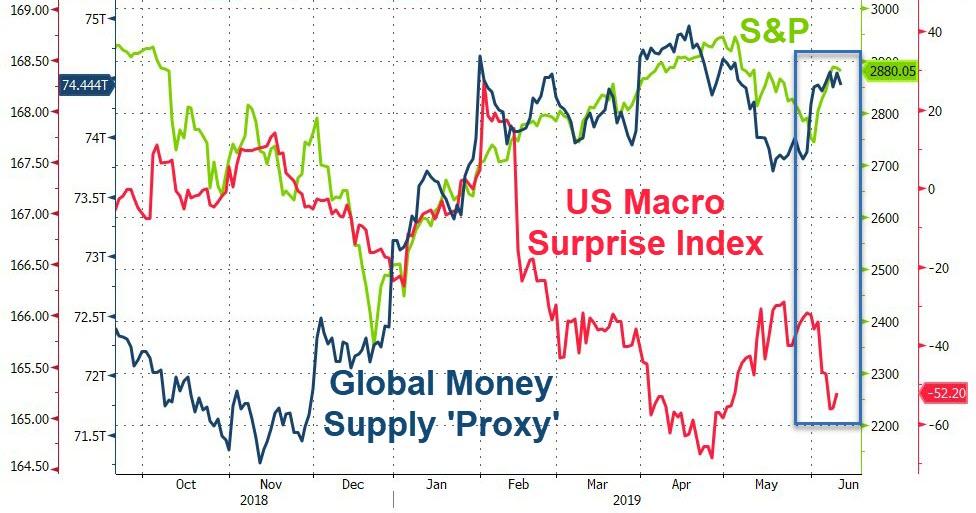
You may be wondering what, other than Fed jawboning, has
been driving stocks higher during the past week, but this chart
(thanks to ZH) clearly shows that, after an interruption in May, the global
money supply has been rising again and thereby lifted stocks out of the May
doldrums.
Despite another positive start to the session, equities struggled,
lost traction and slid into the red, with the major indexes hugging their
respective unchanged lines and closing a tad below it.
Powering the markets early on were reports from China announcing
plans for fresh stimulus to keep their economy running. Hope among traders was
high that an easing of trade tensions might be on deck, yet later renewed
posturing between the U.S. and China supported the view that the standoff will
continue.
In the end, none of these headlines provided enough ammo
to keep the indexes in the green. It appears to me that the trade tensions will
escalate further but will be interrupted from time to time by hope of a
resolution, which will then temporarily support a market bounce.
Right now, expectations are that the Fed will please Wall
Street next Wednesday, when they announce their decision on interest rates.
Until then, we may see some aimless meandering in the indexes until it becomes clear
as to what the verdict might be.
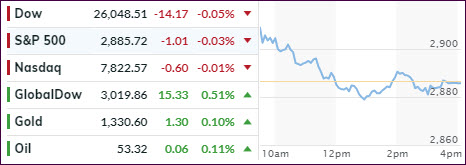
A quick end to the Mexican tariff saga helped the major
indexes to follow through from Friday’s rally with the Nasdaq taking the lead,
while the Dow ended higher for the 6th straight session. Upward
momentum, however, hit a glass ceiling mid-day, and we faded into the close.
However, not all is peaches and cream, and Trump warned that should
Mexico’s cooperation to stem the flow of illegal immigrants fail, “we can
always go back to our previous, very profitable, position on tariffs.”
Giving the market an assist as well was the fact that the Fed
is on deck next week, and we will find out if lower interest rates, which
already have been priced in, will come to fruition. Traders anticipate that last
week’s poor jobs report will influence the Fed’s decision in favor of a reduction
in rates.
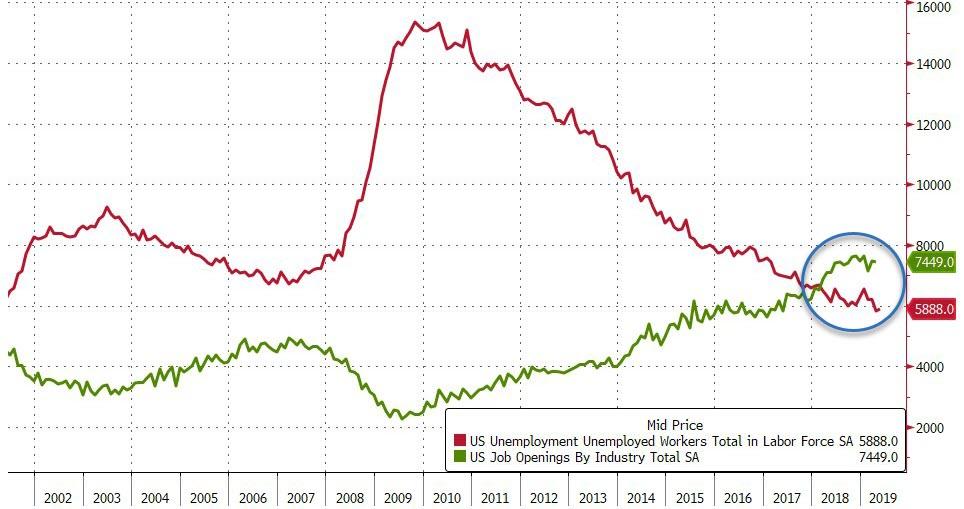
On the economic side, things did not look rosy, as job openings
fell in April, while layoffs picked up at the same time. However, job
openings remain above the number of unempoyed workers for the 14th
month in a row.
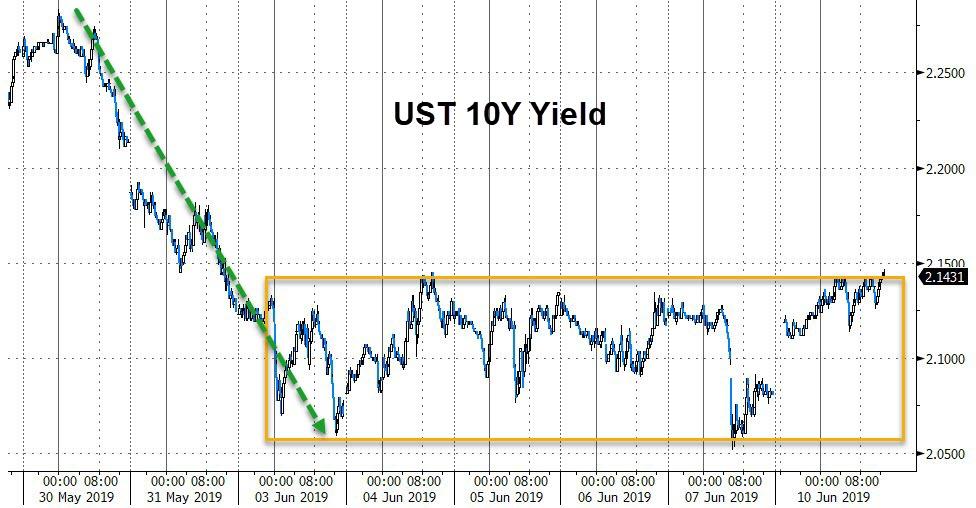
Bond yields
rose notably on the day, which affected the low volatily ETF (SPLV) negatively,
but its unrealized gain for this Domestic Buy cycle remains higher than that of
its SPY cousin (section 2) by over 50%.
Our International TTI edged deeper into bullish territory,
but it has been hovering above the line for only 3 days. This move could reverse
in a hurry, so I will look for more confirmation before declaring a new ‘Buy’
for this sector.
Continue reading…
2. ETFs in the
Spotlight
In
case you missed the announcement and description of this section, you can read it here again.
It
features 10 broadly diversified and sector ETFs from my HighVolume list as
posted every Saturday. Furthermore, they are screened for the lowest MaxDD%
number meaning they have been showing better resistance to temporary sell offs
than all others over the past year.
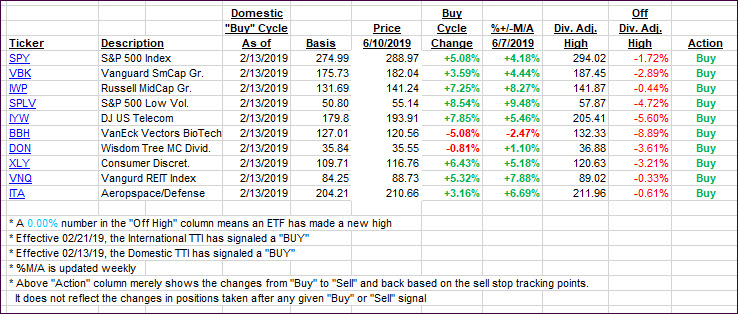
The below table simply demonstrates the
magnitude with which some of the ETFs are fluctuating regarding their positions
above or below their respective individual trend lines (%+/-M/A). A break
below, represented by a negative number, shows weakness, while a break above,
represented by a positive percentage, shows strength.
For
hundreds of ETF choices, be sure to reference Thursday’s StatSheet.
For this current domestic “Buy” cycle, here’s how some our candidates have fared:
Again,
the %+/-M/A column above shows the position of the various ETFs in relation to
their respective long-term trend lines, while the trailing sell stops are being
tracked in the “Off High” column. The “Action” column will signal a “Sell” once
the -8% point has been taken out in the “Off High” column. For more volatile
sector ETFs, the trigger point is -10%.
3.
Trend Tracking Indexes (TTIs)
Our
Trend Tracking Indexes (TTIs) headed north with the International one now being
on the positive side of its trend line for the third day. I’d like to see a
little more staying power before declaring this ‘Sell’ signal to be over.
Here’s
how we closed 06/10/2019:
Domestic
TTI: +4.47% above its M/A (last close +4.14%)—Buy signal effective 02/13/2019
International
TTI: +1.58% above its M/A (last close +1.11%)—Sell
signal effective 05/30/2019
Disclosure: I am obliged to inform you that I, as well as my advisory clients, own some of the ETFs listed in the above table. Furthermore, they do not represent a specific investment recommendation for you, they merely show which ETFs from the universe I track are falling within the specified guidelines.
Below, please find the latest High-Volume ETF Cutline
report, which shows how far above or below their respective long-term trend
lines (39-week SMA) my currently tracked ETFs are positioned.
This report covers the HV ETF Master List from Thursday’s
StatSheet and includes 322 High Volume ETFs, defined as those with an average
daily volume of more than $5 million, of which currently 239 (last week 145)
are hovering in bullish territory. The yellow line separates those ETFs that
are positioned above their trend line (%M/A) from those that have dropped below
it.
In case you are not familiar
with some of the terminology used in the reports, please read the Glossary of Terms.
If you missed the original
post about the Cutline approach, you can read it here.

