
- Moving the markets
Throughout today’s session, equities were under pressure due to the looming earning season. Traders were a bit anxious to find out if some of the poor economic data points of the last quarter, or the U.S.-China trade war, are having an impact on companies’ bottom lines.
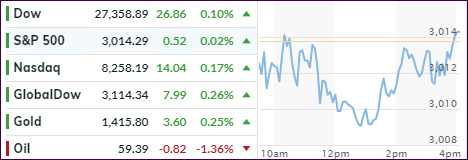
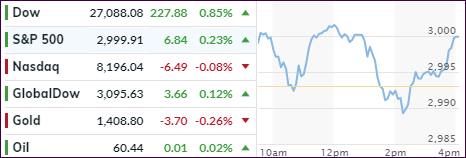
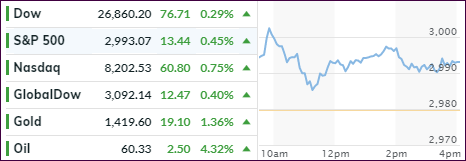
The major indexes spent most of the day below their respective
unchanged lines, although by only a tiny margin, but managed to close in the green
thanks to the usual last 30-minute pump.
China posted its weakest economic growth in 27 years by growing only 6.2%. One analyst did not see this as a cause for concern, since “a further round of monetary-policy stimulus has helped to soften the impact of a relatively weak GDP print.”
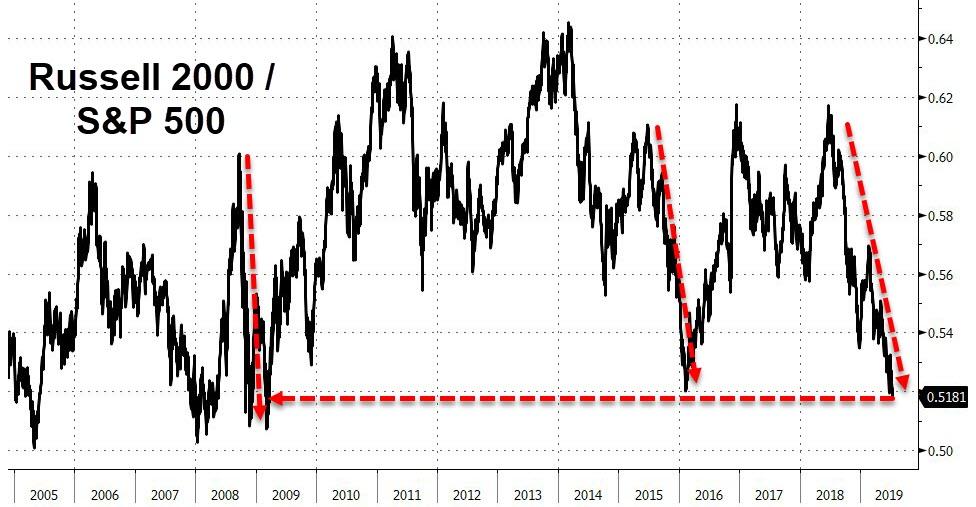
On the domestic side, it’s interesting to note that SmallCaps are continuing to collapse relative to LargeCaps, which this long-term chart makes abundantly clear.
This is somewhat strange when considering the negative effects of the U.S.-China trade war should weigh far more on large-cap multinational companies rather than on more domestically oriented small-cap companies.
Be that as it may, right now, the focus is on earnings season, and it will be interesting to see what directional market effect it might have.
Read More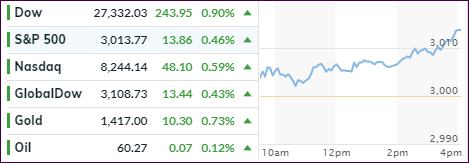

