Unbridled Optimism Propels Equities

Ulli Market Commentary Contact

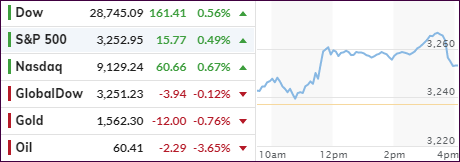
[Chart courtesy of MarketWatch.com]
  1. Moving the markets

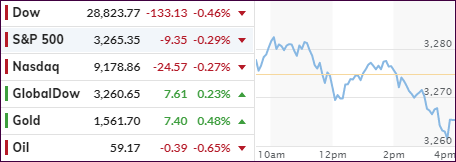
President Trump set the tone early on for today’s rally by suggesting that “today will be a good day in the stock market,” and just in case the computer algos missed his prediction, he created more excitement via his remark that “the China deal is moving forward ahead of schedule.

Of course, we know by now that things like global liquidity  and short squeezes rule supreme when it comes to pushing markets higher, as this chart shows.

All the above turned out to be enough to extend the S&P’s move into record territory, while the Dow and Nasdaq were just hovering below their respective record closes set in late July. Of course, traders’ focus remained on the still outstanding earnings reports, of which 162 S&P 500 companies will release their report cards this week.

Earnings from one of the bigger names, like AT&T, were market pleasing with the media giant topping third quarter expectations, while announcing a plan to grow earnings per share by at least 33% by 2020.

Other news, which did not affect markets were the Fed’s meeting on interest rates with the verdict due out Wednesday. A quarter point reduction is expected, and the Fed will have to deliver or the markets sure will have a tizzy fit.

It’s noteworthy, that today was the third day in a row during which bond yields jumped (today by about 5 basis points), and the markets rallied anyway. Usually, rising bond yields tend to pull down equities, but we appear to be stuck in a moment in time, where the opposite is occurring.

That has been a negative, as I posted on Friday, for the low volatility ETF (SPLV), which gave back -0.49% for the day, while the S&P 500 (SPY) managed to score a gain of +0.58%.

Yet, YTD for our current ‘Buy’ signal, the SPLV still has notched superior gains (+12.20%) and remains ahead of SPY (+10.31%), but the victory margin has narrowed. When rates head back south again, however, we will see the pendulum swing back the other way.

Read More

ETFs On The Cutline – Updated Through 10/25/2019

Ulli ETFs on the Cutline Contact

Below, please find the latest High-Volume ETF Cutline report, which shows how far above or below their respective long-term trend lines (39-week SMA) my currently tracked ETFs are positioned.

This report covers the HV ETF Master List from Thursday’s StatSheet and includes 322 High Volume ETFs, defined as those with an average daily volume of more than $5 million, of which currently 274 (last week 250) are hovering in bullish territory. The yellow line separates those ETFs that are positioned above their trend line (%M/A) from those that have dropped below it.

Take a look:                                                                   

The HV ETF Master Cutline Report

In case you are not familiar with some of the terminology used in the reports, please read the Glossary of Terms. If you missed the original post about the Cutline approach, you can read it here.      

ETF Tracker Newsletter For October 25, 2019

Ulli ETF Tracker Contact

ETF Tracker StatSheet          

You can view the latest version here.

SCRAMBLING AND TOUCHING NEW ALL-TIME HIGHS

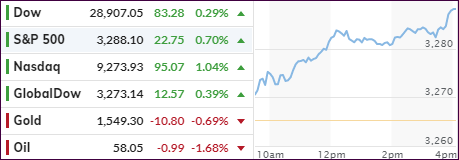
[Chart courtesy of MarketWatch.com]
  1. Moving the markets

The hope that Amazon’s earnings report would provide the firepower to propel the markets into record territory proved to be false, as the behemoth showed its first profit drop in two years, causing its stock to subsequently take a dive of some 8% in yesterday’s afterhours trading.

With that horse being out of commission, traders and algos needed a new driver to push the slow crawl of the indexes towards all-time highs into overdrive. That turned out to be the latest headlines promoting that “US and China are near completion of some aspects of the phase one trade deal that was supposed to be all papered last week.”

It worked, and the S&P 500 broke through overhead resistance in pursuit of the all-time intra-day level of 3,027.98, which it failed to conquer, but it managed to take out the previous closing high of 3,025.86 for a few minutes before pulling back. Giving an assist was the biggest short-squeeze in 6 weeks, which has been helping markets without many interruptions since the beginning of September.

For sure, any positive signs of either the existing US-China tariffs being suddenly dropped, or the actual signing of the phase 1 trade deal, will send global stocks higher.

Today’s move only required the S&P to gain less than 0.5% to touch new all-time highs. This happened in the face of rising bond yields, which gave the S&P 500 (SPY) the edge (+0.41%) over its low volatility cousin SPLV, which slid for the second day (-0.57%). Still, for this current ‘Buy’ cycle, SPLV remains the dominant force by having gained +12.76% vs. SPY’s 9.67%.

As far as market participants is concerned, next week’s Fed meeting on interest rates is a shoo-in and already a foregone conclusion. I only expect a strong market reaction, if they don’t cut (negative), or if they cut more than expected (positive).

Never mind that the US budget deficit for fiscal 2019 came in at almost $1 trillion ($984.4 billion to be exact), which was a whopping increase of 26.4% over the prior year, nor that US Economic Policy Uncertainty has soared to all-time record highs. Stocks are in their own world and appear to be climbing a wall of worry.

Read More

Weekly StatSheet For The ETF Tracker Newsletter – Updated Through 10/24/2019

Ulli ETF StatSheet Contact

ETF Data updated through Thursday, October 24, 2019

Methodology/Use of this StatSheet:

1. From the universe of over 1,800 ETFs, I have selected only those with a trading volume of over $5 million per day (HV ETFs), so that liquidity and a small bid/ask spread are assured.

2. Trend Tracking Indexes (TTIs)

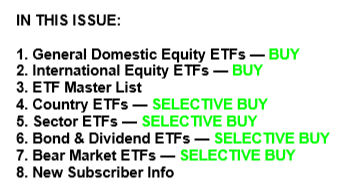
Buy or Sell decisions for Domestic and International ETFs (section 1 and 2), are made based on the respective TTI and its position either above or below its long-term M/A (Moving Average). A crossing of the trend line from below accompanied by some staying power above constitutes a “Buy” signal. Conversely, a clear break below the line constitutes a “Sell” signal. Additionally, I use a 7.5% trailing stop loss on all positions in these categories to control downside risk.

3. All other investment arenas do not have a TTI and should be traded based on  the position of the individual ETF relative to its own respective trend line (%M/A). That’s why those signals are referred to as a “Selective Buy.” In other words, if an ETF crosses its own trendline to the upside, a “Buy” signal is generated. Since these areas tend to be more volatile, I recommend a wider trailing sell stop of 7.5% -10% depending on your risk tolerance.

If you are unfamiliar with some of the terminology, please see Glossary of Terms and new subscriber information in section 9.     

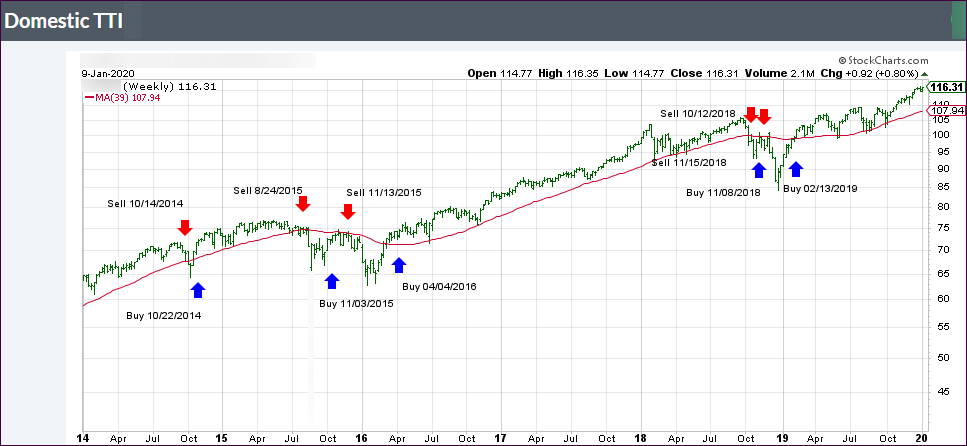
1. DOMESTIC EQUITY ETFs: BUY — since 02/13/2019

Click on chart to enlarge

Our main directional indicator, the Domestic Trend Tracking Index (TTI-green line in the above chart) is now positioned above its long-term trend line (red) by +3.94% after having generated a new Domestic “Buy” signal effective 2/13/19 as posted.

Read More

Seesawing—But Limping Higher

Ulli Market Commentary Contact

[Chart courtesy of MarketWatch.com]
  1. Moving the markets

Yesterday’s last-minute pump, to get the major indexes to a green close, finally made sense, when it became known that the Fed had injected $134 billion in liquidity in the repo markets. This event sparked a furious last hour rally, which ZH charted like this.

As the table shows, the increase in liquidity availability for overnight repos was increased from $75 billion to $120 billion, while term repos jumped from $35 billion to $45 billion. The overnight repo was the biggest ever, which again begs the questions “what is broken?” and “will it go exponential?”

Added ZH:

The only possible explanation, is someone really needed to lock in cash for month end (the maturity of the op is on Nov 7) which is when a “No Deal” Brexit may go live, and as a result one or more banks are bracing for the worst. The question, as before, remains why: just what is the source of this unprecedented spike in liquidity needs in a system which already has $1.5 trillion in excess reserves? And while we await the answer, expect stocks to close pleasantly in the green as dealers transform their newly granted liquidity into bets on risk assets.

These are serious issues with potentially significant repercussions for equity markets, which so far have simply shrugged off this event. In my view, this will not end well…

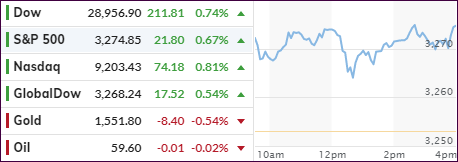
However, for the time being, the major indexes continued their aimless meandering around their respective unchanged lines with a bullish bias, as headline earnings reports provided a mixed picture.

MarketWatch featured these highlights:

Microsoft’s stock surges as big earnings beat prompts analysts to boost price targets

Twitter stock tumbles 20% after company says advertising bugs weighing on earnings

Comcast’s stock surges after profit, revenue rise above expectations

Nokia’s stock plummets toward worst day in 19 years on heavy volume after profit warning

On the economic side, things did not look encouraging with US New Home Sales slowing in September, as prices plunged to their lowest since 2017. Not to be outdone, the Durable Goods report showed that orders tumbled last month, while Business Investment contracted the most since Trump’s election.

Still, it looks to me that traders and computer algos are eagerly awaiting Amazon’s earnings, due out after the close today. If expectations are solidly beat, this may provide enough optimism/firepower to propel the indexes into all-time high territory, which is not a big deal, since we have been hovering within striking distance (around 1%) for a while.

Read More

Chopping Around Key Technical Levels

Ulli Market Commentary Contact

[Chart courtesy of MarketWatch.com]
  1. Moving the markets

Despite disappointing results from Boeing and Caterpillar, the markets managed an early ramp higher but were not able to sustain it, as a slow deterioration of upward momentum pulled the major indexes back below the unchanged line.

Traders had one eye on the Brexit developments, where the latest parliamentary vote eased concerns about the UK busting out of the EU without a deal by October 31st.

Looking at the big picture, this week is all about earnings with next week’s highlight being the Fed meeting on interest rates. Even though 82.7% of S&P companies have delivered results above expectations, let’s not forget that these expectations have been sharply reduced.

Companies are further justifying these numbers by elaborating that “how we did this quarter isn’t as important as what we expect the future to hold.” Yeah, right.

With the Fed’s money printing going into overdrive at the rate of some $60 billion a month, it’s no wonder that Central Banks around the world have been accumulating gold at a record pace. Today, we learned that my home country, Germany, has joined the party by openly buying gold into its reserve holdings—for the first time in 21 years.

That is not surprising, as Germany has more experience with the awful effects of too much money printing than any other industrialized nation. If you are not familiar with that part of history, please read more about the Weimar Republic.

Combining the ECB policies along with Deutsche Bank’s (one of the largest derivatives holders in the world) precipitous demise, fears of a looming financial crises have become a possibility for the Germans and have subsequently caused this renewed interest in gold.

Here in the US, the liquidity scramble in the overnight repo market continues, as the latest operation was oversubscribed 5.9 times. As ZH pointed out, it simply means that the demand for the Fed’s permanent liquidity injection is increasing with every operation.

How long can that go on before we go exponential? And just as important, how long can this go on before equity markets realize that not all is well with the financial plumbing?

Be that as it may, at least for today, the major indexes moved aimlessly and looked to end up at their respective unchanged lines when a last-minute pump assured a green close.  

Read More