
- Moving the markets
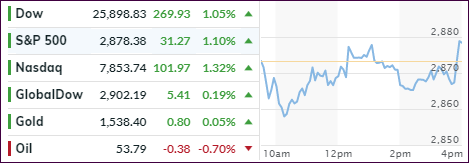
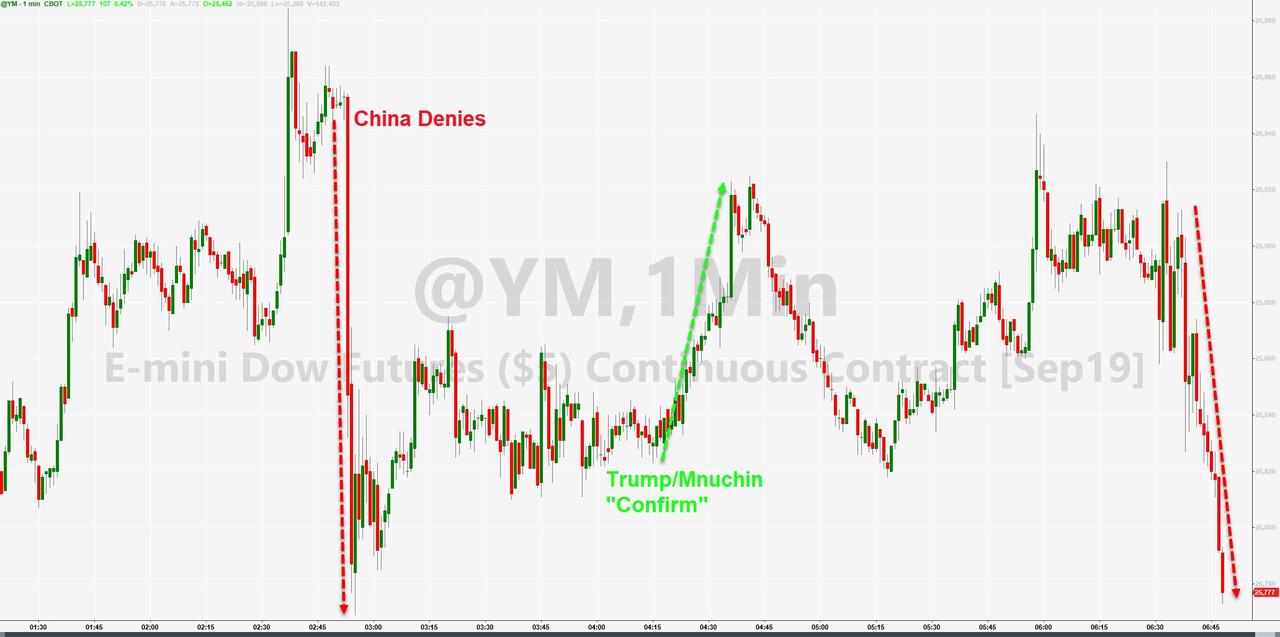
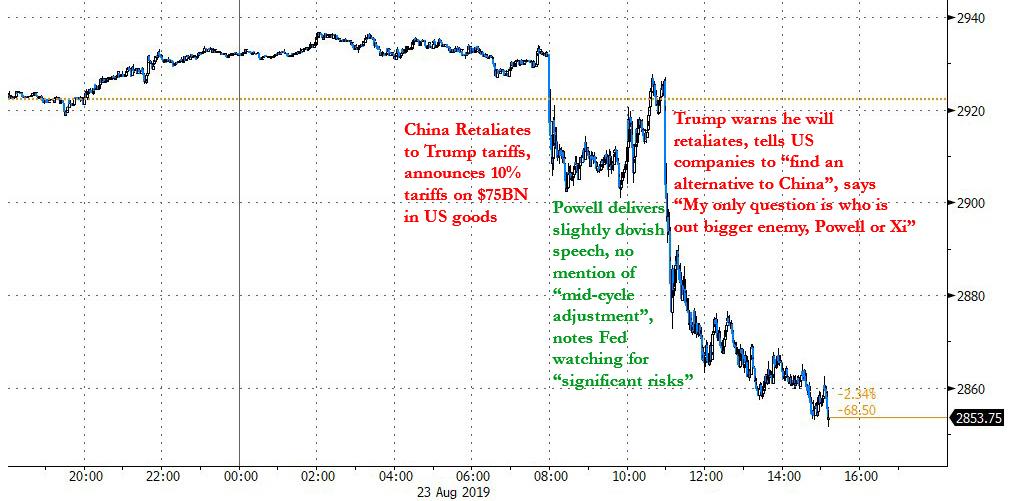
I was watching the futures markets last night as the major indexes were getting hammered on a follow through move from Friday’s sell-off. Even early this morning, the Dow had plunged 200 points when Trump suddenly announced that “China called our trade people last night and said let’s get back to the table.” He then told reporters that China called his team not once but twice in a bid to restart trade talks.
While that sounded good on the surface, the only problem was that none of this happened, according to China. Whatever the case may be, the objective was accomplished in that the markets reversed and soared, as the computer algos did not care about remarks by the Global China Times editor that Trump indeed “hallucinated” the 2 phone calls…
No, I am not making this up, and it is not April Fool’s Day either, this is nothing more than a sign of the insanity that drives the markets nowadays. ZH actually went through the trouble of charting some of this early morning idiocy.
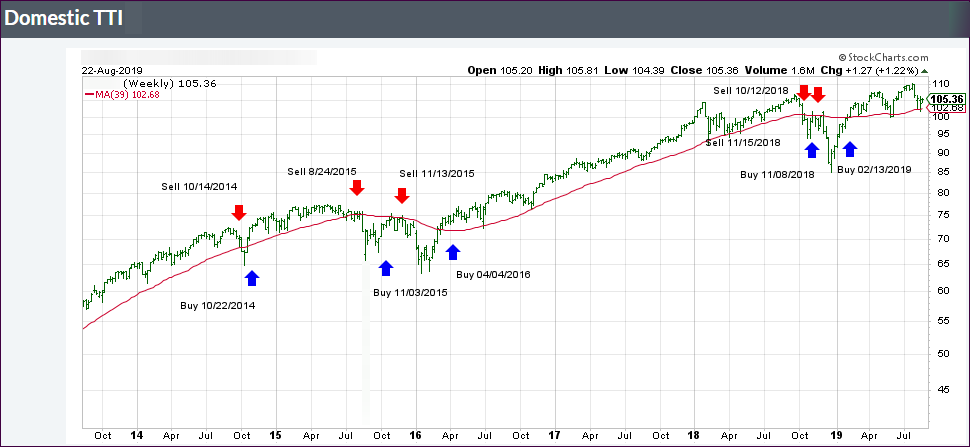
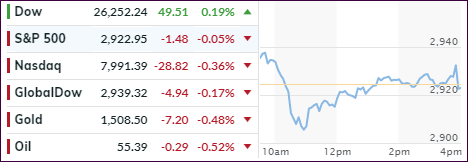
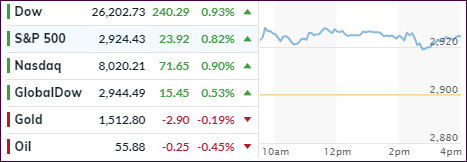
In the end, the intra-day meandering ended during the last hour of trading when the indexes shot up and closed in the green thereby delaying a potential ‘Sell’ signal for our Domestic Trend Tracking Index (TTI).
Read More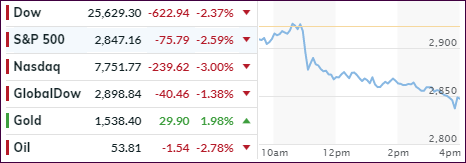