
- Moving the markets
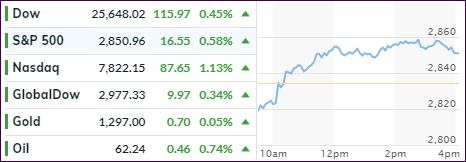
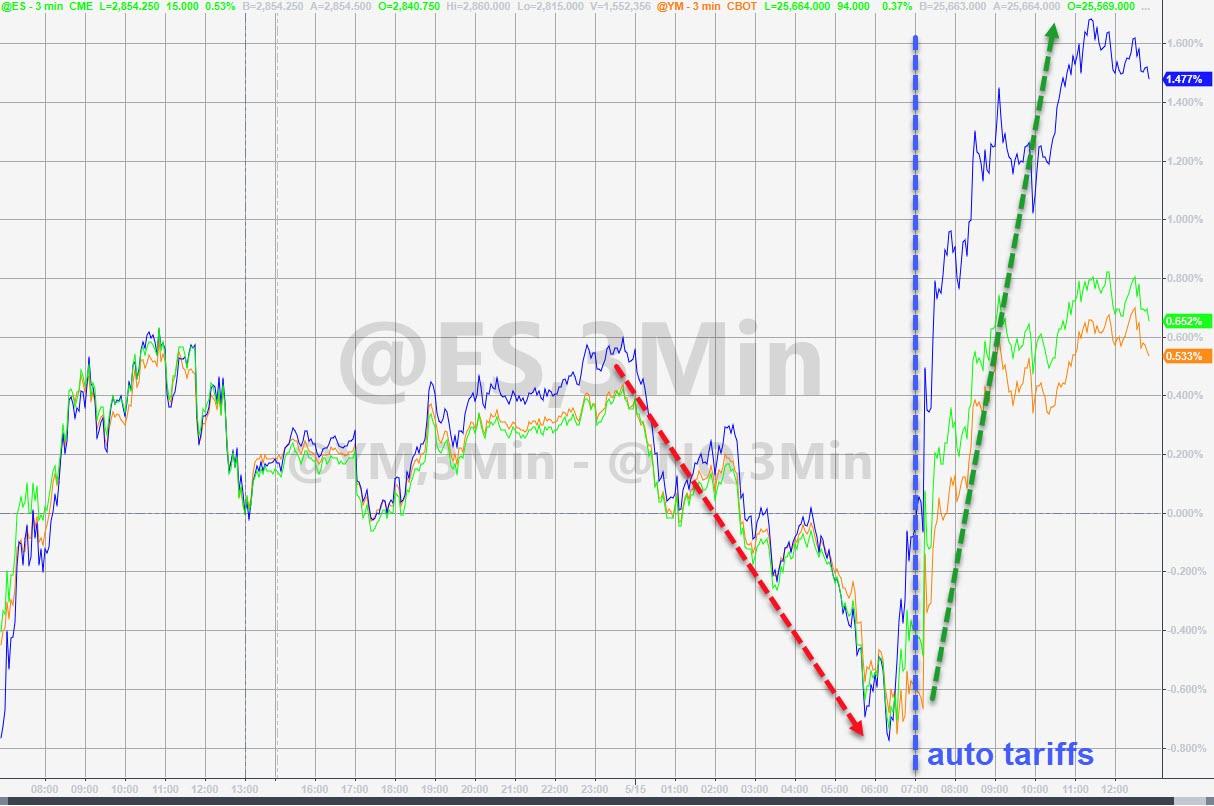
A market opening in the red turned into a positive, as trade hope was kept alive on that other trade war front, namely Europe. We heard that an unexpected bit of good news spread like wildfire when Trump announced that he plans to delay imposing tariffs on EU auto imports by six months.
That was good enough to change the mood on Wall Street to bullish, as it meant at least a temporary trade-ceasefire on one front, while the escalation with China could continue and morph into an outright trade war.
Domestically, retailers are seeing declining purchases for the second time in 3 months. This means consumer spending confirms a slowing economy, despite the widely touted low unemployment rate, which is supposed to represent a healthy labor market.
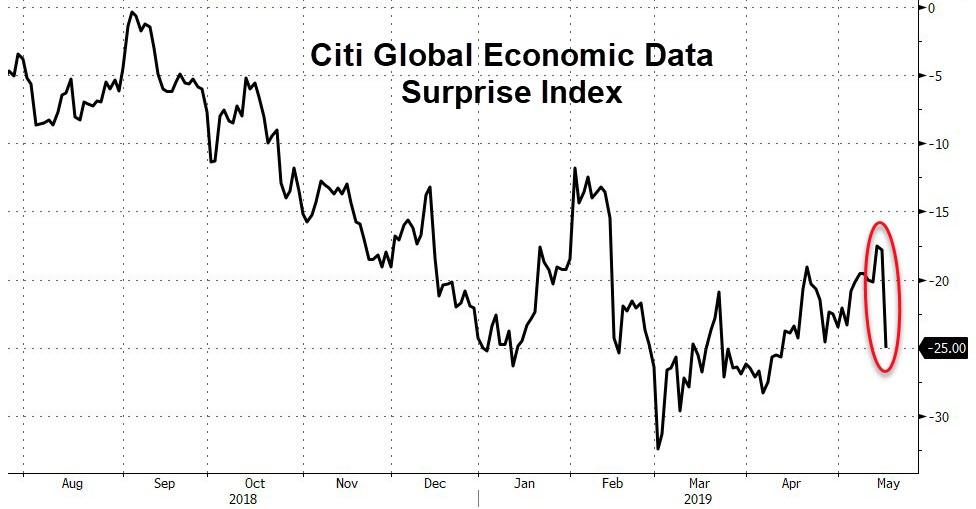
This weakness goes along with global data, which showed disappointment, as the Global surprise index kept heading south, which makes the current rally questionable as to whether it sits on a solid footing or is merely based on wishful thinking along with hope for more stimulus.
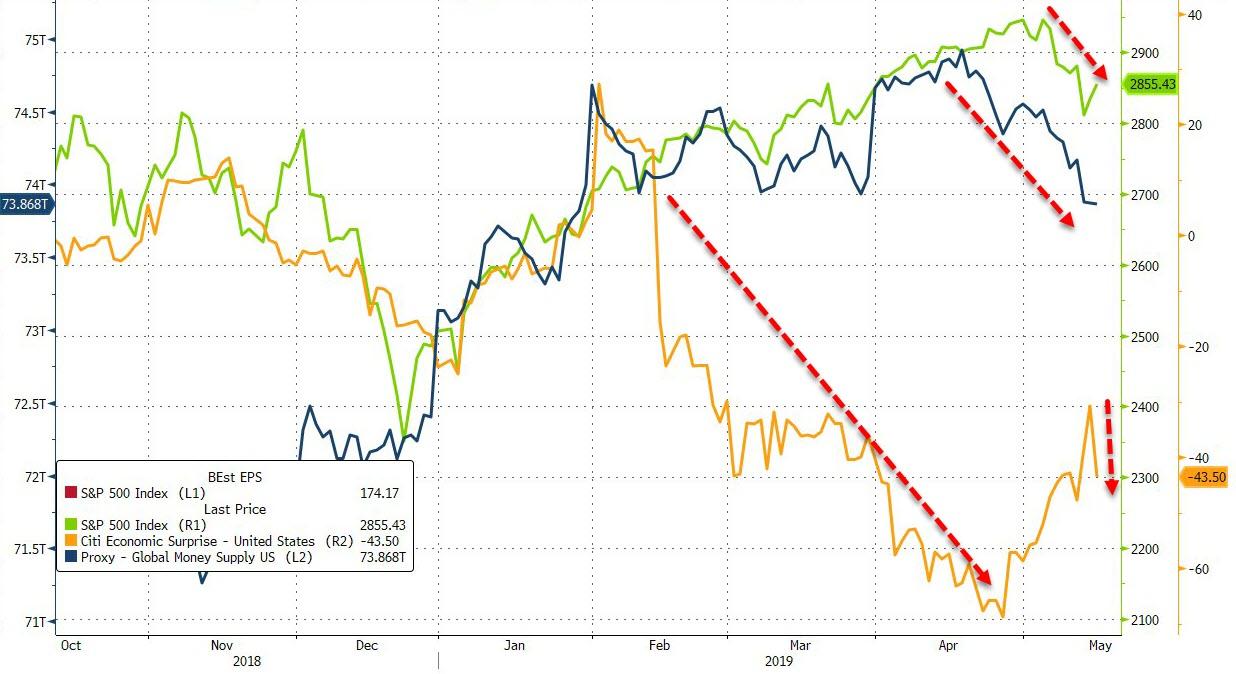
Thanks to ZH, we now have an updated chart showing that global money supply and fundamentals, as represented by the Citi Economic Surprise Index, are no longer supporting equities. We’ll have to wait and see ‘if’ and ‘when’ that reality sinks in.
2. ETFs in the Spotlight
In case you missed the announcement and description of this section, you can read it here again.
It features 10 broadly diversified and sector ETFs from my HighVolume list as posted every Saturday. Furthermore, they are screened for the lowest MaxDD% number meaning they have been showing better resistance to temporary sell offs than all others over the past year.
The below table simply demonstrates the magnitude with which some of the ETFs are fluctuating regarding their positions above or below their respective individual trend lines (%+/-M/A). A break below, represented by a negative number, shows weakness, while a break above, represented by a positive percentage, shows strength.
For hundreds of ETF choices, be sure to reference Thursday’s StatSheet.
For this current domestic “Buy” cycle, here’s how some our candidates have fared:
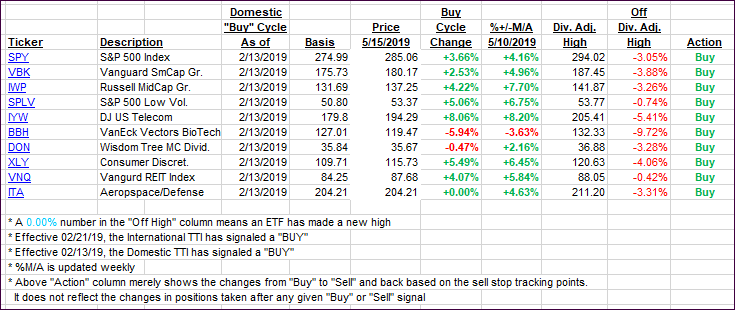
Again, the %+/-M/A column above shows the position of the various ETFs in relation to their respective long-term trend lines, while the trailing sell stops are being tracked in the “Off High” column. The “Action” column will signal a “Sell” once the -8% point has been taken out in the “Off High” column. For more volatile sector ETFs, the trigger point is -10%.
3. Trend Tracking Indexes (TTIs)
Our Trend Tracking Indexes (TTIs) headed higher with the International one reclaiming its trend line to the upside.
Here’s how we closed 05/15/2019:
Domestic TTI: +3.16% above its M/A (last close +2.84%)—Buy signal effective 02/13/2019
International TTI: +0.31% above its M/A (last close -0.05%)—Buy signal effective 02/21/2019
Disclosure: I am obliged to inform you that I, as well as my advisory clients, own some of the ETFs listed in the above table. Furthermore, they do not represent a specific investment recommendation for you, they merely show which ETFs from the universe I track are falling within the specified guidelines.
Contact Ulli