
- Moving the markets
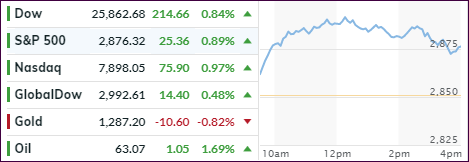
A third day of gains kept the bulls in charge with the major indexes ending up solidly in the green, as it turned out that a worsening global trade picture is now considered a good thing for equities. Go figure…
To be fair, an early assist came from a couple of blue-chip stocks, whose upbeat earnings helped to get things started in the bullish direction. Also, U.S. Labor and Housing market numbers were better than expected, all of which alleviated some of the ever-present worries over trade escalations.
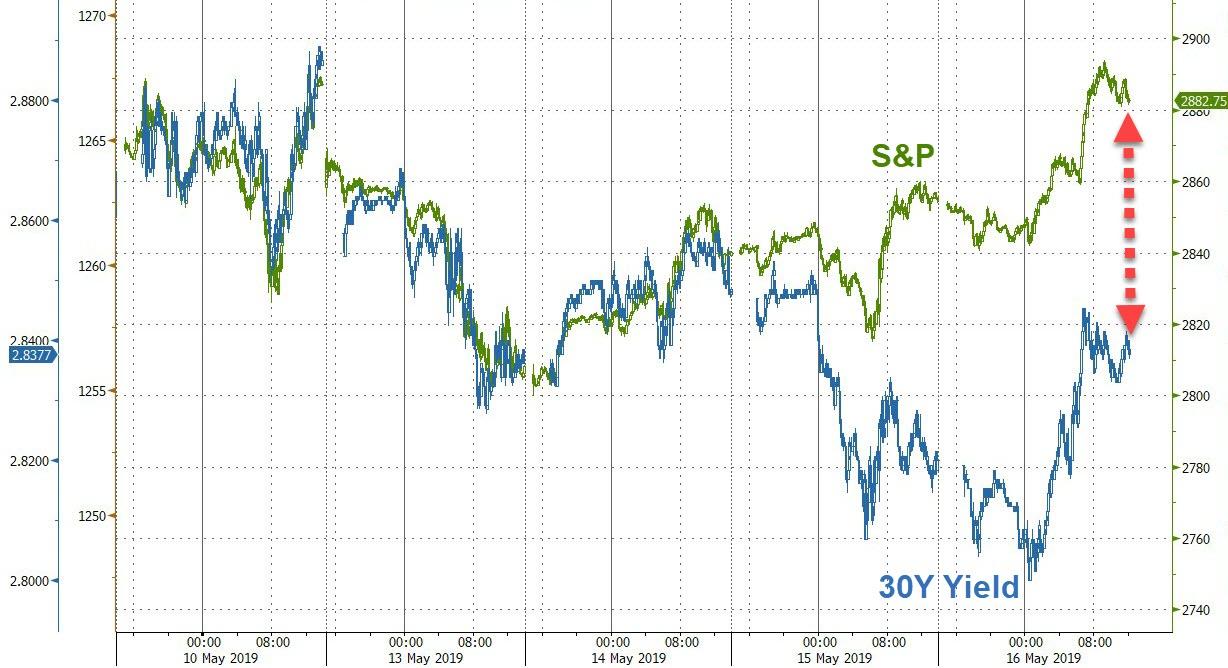
Conveniently ignored was the decoupling of stocks and bonds, which headed in different directions but will have to eventually fall back in sync. The question is: “will it be in favor of stocks or bonds?”
If you think that traders have a handle on what goes on in the markets, you may be pleased to hear that this is not the case. Here are some nuggets I’ve found when evaluating if we are in a ‘risk on’ or ‘risk off’ mode:
Trade tensions have eased. Trade tensions have ratcheted up.
Things will get better. They have to. It’ll get worse before it gets better. Neither side can afford to back down.
Use game theory to figure this whole situation out. Use it to create a game plan.
React to every comment. It’s the only way to survive.
Buy the dip. Derisk.
And, of course, what is really the punchline: The global economy is set to grow and is in a “good place;” the numbers are cratering fast.
Which is it?
One trader added this bon mot: Nobody know what’s going on, but everyone is buying just in case.
There you have it. It appears to be a mad house with everyone scrambling for explanations, which would be funny, if this whole environment wouldn’t be so critical for the survival of your portfolio.
I think the only reasonable thing to do is to have a clearly defined exit strategy, just in case this house of cards comes crumbling down, which it eventually will.
2. ETFs in the Spotlight
In case you missed the announcement and description of this section, you can read it here again.
It features 10 broadly diversified and sector ETFs from my HighVolume list as posted every Saturday. Furthermore, they are screened for the lowest MaxDD% number meaning they have been showing better resistance to temporary sell offs than all others over the past year.
The below table simply demonstrates the magnitude with which some of the ETFs are fluctuating regarding their positions above or below their respective individual trend lines (%+/-M/A). A break below, represented by a negative number, shows weakness, while a break above, represented by a positive percentage, shows strength.
For hundreds of ETF choices, be sure to reference Thursday’s StatSheet.
For this current domestic “Buy” cycle, here’s how some our candidates have fared:
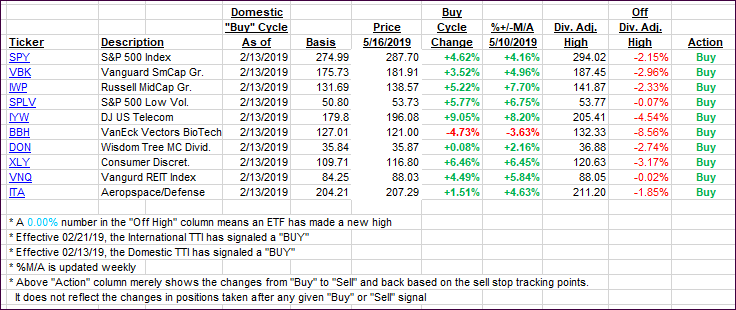
Again, the %+/-M/A column above shows the position of the various ETFs in relation to their respective long-term trend lines, while the trailing sell stops are being tracked in the “Off High” column. The “Action” column will signal a “Sell” once the -8% point has been taken out in the “Off High” column. For more volatile sector ETFs, the trigger point is -10%.
3. Trend Tracking Indexes (TTIs)
Our Trend Tracking Indexes (TTIs) improved again and moved deeper into bullish territory.
Here’s how we closed 05/16/2019:
Domestic TTI: +3.86% above its M/A (last close +3.16%)—Buy signal effective 02/13/2019
International TTI: +0.81% above its M/A (last close 0.31%)—Buy signal effective 02/21/2019
Disclosure: I am obliged to inform you that I, as well as my advisory clients, own some of the ETFs listed in the above table. Furthermore, they do not represent a specific investment recommendation for you, they merely show which ETFs from the universe I track are falling within the specified guidelines.
Contact Ulli