
- Moving the markets
While yesterday’s initial market reaction to the signing of the Phase-1 US-China trade deal was merely a yawn followed by a modest sell-off, today things looked different.
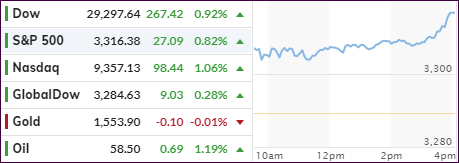
Optimism was soaring with the major indexes scoring new record highs, as traders had a chance to digest the trade truce. The 96-page agreement lays out that China is supposed to purchase $95 billion more in US commodities than in 2017, and roughly more than $100 billion in manufactured goods and services, according to MarketWatch.
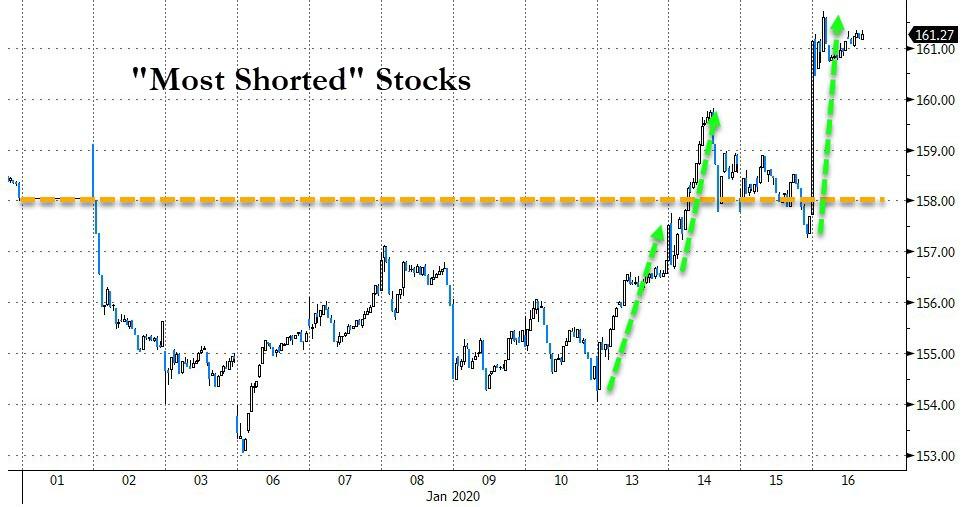
However, as always, doubt exists whether this agreement can lead to a lasting accord, as the Phase-2 negotiations are being prepared. But, for right now, the markets are pleased that expectations have been met. Also throwing an assist was the Senate approval of a new trade deal between the U.S., Mexico and Canada, along with a huge short squeeze.
On the economic front, things took a turn for the better with the Philly Fed Business Outlook spiking from a revised 2.4 to 17, which was far above expectations of 3.8. Then December Retail Sales surprised to the upside, despite an Online Sales slowdown, according to ZH. Ex-autos, the index surged 0.7% vs. and expected 0.5% rise.
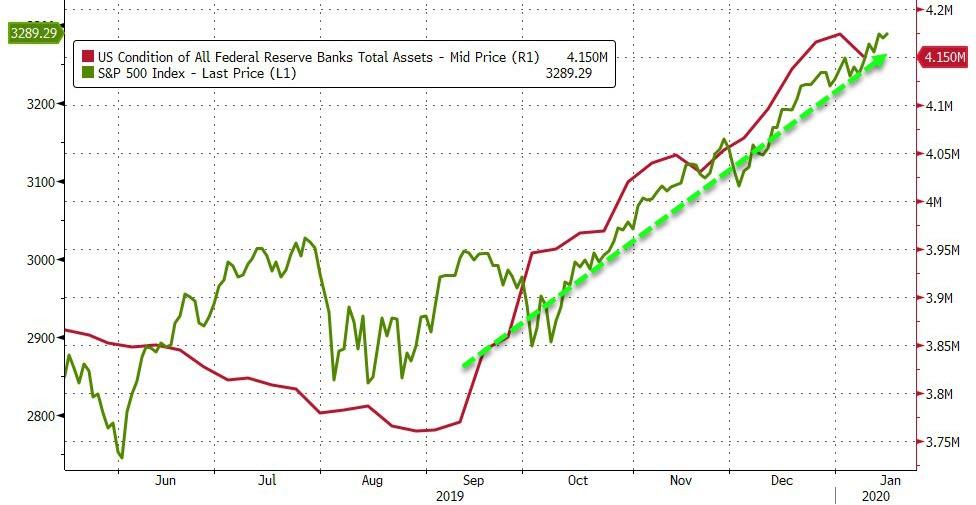
Of course, all of this pales compared to the real reason for the ongoing market levitations, namely the growth of the Fed’s balance sheet, as this chart shows. To be clear, it’s not just the Fed, but all Central Bank policies in unison, that seem to push equity prices to ever higher levels.
Right now, we are enjoying the ride.
Read More