Moving From Optimism To Pessimism, But Markets Recover

Ulli Market Commentary Contact

[Chart courtesy of MarketWatch.com]
  1. Moving the markets

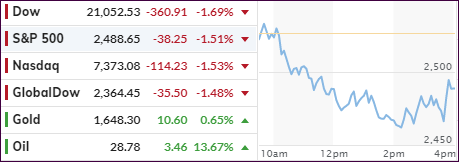
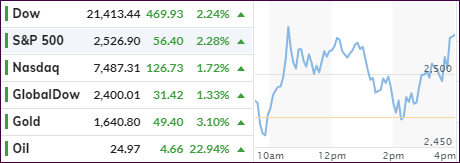
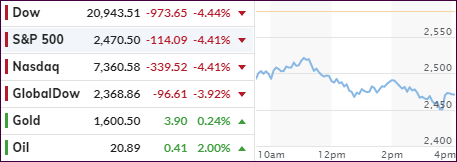
As this chart shows, news about the coronavirus played havoc with market direction over the past 3 days, with optimism causing rallies and pessimism pulling equities back down.

The overall impact was relatively minor so far, given the relentless march higher over the past few months. An early drop caught some support, and a slow but steady climb out of that early hole helped the major indexes to close moderately in the green, with the Dow falling just short.

Still, China continues to struggle to get a handle on the viral outbreak that has so far killed 17 people and infected 650 in several countries, according to MarketWatch. Helping the markets recover was a statement from WHO (World Health Organization) that they will not yet declare the coronavirus outbreak to be a global health emergency.

A good old-fashioned short squeeze kicked in, after the early market drop, and made its contribution to the recovery of the indexes back towards the unchanged line. As the Nasdaq touched new record highs, bond yields went the other way causing a divergence, one of the many we’ve seen over the last year, with none of them having affected equities negatively.

For right now, the major trend remains firmly in place.

Read More

No Market Report

Ulli Uncategorized Contact

A variety of engagements kept me away from the office, so that I won’t be able to write today’s report.

Regular posting will resume tomorrow.

Ulli…

Snapping The Winning Streak

Ulli Market Commentary Contact

[Chart courtesy of MarketWatch.com]
  1. Moving the markets

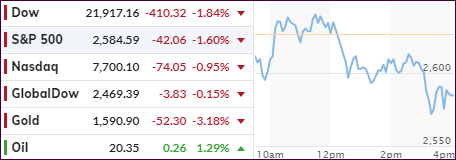
Sometimes, any reason will do for the markets to pull back, especially after they’ve been on a relentless tear. Today, news of the first case of the coronavirus in the U.S. seemed to dampen spirits, and risk assets were sold.

No surprise there, because after the record setting run of the major indexes, a pull back was way overdue, after the S&P had risen for two consecutive weeks, while the Nasdaq had been on fire sporting gains for six straight weeks.

So, today’s less than -0.5% retreat is not even newsworthy. Not helping the Dow was Boeing, whose troubles with their 737 Max airplanes don’t seem to go away and news, that the company is in talks “to secure a loan of $10 billion or more,” certainly did not create any warm and fuzzy feelings for investors.

You could consider today’s market activity simply being a case of investor fatigue, as in addition to the above, sluggish economic growth outside the U.S., and the start of the impeachment trial, all combined to let the bears finally have their moment in the sun.

Read More

ETFs On The Cutline – Updated Through 01/17/2020

Ulli ETFs on the Cutline Contact

Below, please find the latest High-Volume ETF Cutline report, which shows how far above or below their respective long-term trend lines (39-week SMA) my currently tracked ETFs are positioned.

This report covers the HV ETF Master List from Thursday’s StatSheet and includes 322 High Volume ETFs, defined as those with an average daily volume of more than $5 million, of which currently 292 (last week 288) are hovering in bullish territory. The yellow line separates those ETFs that are positioned above their trend line (%M/A) from those that have dropped below it.

Take a look:                                                                   

The HV ETF Master Cutline Report

In case you are not familiar with some of the terminology used in the reports, please read the Glossary of Terms. If you missed the original post about the Cutline approach, you can read it here.      

ETF Tracker Newsletter For January 17, 2020

Ulli ETF Tracker Contact

ETF Tracker StatSheet          

You can view the latest version here.

CLOSING A SOLID WEEK WITH A STRONG FINISH

[Chart courtesy of MarketWatch.com]
  1. Moving the markets

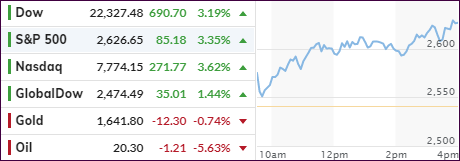
The record setting pace continued with all major indexes scoring impressive gains. The S&P 500 managed to add almost 2% in the past five trading days alone and has traded now 70 straight days without a 1% loss.

While some econ numbers were less than impressive, Housing Starts surged 16.9% MoM to the their highest since 2006, despite a sharp drop in Permits, which shrank -3.9% MoM, far worse than the -1.5% expected.

Wall Street simply remains in rally mode with weak data being ignored, and strong ones being used to boost stocks to ever higher levels. Regarding the above housing numbers, it’s important to note that they are one of the more critical metrics used to evaluate the health of the economy, while the Fed’s low interest rate policy keeps the buying interest up.

Sure, as ZH pointed out correctly, stocks have reached most expensive and most overbought levels, which even surpass the DotCom bubble. This is a bull market on steroids thanks to the loose Central Bank policies, as I have pointed out before.

We’re overdue for a correction, but this being an election year, whatever the powers to be can do will be done to keep the markets elevated. After all, when it comes time to cast your vote, you will vote based on how you feel about the economic circumstances.

Right now, the markets give the feeling of being one giant party; and we will dance along but stay as close to the exit doors as we can.

Read More

Weekly StatSheet For The ETF Tracker Newsletter – Updated Through 01/16/2020

Ulli ETF StatSheet Contact

ETF Data updated through Thursday, January 16, 2020

Methodology/Use of this StatSheet:

1. From the universe of over 1,800 ETFs, I have selected only those with a trading volume of over $5 million per day (HV ETFs), so that liquidity and a small bid/ask spread are assured.

2. Trend Tracking Indexes (TTIs)

Buy or Sell decisions for Domestic and International ETFs (section 1 and 2), are made based on the respective TTI and its position either above or below its long-term M/A (Moving Average). A crossing of the trend line from below accompanied by some staying power above constitutes a “Buy” signal. Conversely, a clear break below the line constitutes a “Sell” signal. Additionally, I use a 7.5% trailing stop loss on all positions in these categories to control downside risk.

3. All other investment arenas do not have a TTI and should be traded based on  the position of the individual ETF relative to its own respective trend line (%M/A). That’s why those signals are referred to as a “Selective Buy.” In other words, if an ETF crosses its own trendline to the upside, a “Buy” signal is generated. Since these areas tend to be more volatile, I recommend a wider trailing sell stop of 7.5% -10% depending on your risk tolerance.

If you are unfamiliar with some of the terminology, please see Glossary of Terms and new subscriber information in section 9.     

1. DOMESTIC EQUITY ETFs: BUY — since 02/13/2019

Click on chart to enlarge

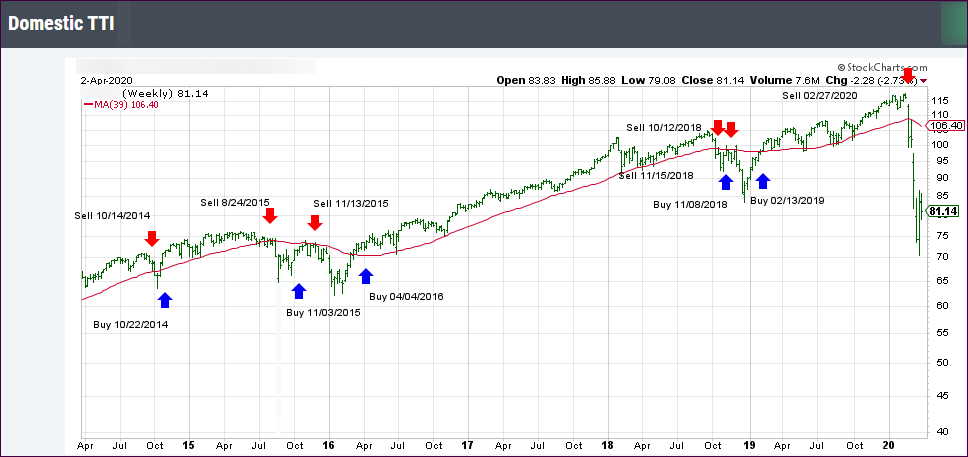
Our main directional indicator, the Domestic Trend Tracking Index (TTI-green line in the above chart) is now positioned above its long-term trend line (red) by +9.49% after having generated a new Domestic “Buy” signal effective 2/13/19 as posted.

Read More