
ETF Tracker StatSheet
You can view the latest version here.
Markets Melt Up Due To Better Than Expected Jobs Report
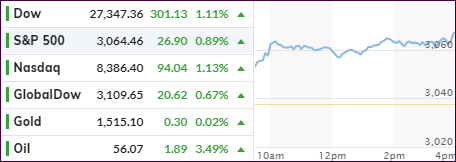
- Moving the markets
The jobs report proved to be the dominating market force today, as October lost its luster as a bull market killer. The US economy added 128k jobs, which was far better than the expected 85k. Another bullish surprise were the upside revisions in employment gains in August and September, which combined were 95,000 more than previously reported.
Manufacturing suffered due to the strike at GM causing a decline of almost 42k automaker jobs but, now that the strike is over, a rebound of similar magnitude is expected next month.
The oddity that stocks continue to rally as bond yields rise, despite the Fed’s easing policy, seems contrary to conventional wisdom—and it is. This scenario has, short-term, not worked out well for the low volatility ETF SPLV, which has not participated in the current rally, as it did for the first 9 months of this year.
As a result, the S&P 500 (SPY +11.34%) is closing in on SPLV’s performance (+13.23%), but it has not caught up yet, however, given current circumstances, I will make some adjustments to our holdings.
Not all of today’s melt-up was due to the jobs report, as variety of officials were called up to keep the mood bullish.
ZH summed up the events in this timeline:
0830ET Jobs Beat – Dow +100
0915ET Fed’s Kashkari dovish: “we’re not at maximum employment.. in free lunch zone” – Dow +20
0920ET Mnuchin: “constructive talks, working hard” – Dow +30
0930ET Fed’s Rosengren hawkish: further monetary accommodation not needed – Dow unch
0935ET Fed’s Clarida neutral: “we will be data-dependent, economy/consumer in good place” – Dow unch
0936ET Fed’s Kaplan dovish: “growth in US is decelerating, need skills-based immigration”
0937ET Kudlow: White House wants tax cuts for middle class, Trump optimistic on trade deal – Dow unch
0945ET Kudlow: “enormous progress on IP theft” – Dow +30.
0950ET Record high for S&P and Nasdaq
0955ET Kudlow: “US-China trade call may be happening now, Ag & FX parts virtually completed” – Dow +20
1000ET ISM Manufacturing MISS, 3rd month of contraction (bad news is good news) – Dow +50
1050ET Mission Accomplished – Dow futs take out post-Powell high stops
1215ET Dow futs stops run and fade begins into EU close
1255ET USTR: “constructive trade talks today” – Dow unch
1300ET Fed’s Quarles dovish: current policy stance “likely to remain appropriate… unless data weakens” – Dow unch
1310ET MOFCOM: “constructive trade talks today, achieved consensus” – Dow +20
1325ET Fed’s Daly neutral/hawkish: “annual wage growth of about 3% is good news” – Dow unch
1450ET Fed’s Williams neutral/hawkish: “economy is in a very good place, it is strong” – Dow -10
1600ET RECORD CLOSE FOR S&P AND NASDAQ
Of course, the Fear & Greed index paints a different picture and has risen to a height last seen in January of 2018. Every time this indicator has reached current levels, it abruptly changed direction. Will it be different this time?
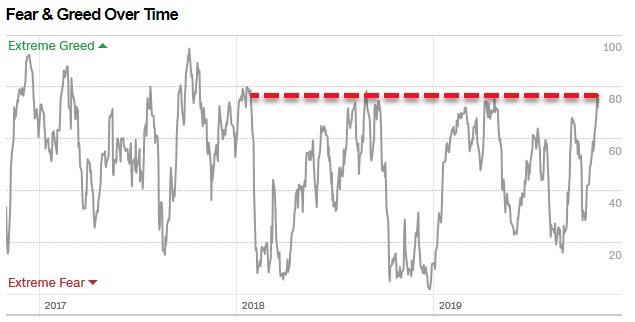
2. ETFs in the Spotlight
In case you missed the announcement and description of this section, you can read it here again.
It features 10 broadly diversified and sector ETFs from my HighVolume list as posted every Saturday. Furthermore, they are screened for the lowest MaxDD% number meaning they have been showing better resistance to temporary sell offs than all others over the past year.
The below table simply demonstrates the magnitude with which some of the ETFs are fluctuating regarding their positions above or below their respective individual trend lines (%+/-M/A). A break below, represented by a negative number, shows weakness, while a break above, represented by a positive percentage, shows strength.
For hundreds of ETF choices, be sure to reference Thursday’s StatSheet.
For this current domestic “Buy” cycle, here’s how some our candidates have fared:

Again, the %+/-M/A column above shows the position of the various ETFs in relation to their respective long-term trend lines, while the trailing sell stops are being tracked in the “Off High” column. The “Action” column will signal a “Sell” once the -8% point has been taken out in the “Off High” column. For more volatile sector ETFs, the trigger point is -10%.
3. Trend Tracking Indexes (TTIs)
Our Trend Tracking Indexes (TTIs) jumped as a result of a great jobs report and plenty of positive jawboning by the officialdom.
Here’s how we closed 11/01/2019:
Domestic TTI: +4.98% above its M/A (prior close +3.98%)—Buy signal effective 02/13/2019
International TTI: +2.94% above its M/A (prior close +2.14%)—Buy signal effective 10/29/2019
Disclosure: I am obliged to inform you that I, as well as my advisory clients, own some of the ETFs listed in the above table. Furthermore, they do not represent a specific investment recommendation for you, they merely show which ETFs from the universe I track are falling within the specified guidelines.
———————————————————-
WOULD YOU LIKE TO HAVE YOUR INVESTMENTS PROFESSIONALLY MANAGED?
Do you have the time to follow our investment plans yourself? If you are a busy professional who would like to have his portfolio managed using our methodology, please contact me directly or get more details here.
———————————————————
Back issues of the ETF Tracker are available on the web.
Contact Ulli