
- Moving the markets
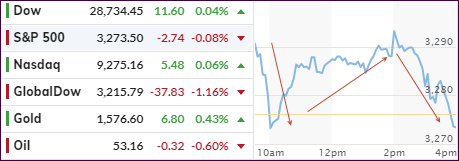
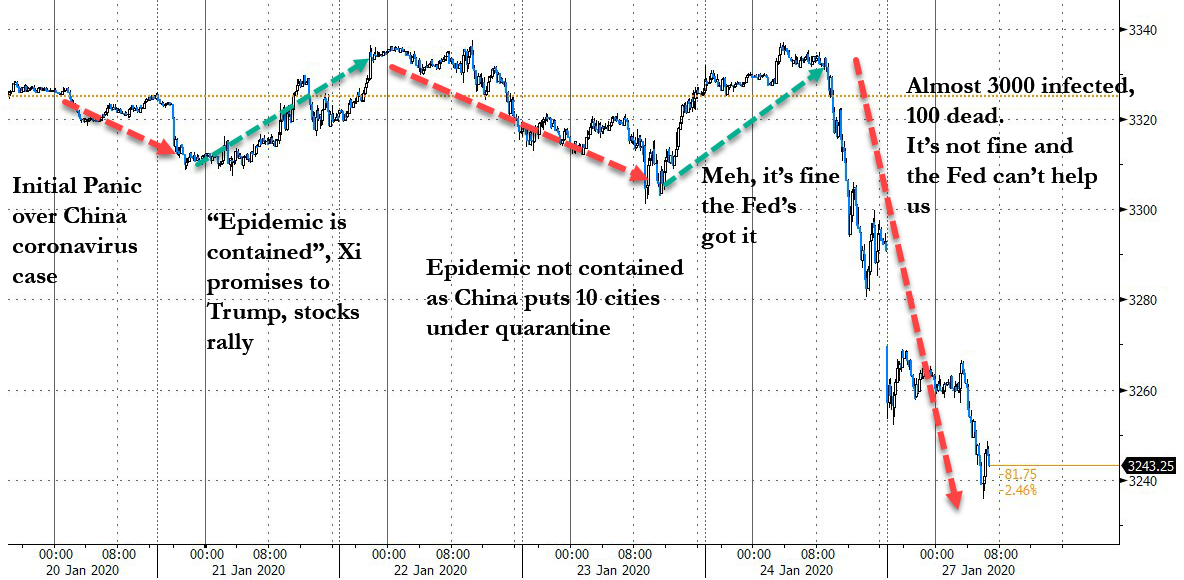
In the end, today was nothing but one gigantic roller coaster ride, as an early rally lost steam, then found some fresh upward momentum, which was all given back at the close.
Maybe the early pump was the result of Apple’s blow-out earnings announced yesterday after the close, but it sure had no staying power with worldwide markets, as represented by the Global Dow, suffering as well.
In the meantime, the coronavirus deaths are spiraling higher with new cases being reported every day. Even Fed chair Powell, after leaving interest rates unchanged, commented that they are monitoring the effects of the virus and its potential for disrupting the global economy:
“It’s a serious issue. There is likely to be some disruption of activity in China and probably globally,” he told reporters, unprompted, in a news conference after the central bank’s first rate-setting meeting of the year. “We’ll just have to wait to see what the effect is globally.”
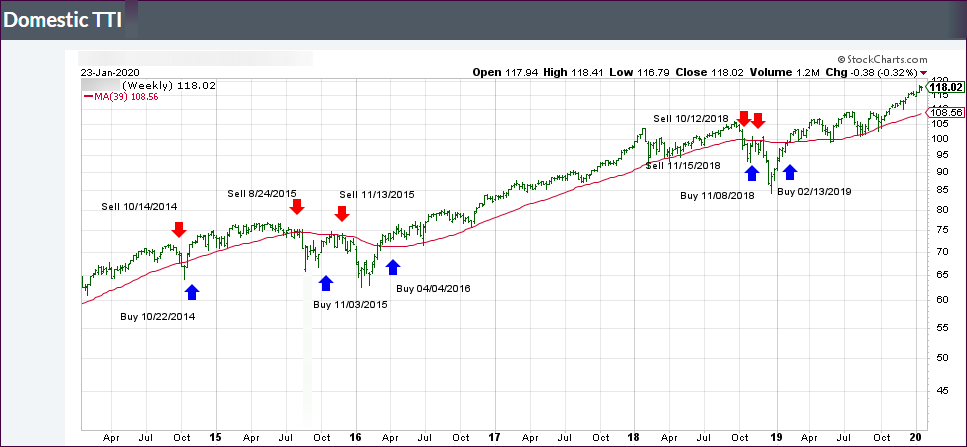
These virus issues are sure to stay with us for a while with the unanswered question remaining: Will the potential fallout be severe enough to unravel this bullish trend? It’s possible, since it does not look like the contagion can be contained within a short period of time.
Read More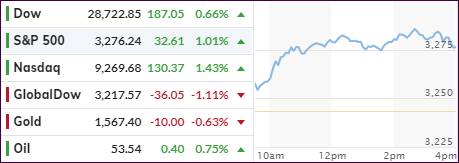
