It comes as no surprise that after last week’s market
drubbing, a rebound of some sort was in order. One analyst quipped by posting
the question: Can a cat with a coronavirus bounce?
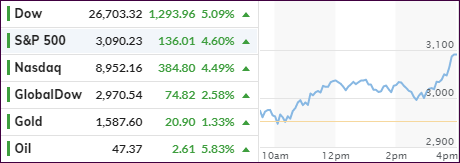
At least for right now, it seems that way, as the major
indexes, motivated and supported by the Bank of Japan’s (BoJ) massive buying of
almost $1 billion US dollars in stock ETFs, designed to stabilize markets, helped
to create an overall positive sentiment to start the week.
So far, the Fed has been quietly absent and may have second
thoughts about intervening in the markets, other than jawboning last Friday that
“the coronavirus poses evolving risks to economic activity. The Federal
Reserve is closely monitoring developments and their implications for the
economic outlook. We will use our tools and act as appropriate to support the
economy.”
Of course, expectations keep growing that Central Bankers
will act in unison to attempt to stem the economic fallout from the virus.
Still, traders are anxiously watching to see for how long not only supply chains,
but also future corporate earnings will be affected.
I found analyst’s Mike Whitney’s summary most appropriate:
“Well, next week the Fed will announce that
it is slashing rates by 50 basis points and that it’s coordinating its action
with its fellow central banks, the BoE, the BoJ, and the ECB.
The Fed might also announce an additional
liquidity program aimed at banks and financial institutions that suddenly find
they themselves unable to borrow at the Fed’s discount rate.
The announcement could ignite a relief rally,
but the surge is not likely to last long since it will not have any material
effect on either the virus or the disruptions to supply-lines. The Fed’s easy
money will not create the Chinese-made components that laptop manufacturers
need to sell their products.
They won’t put skittish workers back in the
factories or passengers back on airplanes or consumers back in the retail
stores. The Fed’s low rates are designed to stimulate demand, but they do
nothing to mitigate a “supply shock”. Regrettably, the problem is on the supply
side not the demand side.”
Right now, the markets are looking to stop last week’s
bleeding. It will take a little more than a one-day reflex
rally, based on intervention hopes, to re-establish the bullish trend.
Below, please find the latest High-Volume ETF Cutline
report, which shows how far above or below their respective long-term trend
lines (39-week SMA) my currently tracked ETFs are positioned.
This report covers the HV ETF Master List from Thursday’s
StatSheet and includes 322 High Volume ETFs, defined as those with an average
daily volume of more than $5 million, of which currently 73 (last week 272) are
hovering in bullish territory. The yellow line separates those ETFs that are
positioned above their trend line (%M/A) from those that have dropped below it.
In case you are not familiar
with some of the terminology used in the reports, please read the Glossary of Terms.
If you missed the original
post about the Cutline approach, you can read it here.
I
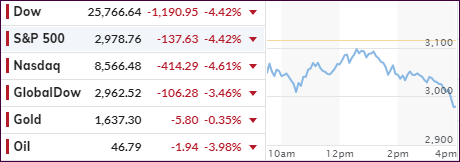
thought that after the drubbing of the past few days, with us getting out of
the market altogether, that a rebound might finally be in order. But no such
luck, as the Dow continued swan diving by being down another 1,000 points
shortly after the opening, but it recovered at the end of the session. Losses were
heavy for the week with the S&P 500 plunging some -11.5%.
Again,
the fact the world may be facing a combination of supply and demand shock seems
to be slowly sinking in and is clearly reflected in this week’s sell-off, as markets
are anticipatory in nature—and in this case are anticipating the worst.
One
analyst explains it in a simplified way:
China
has closed a reported 70,000 movie theatres because of the virus. That’s a
supply shock, and no amount of income (demand) stimulus will boost ticket
sales. Of course, people may increase the number of downloads of films and
games to play at home, as we have seen, but this is nothing more than drops in
the ocean in terms of the overall economy.
Despite
calls for the Fed to cut rates as an emergency measure, officials so far have pushed
back and have remained non-committal. I believe that by next week, we might see
a change of heart with Central Bankers creating coordinated efforts to cut rates
and increase liquidity, all in the hope of putting a floor under this market.
While
this may boost equities on a short-term basis, the Fed can’t print a vaccine to
solve the coronavirus issue, so we’ll be back shortly having to face and deal with
the fallout effects.
To
put this week’s bloodbath into perspective, ZH posted that the Dow saw its fastest
collapse from an all-time peak since 1928, while the S&P 500 suffered its
fastest peak-to-correction plunge ever.
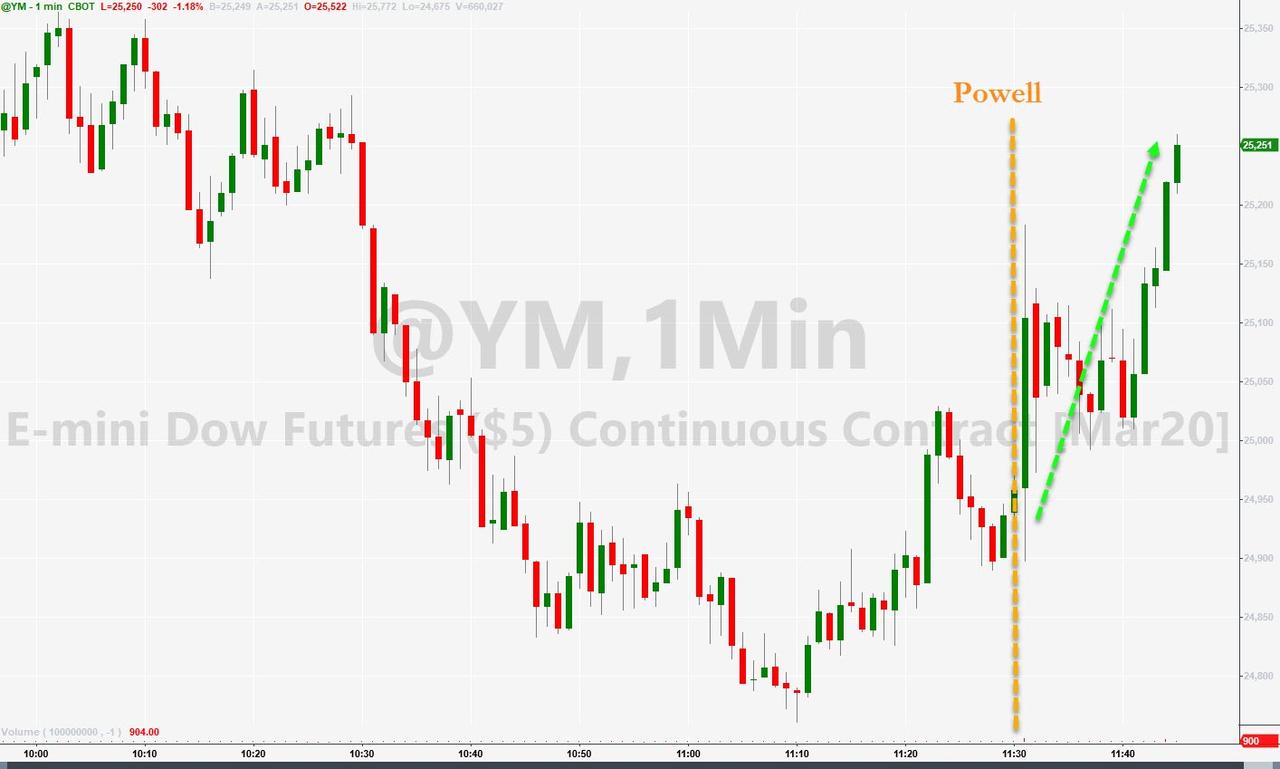
Fed
head Powell made an appearance and spoke in general terms to calm the markets,
which finally created a small rebound
effect. Even if the now anticipated rate cut materializes, the outcome is far from
being certain. ZH summed it up best:
In
other words, if or rather when the corona pandemic gets even worse after
central banks have fired their collective bazooka, the market’s response will
be far more adverse as central banks will have staked their credibility on
being able to offset the economic consequences of the pandemic (they can’t,
unless they can print viral antibodies), while investors will now be looking
into the abyss…
Nobody
knows how this will play, but I am glad we’re watching this movie from the
sidelines.
ETF Data
updated through Thursday, February 27, 2020
Methodology/Use of this StatSheet:
1. From the universe of over 1,800 ETFs, I have selected only those with a
trading volume of over $5 million per day (HV ETFs), so that liquidity and a
small bid/ask spread are assured.
2. Trend Tracking Indexes (TTIs)
Buy or Sell decisions for Domestic and International ETFs (section 1 and
2), are made based on the respective TTI and its position either above or below
its long-term M/A (Moving Average). A crossing of the trend line from below
accompanied by some staying power above constitutes a “Buy” signal. Conversely,
a clear break below the line constitutes a “Sell” signal. Additionally, I use a
7.5% trailing stop loss on all positions in these categories to control
downside risk.
3. All other investment arenas do not have a TTI and should be traded
based on the position of the individual
ETF relative to its own respective trend line (%M/A). That’s why those signals
are referred to as a “Selective Buy.” In other words, if an ETF crosses its own
trendline to the upside, a “Buy” signal is generated. Since these areas tend to
be more volatile, I recommend a wider trailing sell stop of 7.5% -10% depending
on your risk tolerance.
If you are unfamiliar with some of the terminology, please see Glossary of Termsand new subscriber information in section 9.
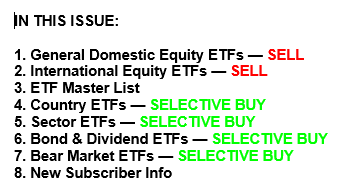
1. DOMESTIC EQUITY ETFs: SELL
— since 02/27/2020
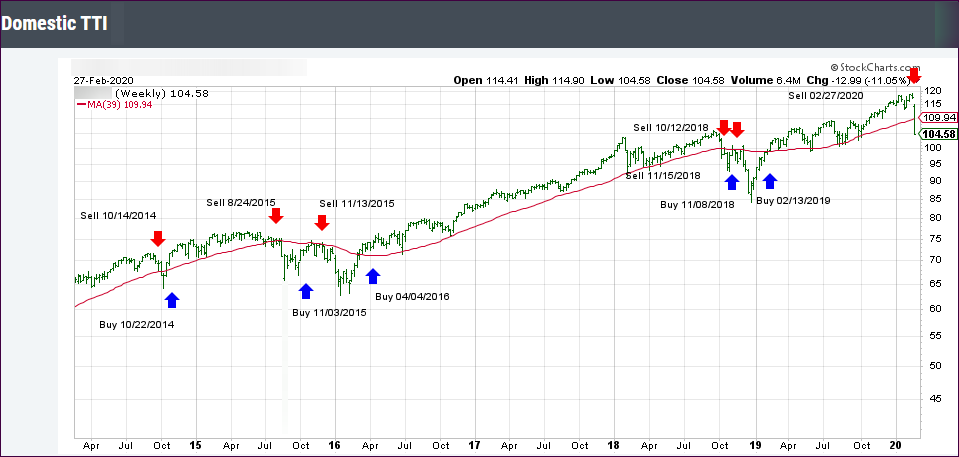
Click on chart to enlarge
Our main
directional indicator, the Domestic Trend Tracking Index (TTI-green line in the
above chart) is now positioned below its long-term trend line (red) by -4.75%
after having generated a new Domestic “Sell” signal effective 2/27/20 as
posted.
The link
below shows all High Volume (HV) Domestic Equity ETFs. The sorting order is by
M-Index ranking. Prices in all linked tables below are updated through 02/27/2020,
unless otherwise noted. Price data not yet available at publication is
indicated with 00.00% or -100.00%. Please note that distributions are not
included in the current momentum numbers.
Whenever the
TTI is above the trend line, and therefore in “Buy” mode, you can either use
the tables in the link below to make your selections or choose from the 10 ETFs
in the Spotlight, which are featured daily as part of the market commentary:
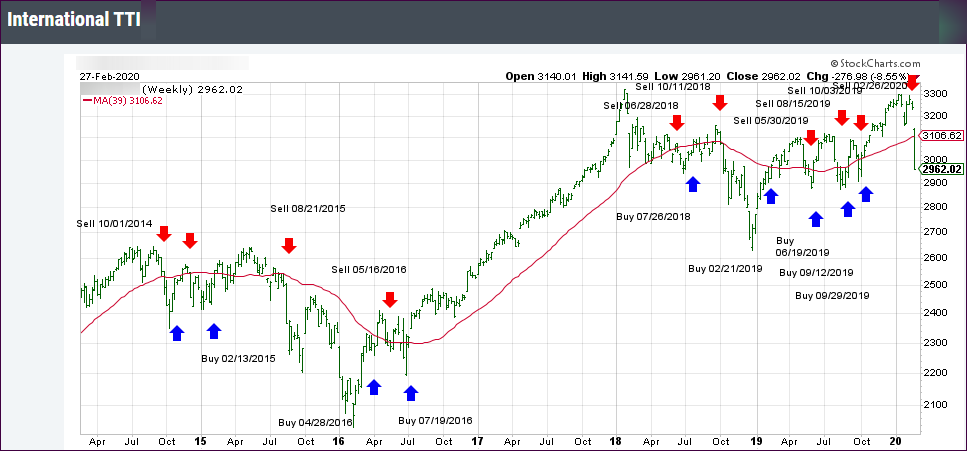
The
International Trend Tracking Index (green) has now moved -4.58% below its
long-term trend line (red) after having generated a new SSell” signal effective
10/29/2019. It’s been on a wild rollercoaster ride all year, since
international markets showed far more uncertainty and volatility than the US
environment.
The listings
in the link below represent the High Volume (HV) International ETFs I track to
be used during a Buy cycle. They are sorted by M-Index ranking:
This ETF
Master list shows the total of all ETFs listed, which allows you to get a quick
overview of leaders and laggards. The sorting order is by M-Index. Momentum
figures for all ETFs are not adjusted for dividends.
The link below
contains a list of HV ETFs for countries/regions, which I am tracking weekly.
Please note that data in this table does not include adjustments due to
distributions.
Country
funds, especially over the past few years, have been volatile. So, the use of a
trailing stop loss (I use 10%) is imperative to protect your portfolio from
severe downside moves.
5. SECTOR ETFs: SELECTIVE
BUY
To diversify
our portfolios, we always need to look for different opportunities to invest
our money. The table of HV Sector ETF listings in the following link covers a
broad spectrum of possibilities. The sorting order is by M-Index:
Here too, I
recommend the use of a 10% trailing stop loss to minimize the risk.
6. BOND & DIVIDEND ETFs: SELECTIVE BUY
If you
prefer using ETFs for the generation of income, here’s a list of bond and
dividend paying ETFs. It’s important to first look at how these instruments
have held up in terms of momentum figures. Then you should visit your favorite
financial web site to examine yield and other details.
Please note
that data in this table does not include adjustments due to distributions.
Please note
that some of the above funds try to outperform the index they are tied to by
the percentage stated. While this can enhance your returns, it can certainly
accelerate your losses as well. No matter which way you choose, be sure to work
with a trailing sell stop (I suggest 10%) and be aware that volatility will be
your constant companion.
8. NEW SUBSCRIBER INFORMATION
To get a
head start on more successful investing, please click on:
In case you
missed it, you can download my latest e-book “How to beat the S&P 500…with
the S&P 500,” here. If you are
investing your 401k and must use mutual funds, I suggest you primarily stick
with the S&P 500 as described in my book. Of course, you can always use the
above tables to find sector or country ETFs to your liking and use the
equivalent mutual funds as offered by your custodian.
Disclosure:
I
am obliged to inform you that I, as well as my advisory clients, own some of
the ETFs listed in the above table. Furthermore, they do not represent a
specific investment recommendation for you, they merely show which ETFs from
the universe I track are falling within the guidelines specified.
The adage that “sometimes nothing happens in a decade
and sometimes a decade happens in a week” sure rang true, as the coronavirus
induced sell fest continued with utter abandon with downward momentum accelerating.
As I posted yesterday, my planned limited liquidation of broadly
diversified domestic ETFs turned into a “Sell All” early in the session, as the
major indexes continued with their best imitation of a swan dive. Besides some
hedged holdings and gold, we are now in cash watching this debacle unfold from
the sidelines.
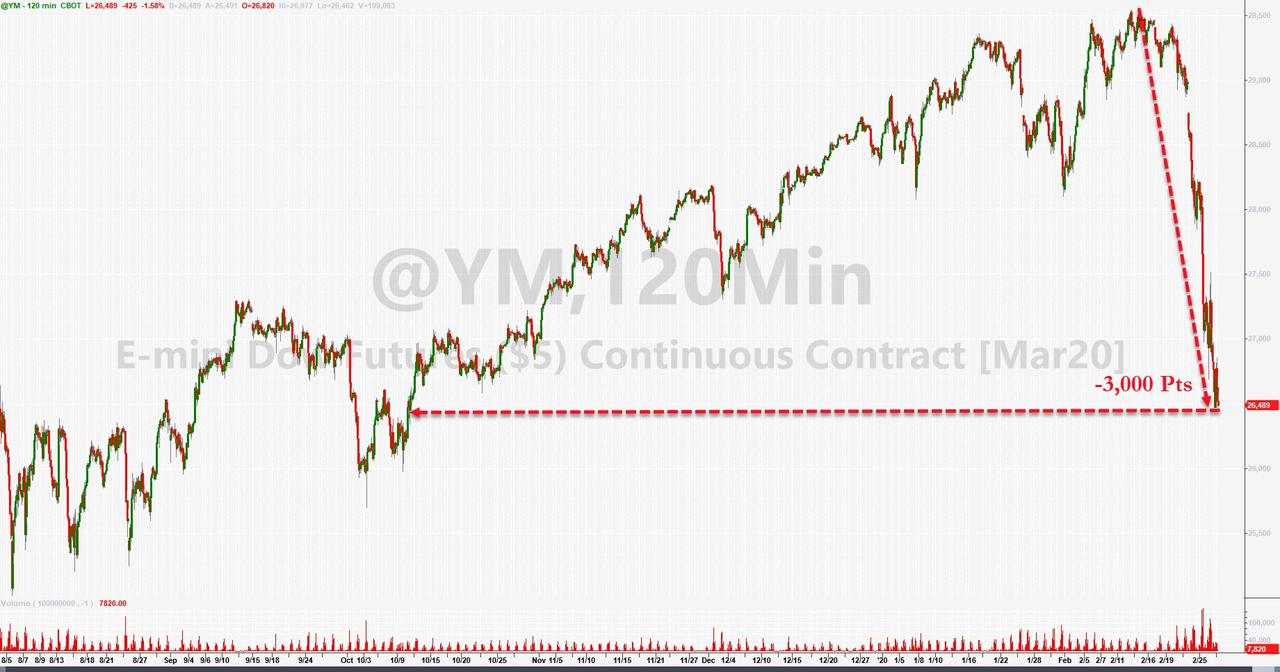
As ZH elaborated, in the space of just six days, we went
from a record high to a correction with the Dow
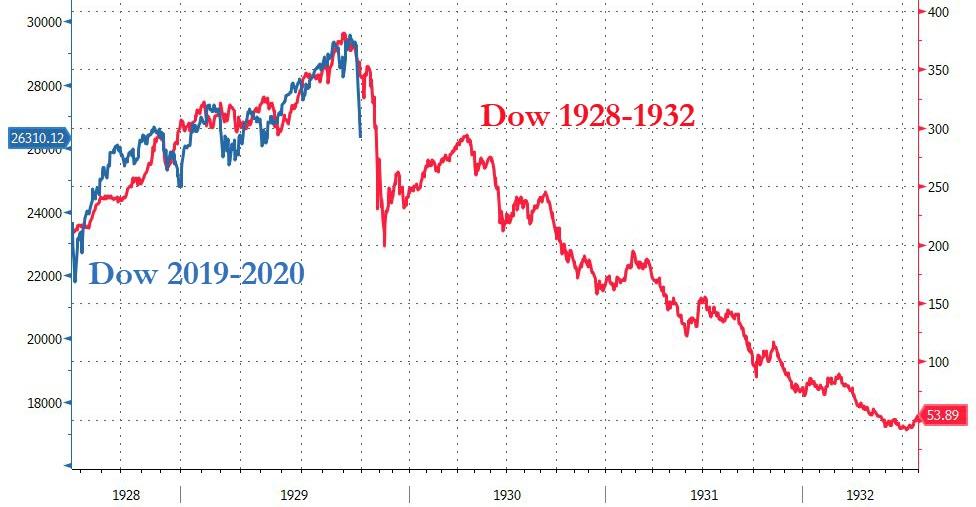
down over 3,000 points or -10.5%). At the same, the eerily familiar comparisons
to the events of 1928-1932 are making the rounds, with this
chart providing the comparison to current market activity.
Then this:
The market is already pricing in at least 3
rate-cuts in 2020 and the odds of March cut are soaring, despite the obvious
fact that The Fed can’t print vaccines to ‘salve’ the supply-chain block and if
lower rates are supposed to spark more consumption, where are you going to
consume? Not at crowded public places like theaters, restaurants, and sports
stadiums?
It’s seems to become more well known that global economies
are facing an unexpected and unprecedented supply chain shock that can’t be fixed
quickly and will leave the Central Banks somewhat powerless, although I expect
the liquidity spigots to be wide open soon.
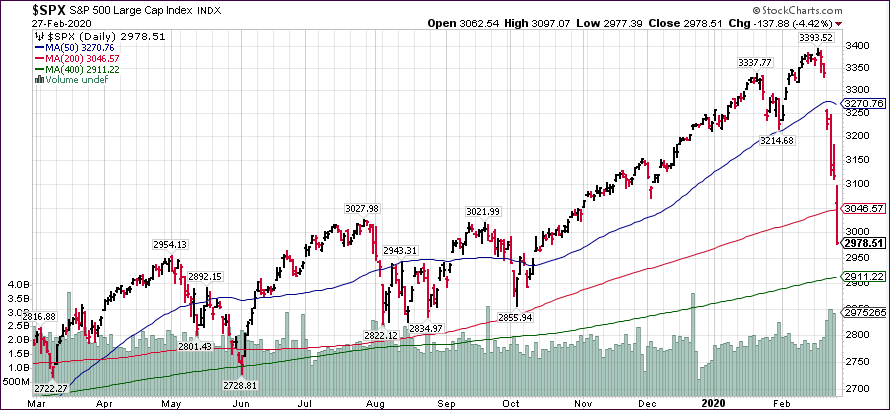
To add insult to injury was the fact that the widely
followed S&P 500 “lost” it’s 200-day moving average, as this chart
shows. This means that downward momentum could worsen and deepen this newly formed
bear market.
It’s good to be on the sidelines for the time being.
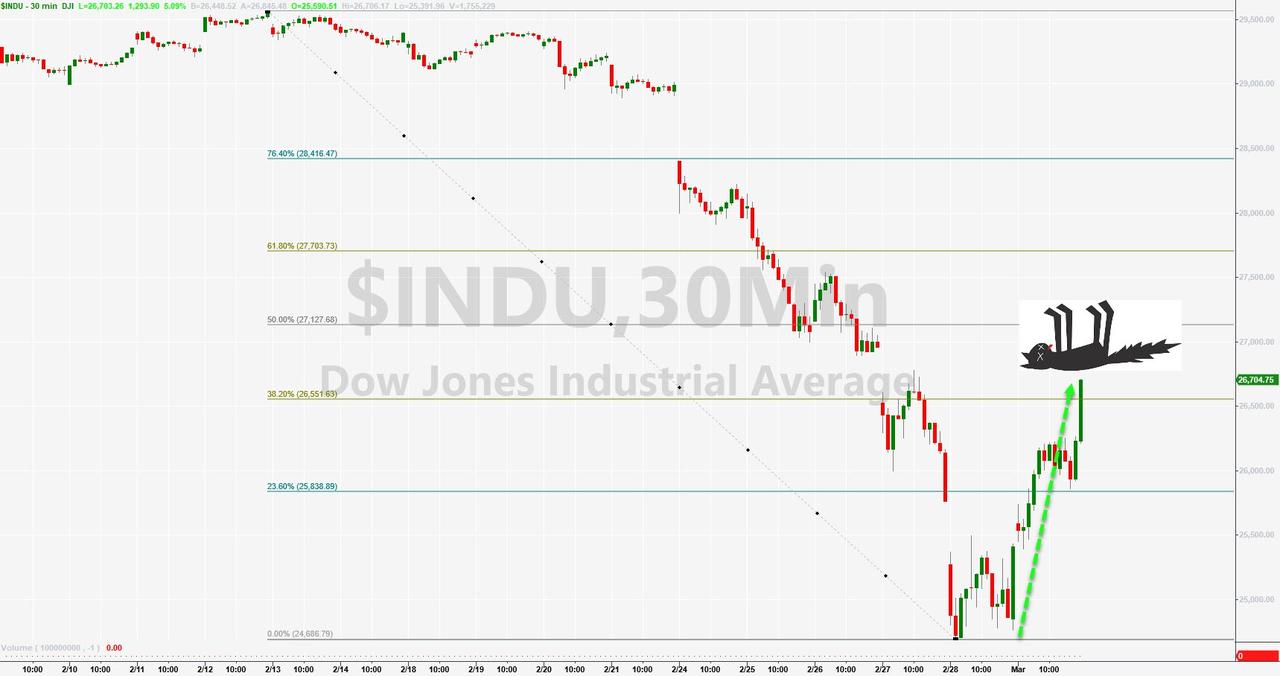
The sudden turnaround in then markets kept me from liquidating
those holdings that had come close to their trailing sell stops. It’s a known
fact that sharp market drops can be followed by violent rebounds, which we saw
early in the session. The only problem was that this move had the smell of a
dead-cat bounce, which is exactly how it turned out.
Still, it was some relief from the selling stampede of the
past few days, but it does not mean the economic effects of the coronavirus have
been nullified. Far from it, as the confirmed cases of infections and deaths outside
of China have continued to spread, there will be a financial hangover for some
time to come.
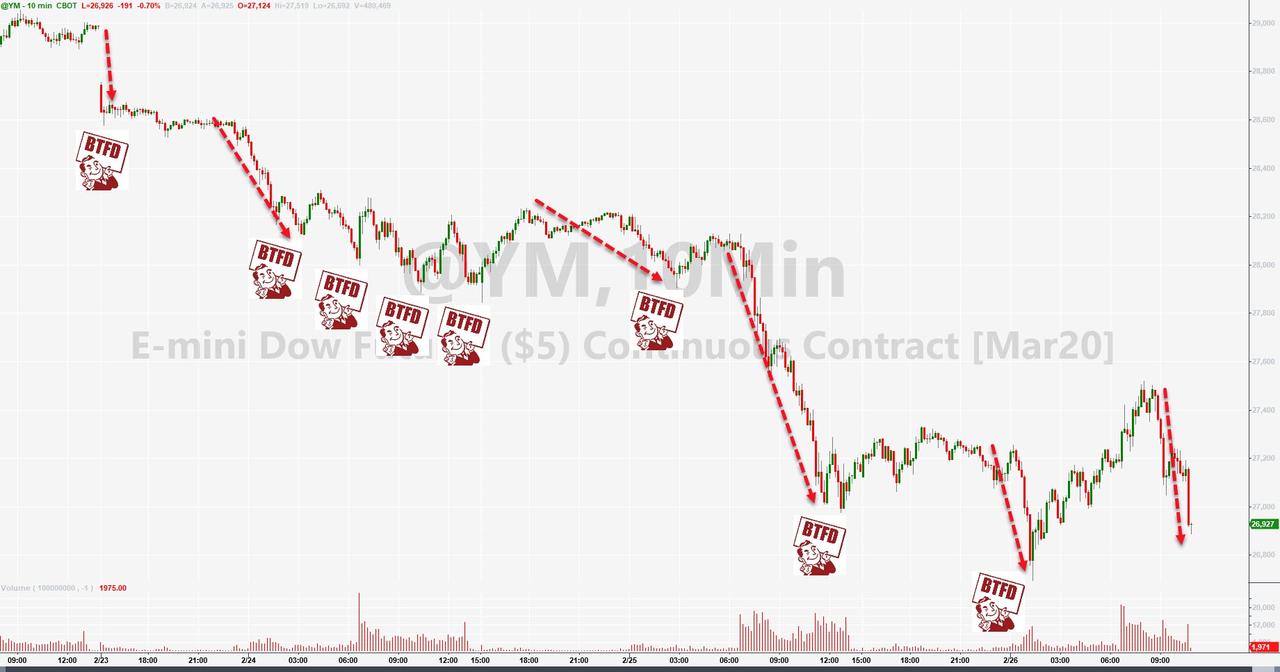
Those investors that got motivated by buying the dips
over the past few days were, with the benefit of hindsight, much too early and disappointed,
as the dip-buy fest did not turn out well so far. To me, it’s doubtful that a
V-shape type of recovery is possible soon.
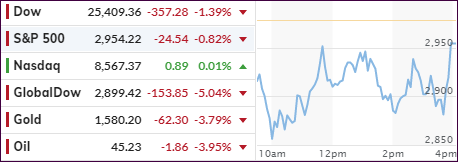
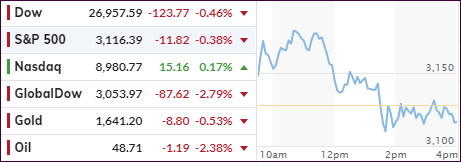
In the end, it was only the Nasdaq which managed a green
close with the other 2 major indexes slipping slightly in the red, which was somewhat
disheartening given the early race out of the blocks.
As a result of today’s action, our main directional
indicator, the Domestic Trend Tracking Index (TTI), dropped below its long-term
trend line into bearish territory, although by only a modest -0.62%. That means
that the odds of a bear market facing us have grown considerably.
Since this is the TTIs first dip “below the line,” I will
start reducing our domestic equity exposure and will issue an all-out “Sell”
signal, once the TTI shows some staying power in bear territory.
Again, I will hold off with any corrective measures, should
the major indexes again be in rally mode during tomorrow’s session. However, if
downward momentum accelerates, I will adjust my liquidations accordingly.
