ETF Tracker Newsletter For August 9, 2019

Ulli ETF Tracker Contact

ETF Tracker StatSheet          

You can view the latest version here.

DIVING INTO THE WEEKEND—AND RECOVERING

[Chart courtesy of MarketWatch.com]
  1. Moving the markets

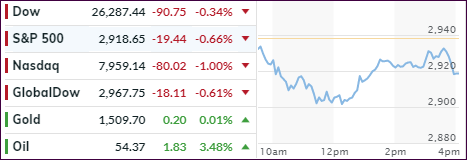
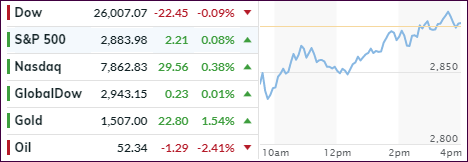
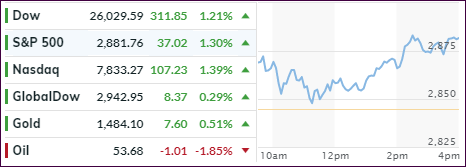
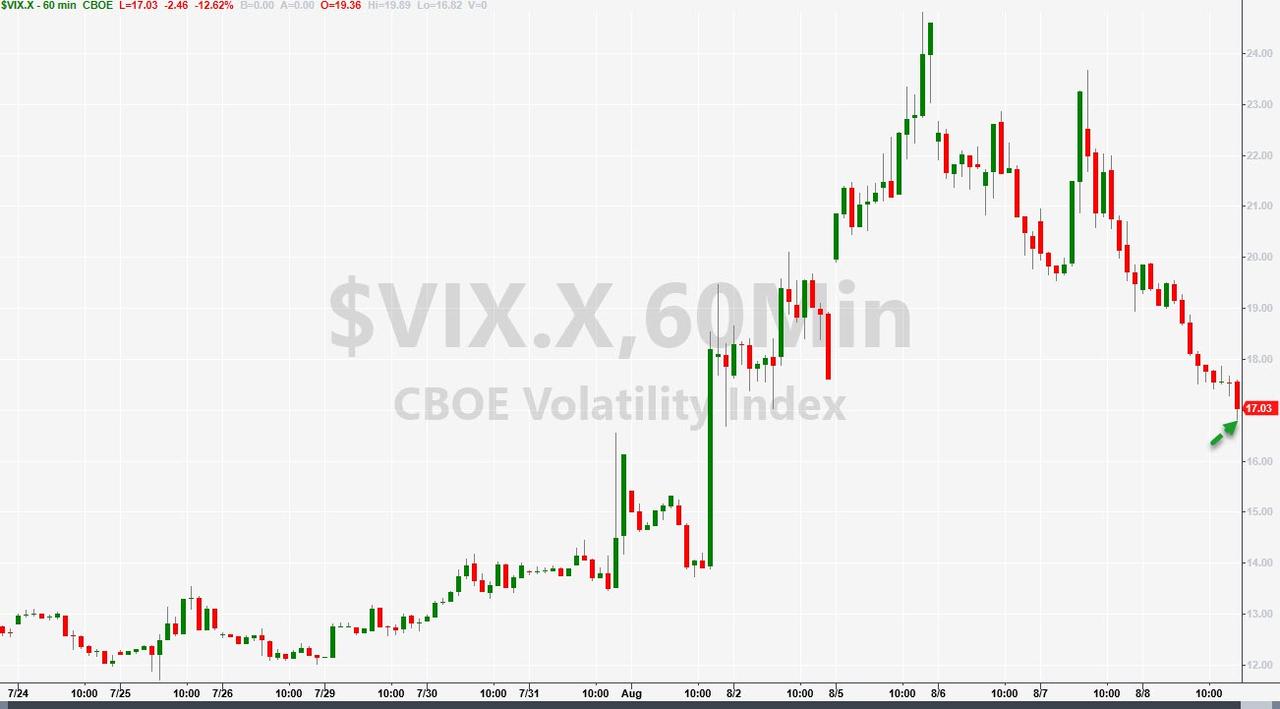
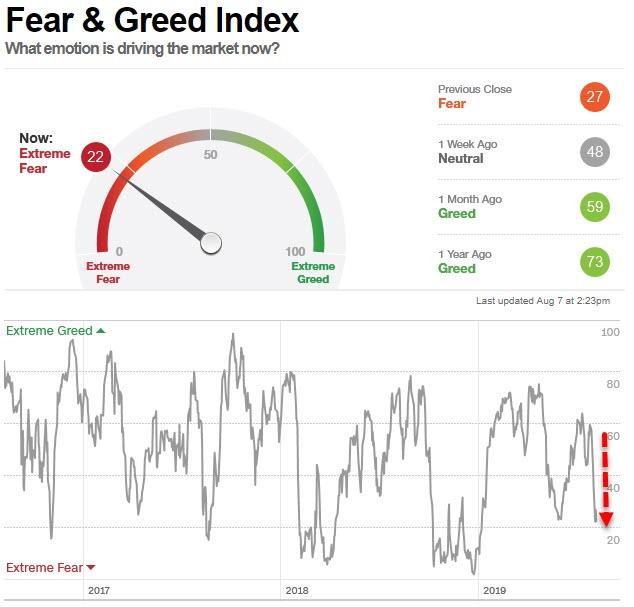
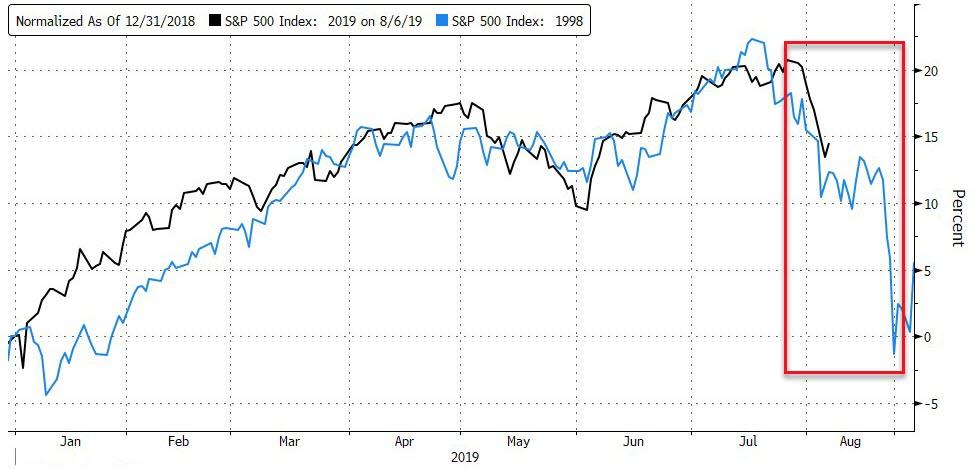
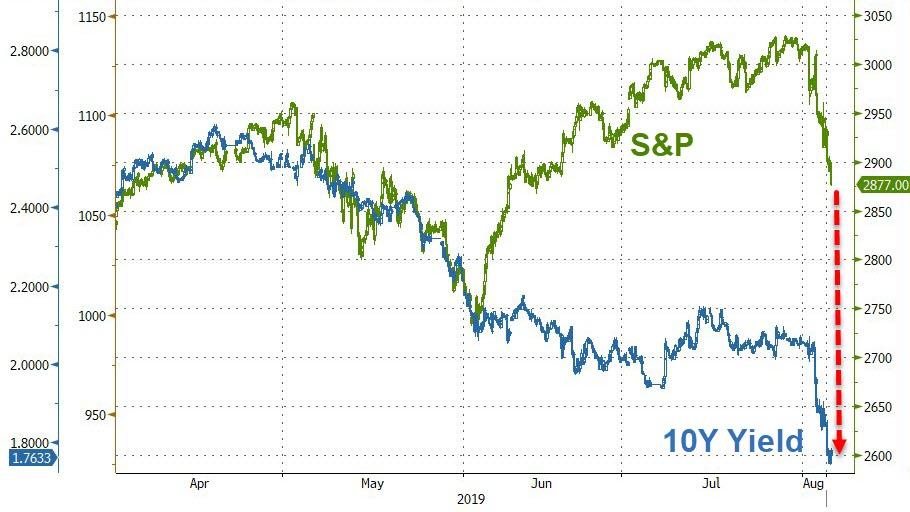
It ended up being a mixed Friday, as the major indexes did an early swan dive but, despite recovering some of the losses, they still closed in the red. It was a wild week, which could have ended up far worse, but as it turned out, the S&P 500 only surrendered -0.66% with the other 2 major indexes sporting similar numbers.

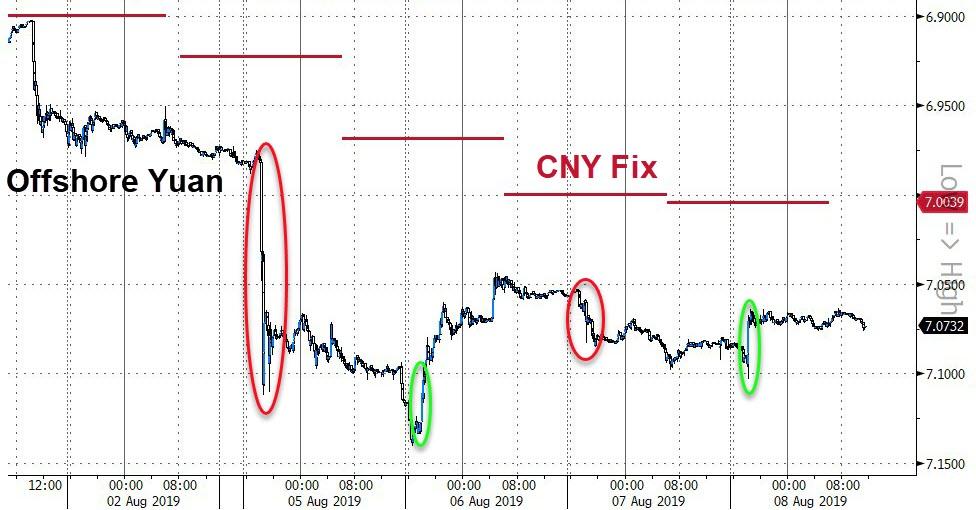
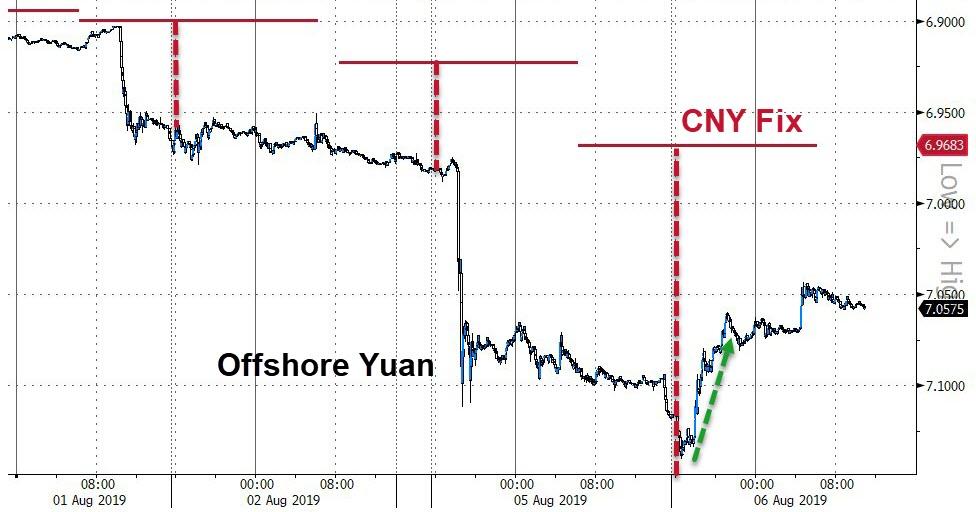
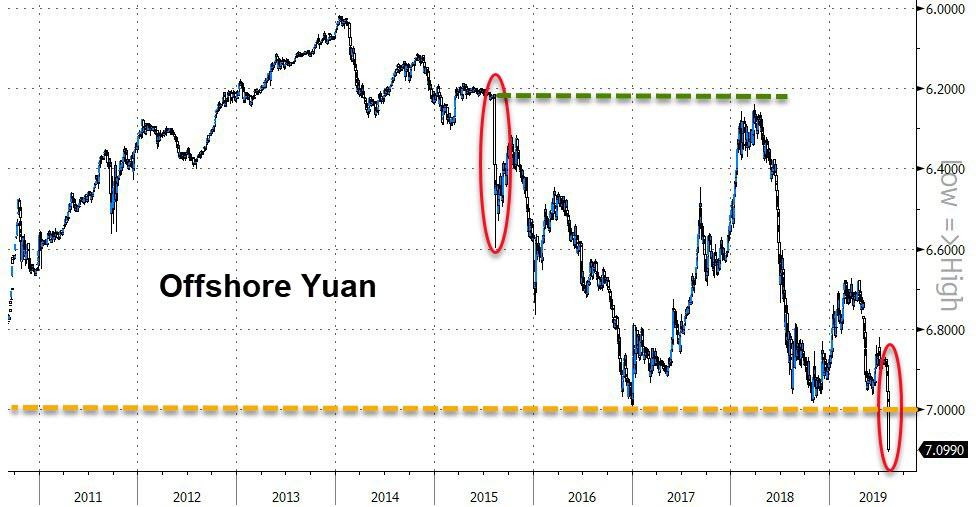
Starting the session to the downside were remarks from Trump suggesting that a resolution with China was not forthcoming. He added that “things are doing very well with China,” but that “he’s not ready to make a deal.” Throwing more fuel on the fire were his remarks that next month’s talks might be cancelled.

Equities reacted very negatively, which prompted the While House to backpedal earlier remarks regarding Huawei that “we’re not doing business with Huawei.” The clarification came that “the President was referring to ONLY ban Federal Departments buying from Huawei,” and not public corporations.

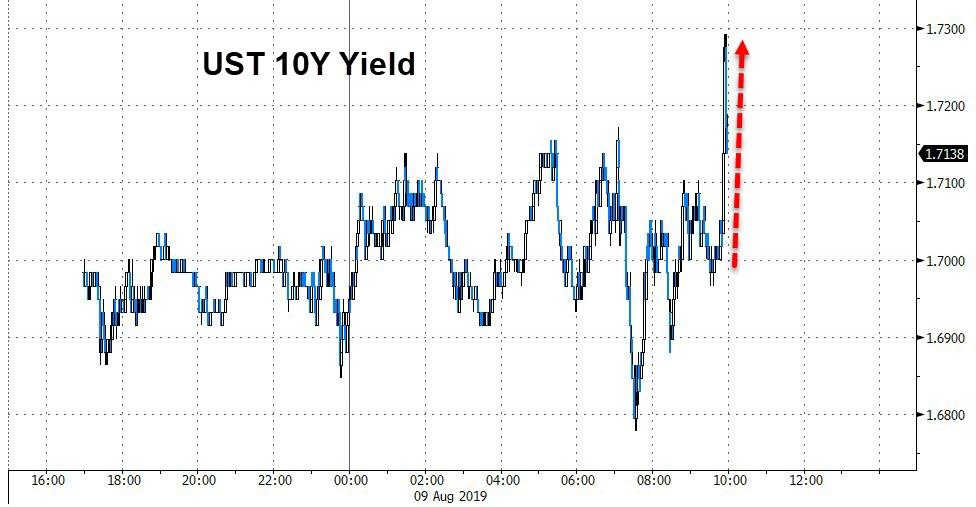
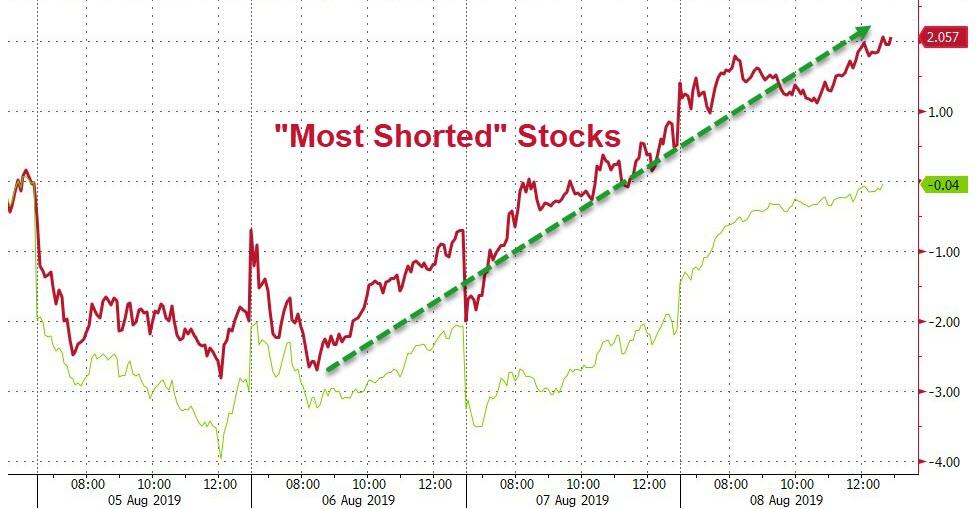
The markets did an about face and quickly headed north with bond yields following suit. In the end, this provided enough ammunition to drive the major indexes back towards the unchanged line thereby averting what appeared to be an accelerating plunge in the making early on.

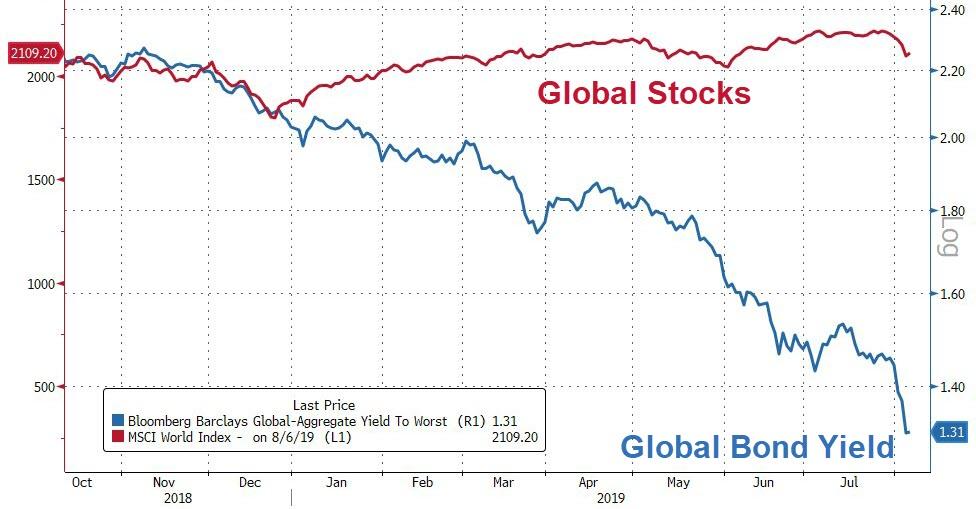
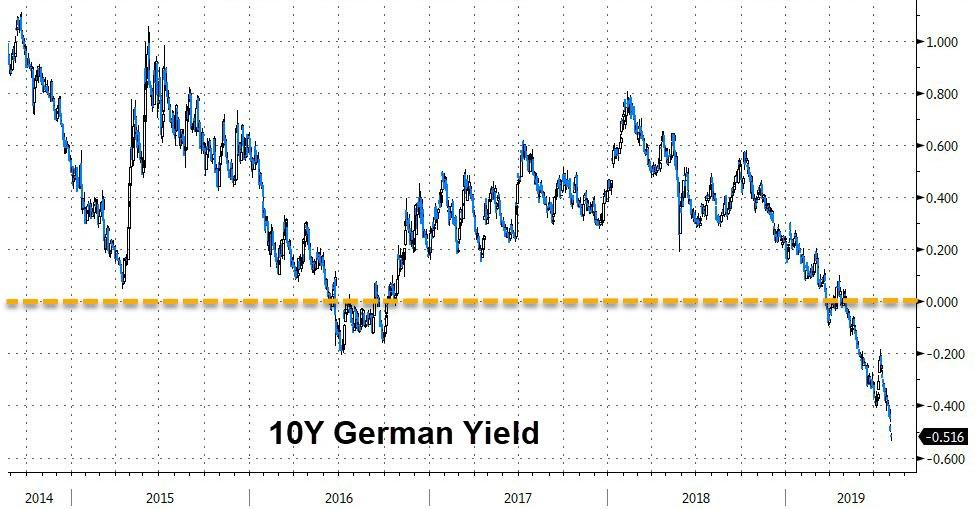
“Scrambling back” was the theme of the week, as volatility surged, giving an assist, at least temporarily, to the bearish crowd. The only bright and shining light all week was gold, which we added to our holdings, and which surged over 4% to conquer the $1,500 level—and having its best week in over 3 years.

We’ll find out next week, if there are more bearish surprises in store for us.

Read More

Weekly StatSheet For The ETF Tracker Newsletter – Updated Through 08/08/2019

Ulli ETF StatSheet Contact

ETF Data updated through Thursday, August 8, 2019

Methodology/Use of this StatSheet:

1. From the universe of over 1,800 ETFs, I have selected only those with a trading volume of over $5 million per day (HV ETFs), so that liquidity and a small bid/ask spread are assured.

2. Trend Tracking Indexes (TTIs)

Buy or Sell decisions for Domestic and International ETFs (section 1 and 2), are made based on the respective TTI and its position either above or below its long-term M/A (Moving Average). A crossing of the trend line from below accompanied by some staying power above constitutes a “Buy” signal. Conversely, a clear break below the line constitutes a “Sell” signal. Additionally, I use a 7.5% trailing stop loss on all positions in these categories to control downside risk.

3. All other investment arenas do not have a TTI and should be traded based on  the position of the individual ETF relative to its own respective trend line (%M/A). That’s why those signals are referred to as a “Selective Buy.” In other words, if an ETF crosses its own trendline to the upside, a “Buy” signal is generated. Since these areas tend to be more volatile, I recommend a wider trailing sell stop of 7.5% -10% depending on your risk tolerance.

If you are unfamiliar with some of the terminology, please see Glossary of Terms and new subscriber information in section 9.     

1. DOMESTIC EQUITY ETFs: BUY — since 02/13/2019

Click on chart to enlarge

Our main directional indicator, the Domestic Trend Tracking Index (TTI-green line in the above chart) is now positioned above its long-term trend line (red) by +4.30% after having generated a new Domestic “Buy” signal effective 2/13/19 as posted.

Read More

Buybacks And A Short-Squeeze Drive The Rebound

Ulli Market Commentary Contact

[Chart courtesy of MarketWatch.com]
  1. Moving the markets

Two forces combined to pull the markets out of the doldrums after Monday’s drubbing. For one, we saw corporate buybacks pick up speed, and two, a giant short-squeeze, now its third day, threw an assist to push the S&P 500 slightly above last Friday’s close. Both, the Nasdaq and S&P are back in the black for the week.

Setting the stage early on, was China’s Yuan, the peg of which is still set at the weakest level since 2008 but slightly higher than feared. That helped steady markets worldwide, as global growth fears subsided a tad and allowed the Global Dow to finally show a gain after the recent spanking.

While the markets seem to have stabilized for the time being, traders are still uneasy, as it would not take much to turn this trend around and retest Monday’s lows. Soothing the mood on Wall Street, however, was the volatility index (VIX), which dropped back from its recent highs to settle at a not so nerve-wrecking 16 level.

In the end, for us trend followers, no damage was done, and the major trend direction remains bullish, keeping us on board until that fact materially changes.

Read More

An Early Dump Is Followed By A Late Pump

Ulli Market Commentary Contact

[Chart courtesy of MarketWatch.com]
  1. Moving the markets

The markets lucked out, as an early sharp sell-off found some footing, after which buyers stepped in to scoop up assets at lower prices with all losses being wiped out by the end of the session. Whether that was just a one-day outlier, or a resumption of the bullish trend, remains to be seen.

The Nasdaq led the major indexes, with the S&P barely moving into the green, while the Dow was left behind and remained a fraction in the red.

Bond yields took a sharp dive early on with the 10-year touching 1.62%, then recovering and ending up 1 point at 1.72%. Still, it appears the race to the bottom is on, meaning that yields eventually may end up in negative territory.

On a global scale, we know that some $14 trillion of bonds, or 25% of the market, are yielding negative rates already. At one point in the past, this was considered a short-term aberration but now has become an accepted (outside the US) common practice. This is simply insanity and will not end well.  

The recent surge in volatility can have a devastating effect on equities, which one portfolio manager summed up as follows:  

“An extended period of low volatility like we have seen in recent years significantly increases leverage and risk-seeking behavior,” he said in an interview.

“When volatility turns like it has, people often need to sell assets to meet margin calls. That’s what makes this so combustible.”

With the actions of the last week, investor sentiment has collapsed from “euphoric greed” just a month ago to “extreme fear,” as this chart shows (thanks to ZH).  

Even on a global basis, stocks and bonds remain decoupled by a huge margin. Knowing that bonds represent the “smart money” and stocks the “dumb money,” we can guess well how this will turn out.

It pays to have an exit strategy.

Read More

Solid Relief Rally Wipes Out A Chunk Of Yesterday’s Losses

Ulli Market Commentary Contact

[Chart courtesy of MarketWatch.com]
  1. Moving the markets

While the initial morning rebound faded mid-day, buyers stepped in subsequently and pushed the major indexes out of the doldrums and into a solid green close.

Helping matters was China stabilizing the problem child that caused yesterday’s panic selling, namely the Juan. The PBOC (China’s main bank) fixed the Juan at 6.9683 per dollar, which was marginally stronger than the 7.00 “red line in the sand.”

That reduced downside market pressures with traders finally being able to steady their nerves after the Dow’s 767-point plunge. The mood, however, remains fragile, as Wall Street participants are keenly aware that a stray headline or misunderstood presidential tweet could kick market turmoil back into high gear.

When looking at this updated chart demonstrating the similarities between the 2019 and 1998 S&P 500 performance, you have to admit that it is eerily similar. This is not to say that history will repeat itself but, so far, it seems to be a possibility.

Read More

China Retaliates—Global Markets Get Clobbered—Stocks Plunge Most In 2019

Ulli Market Commentary Contact

[Chart courtesy of MarketWatch.com]
  1. Moving the markets

The basic law of physics tells us that any ‘action’ is followed by an equal or greater ‘reaction.’ This became very clear today when, after Trump’s threat of additional tariffs last week, the Chinese retaliated by letting their currency, the Juan, float freely by removing the US dollar peg.

The Juan dropped to 10-year low causing equities around the word to freefall with the Dow being down at one point over 850 points. No one saw this coming, as analysts were of the opinion last week that trade tensions with China existed but that neither side was ready to escalate.

That was an incorrect assumption, as it now appears that the final nail was put in the trade coffin, unless one of the warring parties comes back to the negotiating table with major concessions. I don’t see that happen, at least not in the foreseeable future.

Trump took the opportunity to call out China and continued to push the Fed for lower rates with tweets like this:

China dropped the price of their currency to an almost a historic low. It’s called “currency manipulation.” Are you listening Federal Reserve? This is a major violation which will greatly weaken China over time!

What a difference a week can make, during which we went from ‘all is fine, new all-time highs and a goldilocks scenario’ to all hell breaking loose with the bears suddenly having outwitted the bulls.

The were no winners with the carnage affecting just about all areas of the globe. European equities were hammered by seeing their biggest 2-day drop in 3 years with the German DAX touching its technically important 200-day M/A. It’s 10-year bond crashed to new lows and now yields a sickening -0.53%.

Domestically, things did not look any better as SmallCaps and Transporations lost their 200-day M/As, while the S&P 500, Dow and Nasdaq dropped below their 100-day M/As.

The “jaws of death,” which I have repeatedly posted about, finally shows some closing, but the S&P 500 still has a substantial way to go in order to catch up with the 10-year yield, as this chart demonstrates.

Today’s action weakened our Trend Tracking Indexes (TTIs-section 3 below) considerably, with the International one sinking below its long-term trend line. Usually, a one-day event does not indicate a long-term trend change, so I will give it another couple of days before pulling the trigger and calling that “Buy” cycle to be over.

The Domestic one, remains on the bullish side of its respective trend line but, if there is more downside follow through from today’s bashing, we might end up heading for the safety of the sidelines soon.

Stay tuned.

Read More