

- Moving the markets
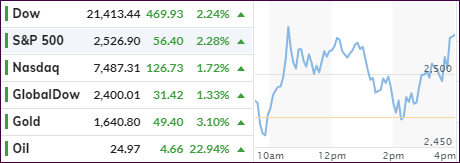
Signs of progress in the fight against the coronavirus in Europe and the U.S. kept yesterday’s rebound alive. Even though headlines were mixed, assumptions of a “plateauing” of the crisis prevailed on Wall Street, along with the idea that the markets are bottoming out.
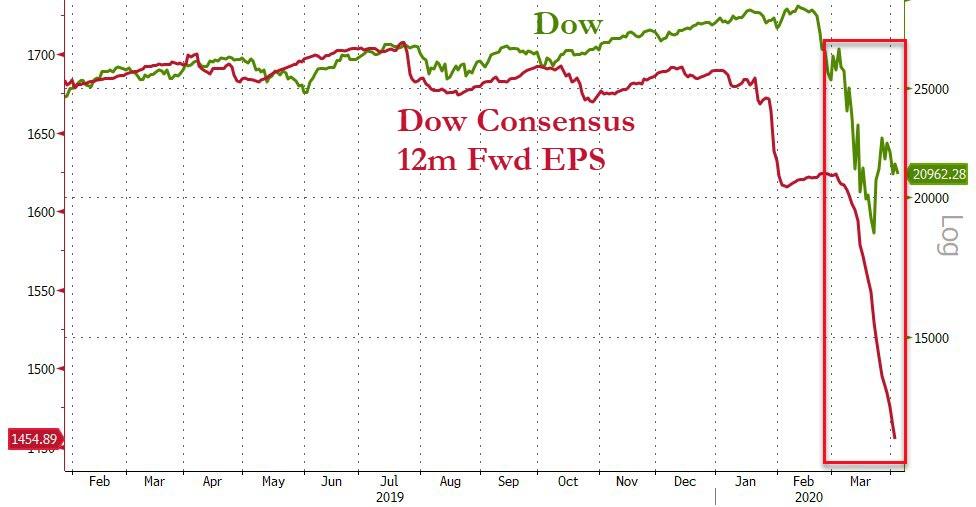
While that is a hopeful explanation, however, expectations that economies are going back to normal within a short period of time are simply not realistic and are based on the commonly held view that markets and economies are connected, yet there is a reality gap, as analyst Bill Blain explains:
What Markets know is that Global Central banks are going to do whatever it takes… to keep markets high… The reality gap between financial assets and the real word grows ever wider…
While powerhouse Nomura added this for color:
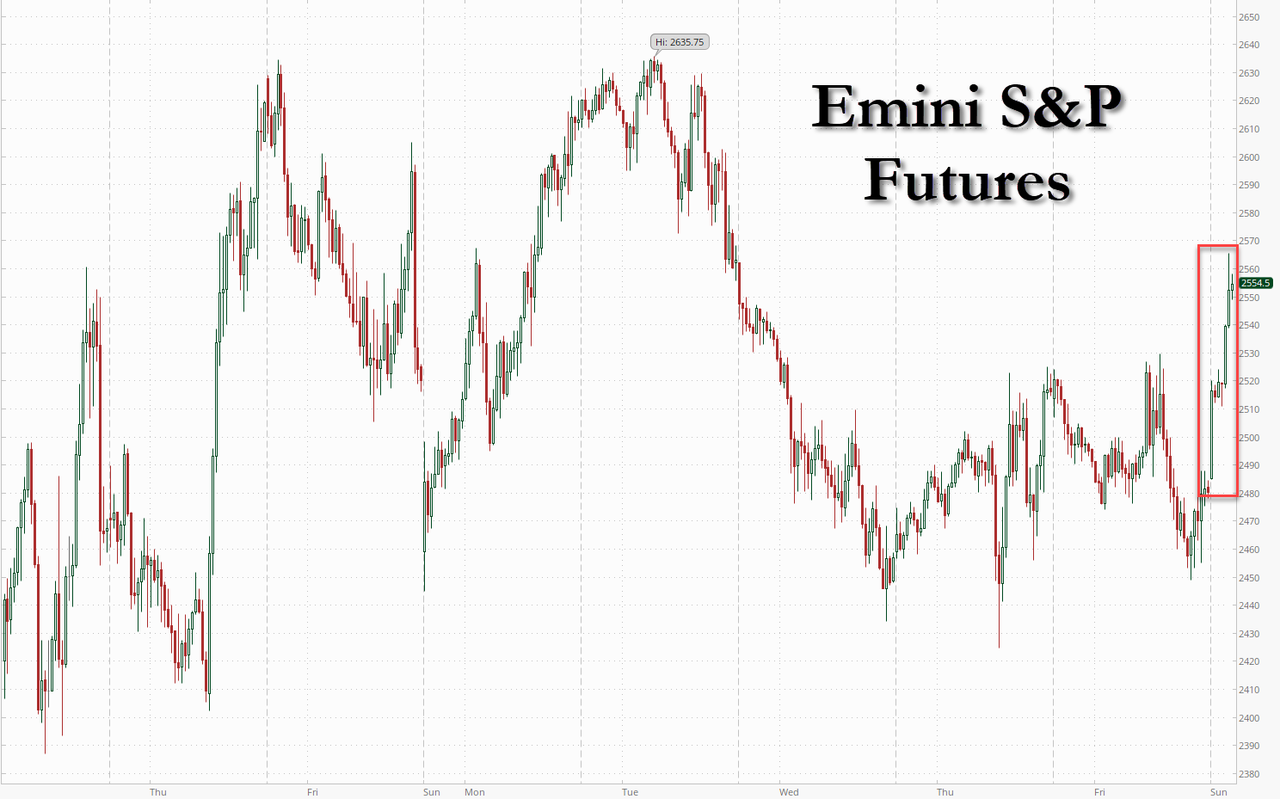
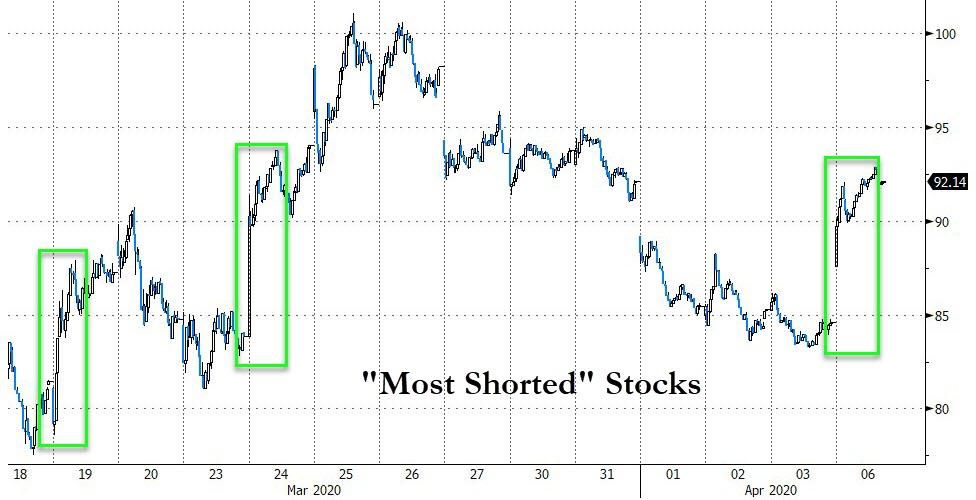
The steep rally in global equities is nothing more than a giant “bear squeeze” rally, driven by panicked exits from shorts that investors accumulated during the downturn…
I have been pounding on this Central Bank theme for a long time. This morning, in order to keep the markets from dropping, administration officials came out with some well-timed and appropriate jawboning with Kudlow and Mnuchin both insisting that Trump is looking to re-open the US economy “as quickly as possible.”
As Zero Hedge pointed out, Kudlow took things a step further by dismissing worries about another drop to new lows by saying the Fed is sitting pretty with what he called “the ultimate bazooka.”
In other words, the Fed will come and rescue markets at all costs, even if it means eventually buying junk bonds (they already are buying corporate debt ETFs) and stocks, just like happened in Japan.
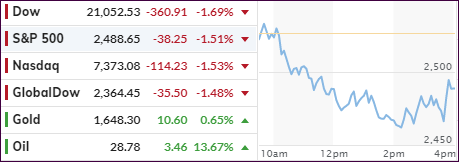
Despite all the above efforts, the markets ended up giving back an 800-point Dow rally and closed slightly in the red.
Did we just witness the end of another dead-cat-bounce?
Read More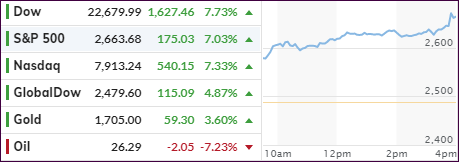