Crude Oil Dumps And Equities Pump

Ulli Market Commentary Contact

[Chart courtesy of MarketWatch.com]

  1. Moving the markets

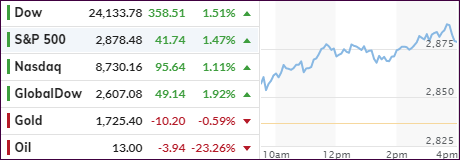
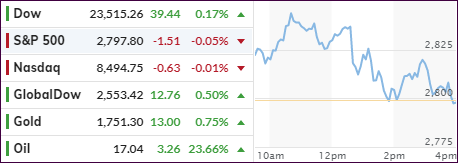
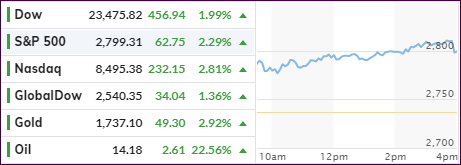
Despite weakness in the futures markets, the computer algos went to work this morning by pushing the major indexes to another green close with the S&P 500 gaining around +1.4%, while crude oil dumped -23%.

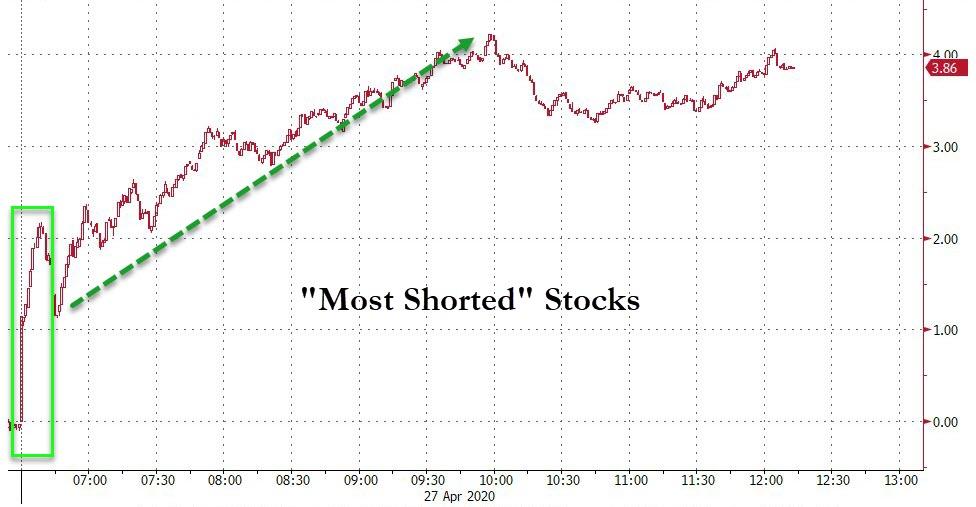
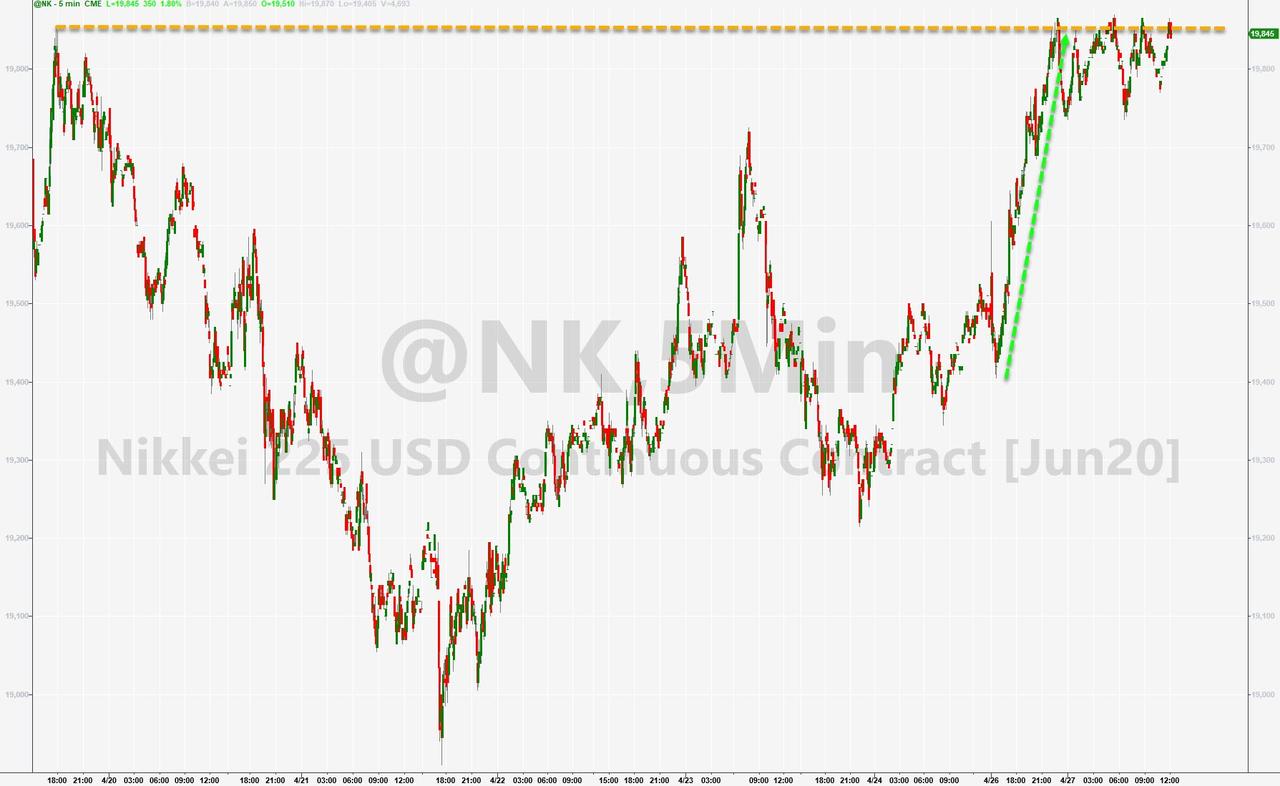
We saw two assists supporting equities.

One came from a giant short squeeze causing US stocks to surge, as Bloomberg’s chart shows. The other one, of a more global nature, came from BoJ’s promise to buy more assets, which pumped global markets, with especially the Nikkei being on fire.

This wiped out last week’s losses, as traders’ optimism about loosening restrictions took center stage, despite the usual warnings that such early moves could be premature and backfire.

The busiest week of the earnings season has started with negative news being widely expected, which is another reason why markets are in rally mode confirming once again that bad news can be good news. But for how long?

Guggenheim’s CIO Scott Minerd chimed in by saying:

“The central bank will never be able to get back to normal. The Fed’s balance sheet has expanded from $4.5 trillion to $6.6 trillion in just about a month, and it is likely on its way to over $9 trillion soon.”

With ZeroHedge concluding:

“And there you have it: the US is now (and has been for the past decade) just a more dignified form of USSR-style central planning, one where prices are set by decree and a decline in asset levels is prohibited for one simple reason: with financial assets over 6x global GDP, any crash in markets would result in a depression that would promptly spiral in social collapse.”

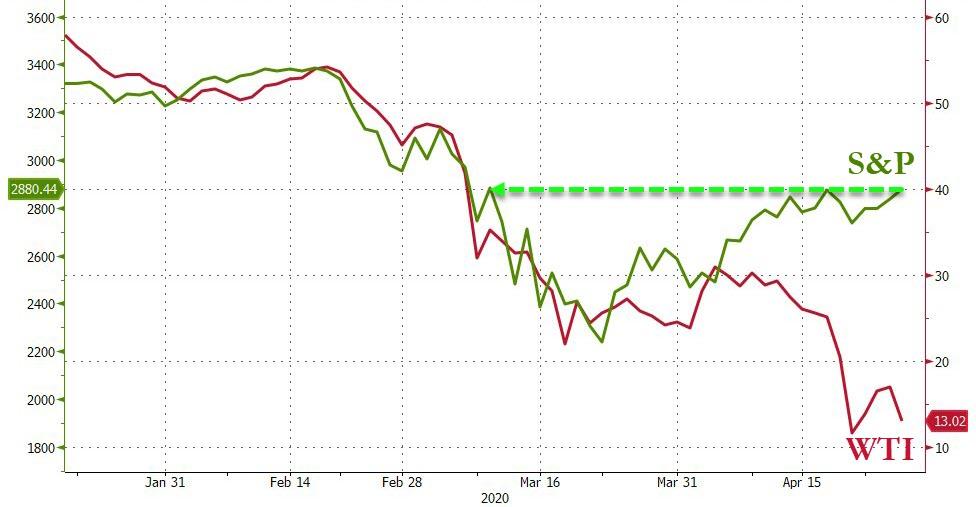
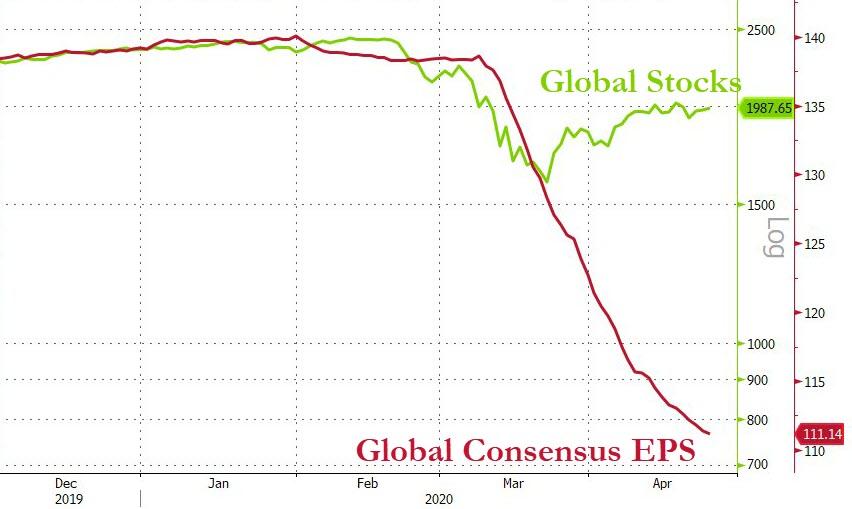
Words of wisdom indeed. In case you were wondering, this is exactly why markets are totally disconnected from any reality. Even the real economy, as demonstrated by crude oil, is disintegrating at the same time as earnings expectations are dumping, and not just in the US but globally as well.

This week is loaded with a variety of events, any of which could force the markets in either direction.   

Read More

ETFs On The Cutline – Updated Through 04/24/2020

Ulli ETFs on the Cutline Contact

Below, please find the latest High-Volume ETF Cutline report, which shows how far above or below their respective long-term trend lines (39-week SMA) my currently tracked ETFs are positioned.

This report covers the HV ETF Master List from Thursday’s StatSheet and includes 322 High Volume ETFs, defined as those with an average daily volume of more than $5 million, of which currently 66 (last week 66) are hovering in bullish territory. The yellow line separates those ETFs that are positioned above their trend line (%M/A) from those that have dropped below it.

Take a look:                                                                   

The HV ETF Master Cutline Report

In case you are not familiar with some of the terminology used in the reports, please read the Glossary of Terms. If you missed the original post about the Cutline approach, you can read it here.      

ETF Tracker Newsletter For April 24, 2020

Ulli ETF Tracker Contact

ETF Tracker StatSheet          

You can view the latest version here.

UP FOR THE DAY—DOWN FOR THE WEEK

[Chart courtesy of MarketWatch.com]
  1. Moving the markets

Despite a late-day pump to wipe out some of this week’s losses, the major indexes managed a green close for the session but ended down for the week, with the S&P 500 surrendering a modest -1.3%.

Yes, bad economic news turned out to be good news for the markets. Even crashing Consumer Sentiment (the most terrible ever) and home buying conditions being he worst in 37 years, along with crumbling Durable Goods orders, could not stem the bullish theme and prevent a green close.

As I have noted ad nauseum, equity markets are in no way connected to economic realities, and today was no exception. The fact that global economic data also collapsed by the most on record this week, was of no concern to anyone. Even Monday’s oil debacle now only seems like a distant spot in the rear-view mirror.

However, gold rallied this week, and we added to our existing holdings in anticipation of continued reckless money creation by the Fed, with the eventual destruction of the dollar and a jump in inflation being a logical consequence—over time.

Next week will be a big one with an upcoming Fed meeting, a look at post-shutdown economic growth numbers, and earnings from over 20% of the S&P 500 companies. And, traders will be observing the progress, or lack thereof, of the reopening of some states and the resulting pick up in business activity.

It promises to be another week of unknowns, but the Fed most certainly will attempt to calm the markets and instill some confidence.

Read More

Weekly StatSheet For The ETF Tracker Newsletter – Updated Through 04/23/2020

Ulli ETF StatSheet Contact

ETF Data updated through Thursday, April 23, 2020

Methodology/Use of this StatSheet:

1. From the universe of over 1,800 ETFs, I have selected only those with a trading volume of over $5 million per day (HV ETFs), so that liquidity and a small bid/ask spread are assured.

2. Trend Tracking Indexes (TTIs)

Buy or Sell decisions for Domestic and International ETFs (section 1 and 2), are made based on the respective TTI and its position either above or below its long-term M/A (Moving Average). A crossing of the trend line from below accompanied by some staying power above constitutes a “Buy” signal. Conversely, a clear break below the line constitutes a “Sell” signal. Additionally, I use a 7.5% trailing stop loss on all positions in these categories to control downside risk.

3. All other investment arenas do not have a TTI and should be traded based on  the position of the individual ETF relative to its own respective trend line (%M/A). That’s why those signals are referred to as a “Selective Buy.” In other words, if an ETF crosses its own trendline to the upside, a “Buy” signal is generated. Since these areas tend to be more volatile, I recommend a wider trailing sell stop of 7.5% -10% depending on your risk tolerance.

If you are unfamiliar with some of the terminology, please see Glossary of Terms and new subscriber information in section 9.     

1. DOMESTIC EQUITY ETFs: SELL — since 02/27/2020

Click on chart to enlarge

Our main directional indicator, the Domestic Trend Tracking Index (TTI-green line in the above chart) is now positioned below its long-term trend line (red) by -14.65% after having generated a new Domestic “Sell” signal effective 2/27/20 as posted.

Read More

Popping and Dropping

Ulli Market Commentary Contact

[Chart courtesy of MarketWatch.com]
  1. Moving the markets

Optimists got a slap in the face, as reports of the greatly hyped experimental coronavirus drug Remdesivir, by Gilead, delivered disappointing results in clinical trials. That was enough of a downer for the markets to buckle, and the early gains were slowly wiped out, despite attempts to revive the bullish theme.

Looking at the chart above, this must have been one of the slowest days in recent weeks, with the major indexes ending the day just about unchanged.

Not helping the mood were reports from Europe, as their much-anticipated summit turned out to be a total flop with no agreement on a recovery package reached, as four “frugal” EU countries opposed any grants.

Then we learned that the housing market is not doing well, although that comes as no surprise, as New Home Sales crashed by 15.4% MoM, the biggest drop since July 2013, as ZeroHedge noted. This was also the biggest decline for March—ever!

Another 4.427 million Americans filed for first time unemployment in the last week bringing the four-week claims total to 26.5 million jobs lost. If you look at the “initial” and “continuing” claims, as per Bloomberg, it shows the highest level of continuing claims ever.

That means, we have now exceeded the jobs created in the past 10 years by the number job losses in the last 5 weeks. Stunning! Yet, current market levels in no way reflect those facts but, at least for today, equities did not rally into the close.

Summing up the day using the Good, Bad and Ugly analogy was Zero Hedge:

  1. The Good – Stocks are up (all it took was a few trillion dollars)? Oil is up (all it took was threats of war)?
  2. The Bad – COVID cases are up, COVID deaths are up (and Gilead’s drug is a dud)…
  3. The Ugly – Over 26 million Americans have now filed for unemployment benefits in the last 5 weeks.

A three-way-standoff between ugly real economic data, ongoing global lockdowns, and the Fed’s “whatever it takes” asset lift-a-thon…

What’s next? Will more bad news be good news again?

Read More

Snapping A 2-Day Slide

Ulli Market Commentary Contact

Snapping A 2-Day Slide

[Chart courtesy of MarketWatch.com]
  1. Moving the markets

After a 2-day slide, the markets found some footing via temporary stabilization of the oil market, some better-than-expected earnings reports, and anticipation that Congress will produce another stimulus package, maybe this time without much bickering.

Getting things started, and preventing oil from slipping further, were announcements by the administration to shoot at Iranian gunboats should they interfere again with U.S. Navy operations in open waters.

A little saber rattling like this had the desired effect and put oil prices back on a northerly path, at least for the time being. However, troubles in that sector are sure to continue next month at the expiration of June futures.

In terms of market direction, plenty of opposing views exist with 2 big boys now engaged in a tug-of-war. On one side, we have JPM’s math whiz Marko Kolanovic, who is favoring new market highs by 2021, and that in the face of plunging earnings expectations of 30% or more. On the other side, we have billionaire investor Paul Singer, who noted that “our gut tells us that a 50% or deeper decline from the February top might be the ultimate path of global stock markets.

I tend to lean more towards Paul’s assessment with the recent rebound off the lows being reviewed by Citi’s Robert Buckland like this:

“All bear markets include false rallies, often associated with supportive monetary policy. But markets only find a sustainable base when there are signs that cheap money is feeding through into the real economy, rather than temporarily supporting asset prices.”

Most economic numbers are so bad that I don’t need to regurgitate them, but I found it interesting, yet not surprising, that the US Consumer Comfort signaled an environment that clearly demonstrates an obvious divergence from Wall Street to Main Street.

Read More