Traders felt a little more at ease this morning, as the GameStop trading slugfest continued to reverse course, at least for the time being. This formed the base for an enthusiastic pop in the markets with the Dow sporting a 600-point gain during the session.
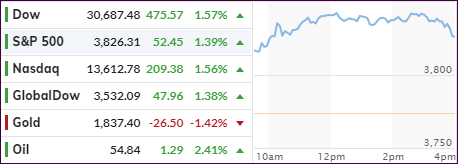
While the ramp lost some momentum into the close, the major indexes nevertheless ended solidly in the green with all three showing similar performances. It came as no surprise that SmallCaps (IWO) again displayed superior gains of +1.92%, but today that sector was bested by MidCaps (IWP) with +2.07%, thereby leaving the Nasdaq (QQQ) in 3rd place with +1.63%.
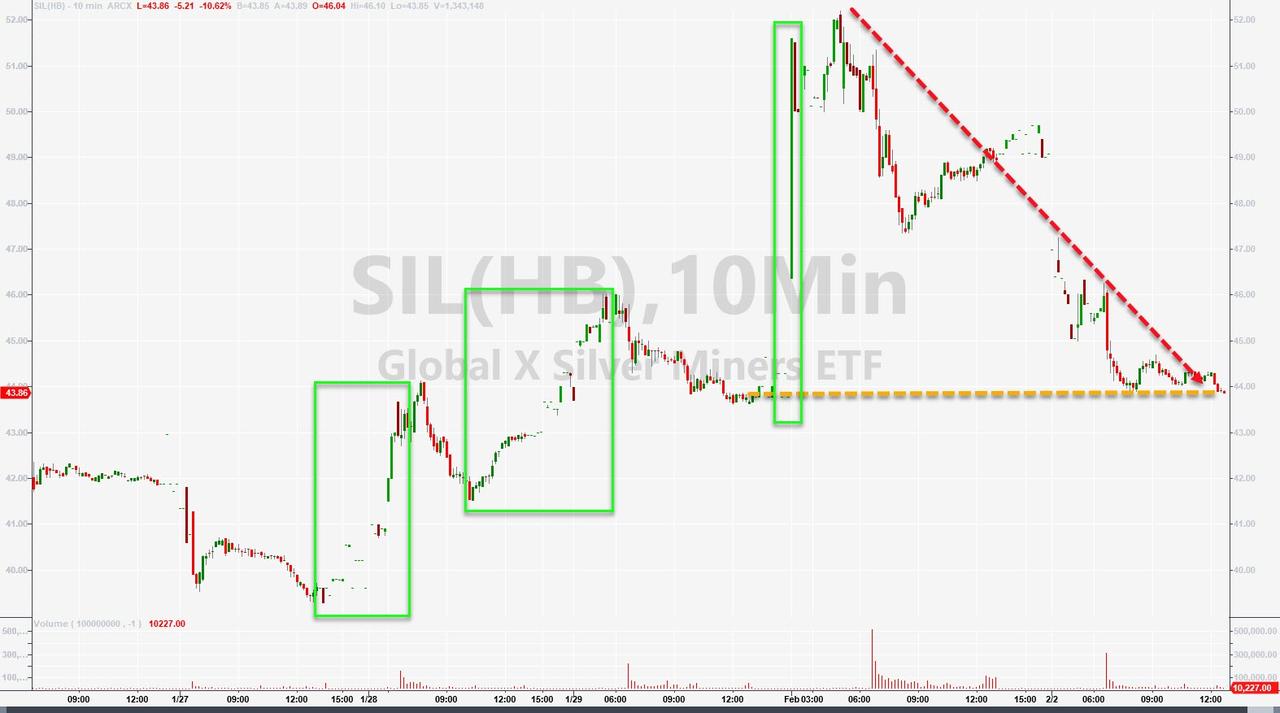
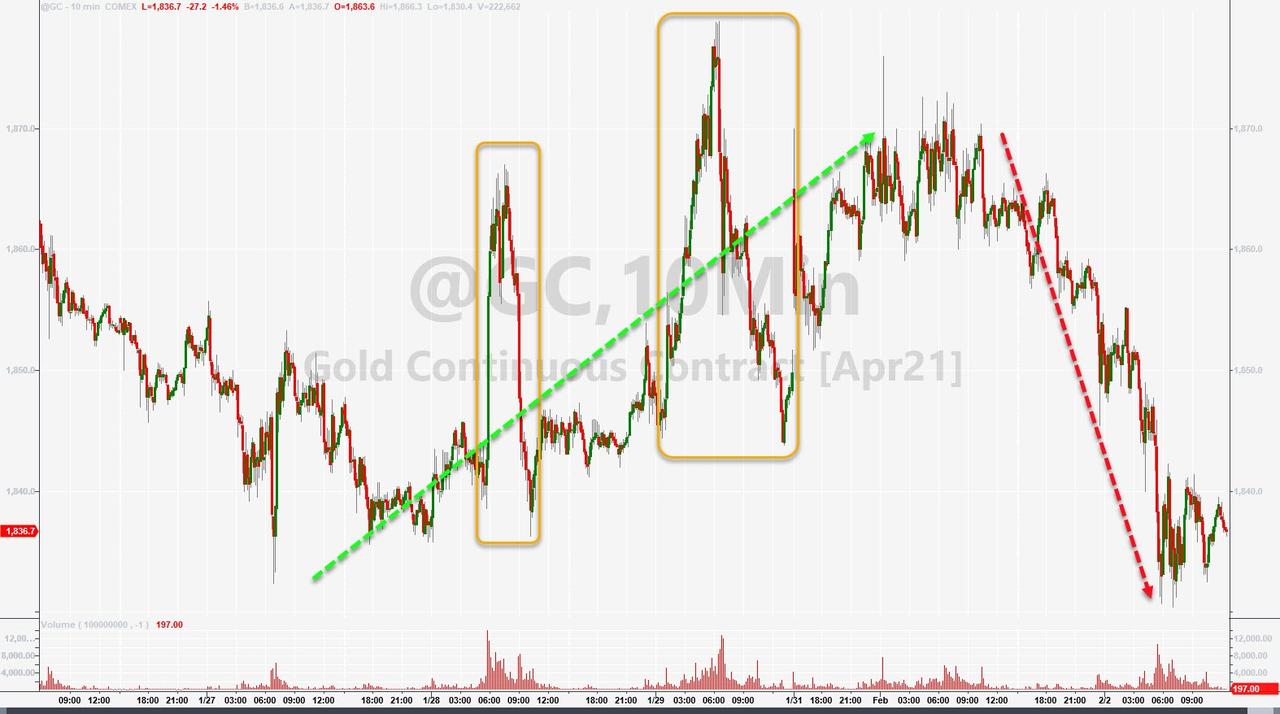
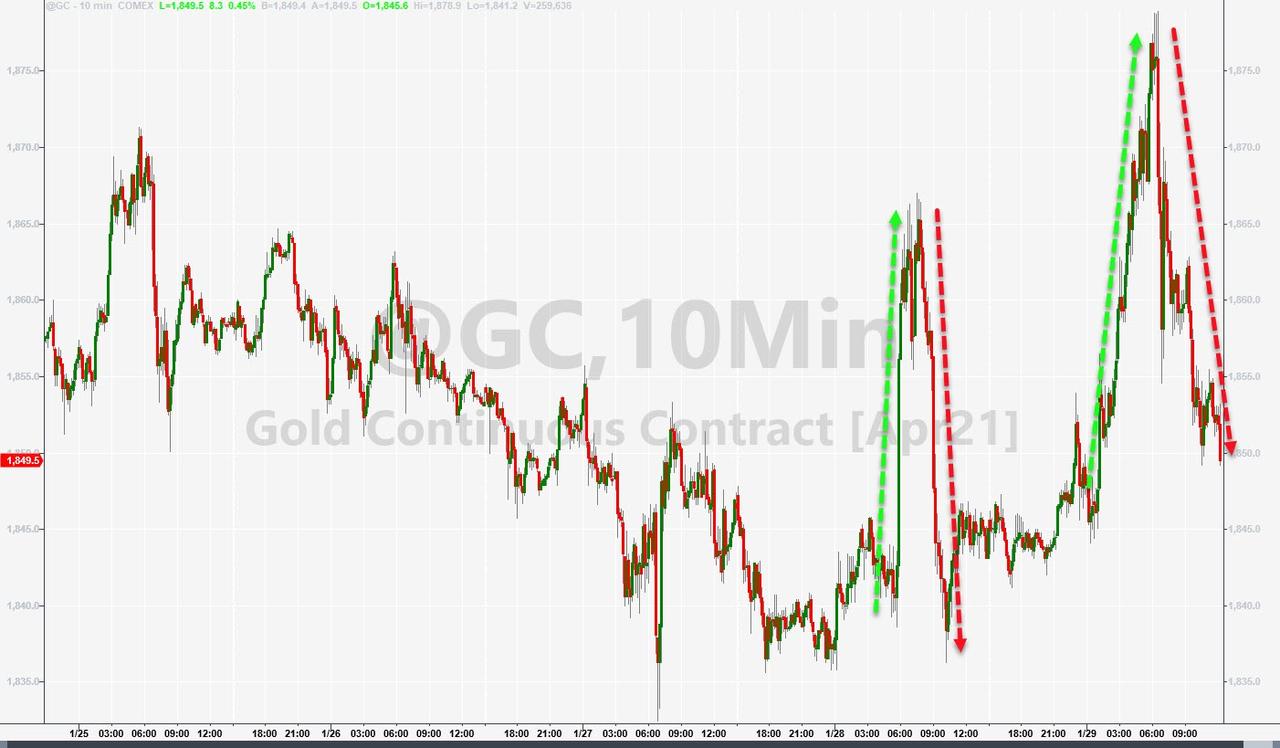
The precious metals were punished today with especially Silver taking the brunt of the beating, while Gold tumbled again below its $1,850 level. I think the silver spike is far from being over, but right now it appears to be battle between the shorts and the increasing demand for physical. Most bullion dealers on the internet are out of inventory.
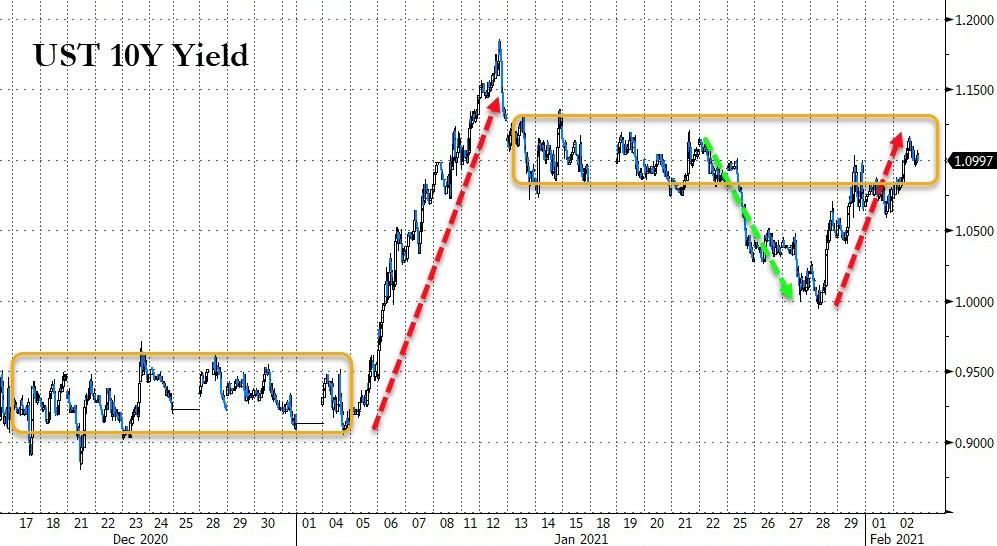
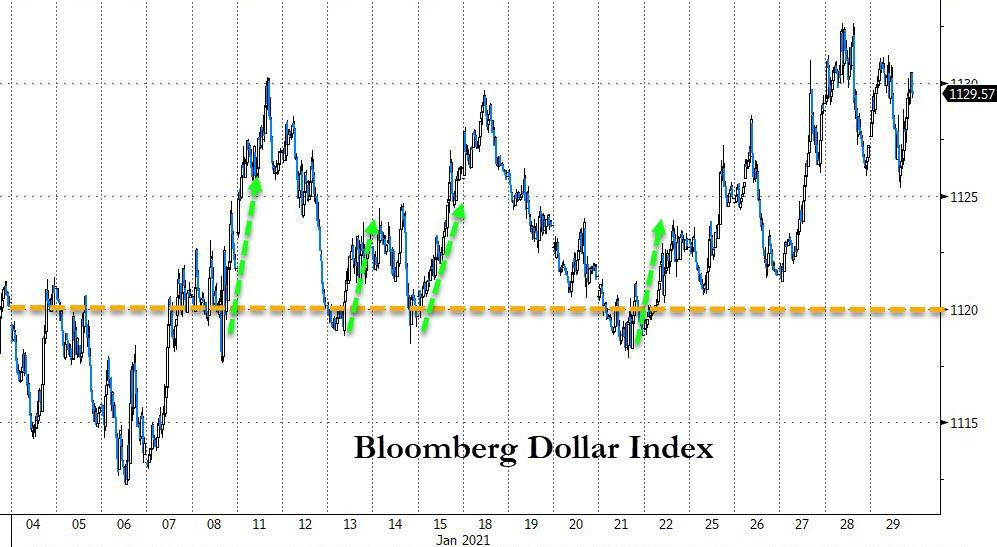
Not helping the metals were increasing bond yields with the 10-year rebounding from yesterday’s drubbing, as well as a rising US Dollar.
On deck this afternoon are earnings reports from Alphabet and Amazon, which certainly could influence tomorrow’s market direction.
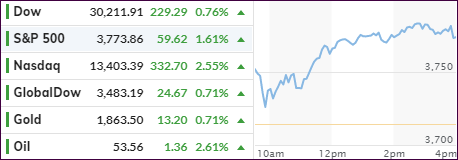
After stumbling during the last week of January, and a weak overnight session in the futures markets, the major indexes shook off whatever ailed them and opened solidly to the upside. An early dip towards the unchanged line was quickly recovered, and up we went during the remainder of the session.
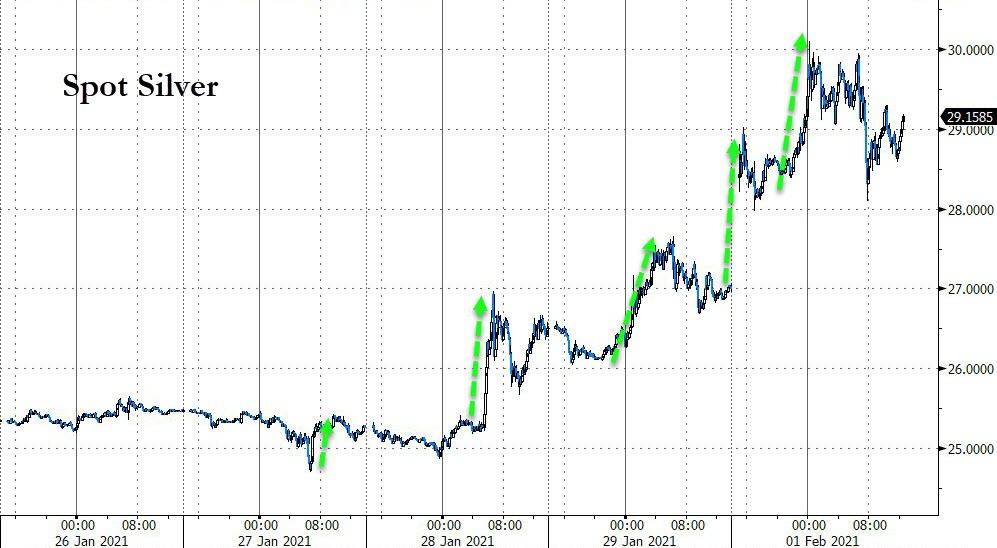
Taking the lead in today’s levitation were SmallCaps (IWO), which rocketed ahead +2.72% with the Nasdaq in close pursuit via an impressive gain of +2.55%. Even GLD finally managed to hang on to most of its early gains, very likely a rollover result of the short-squeeze stampede into silver, which catapulted higher by some 11%, over $30, before surrendering some its gains.
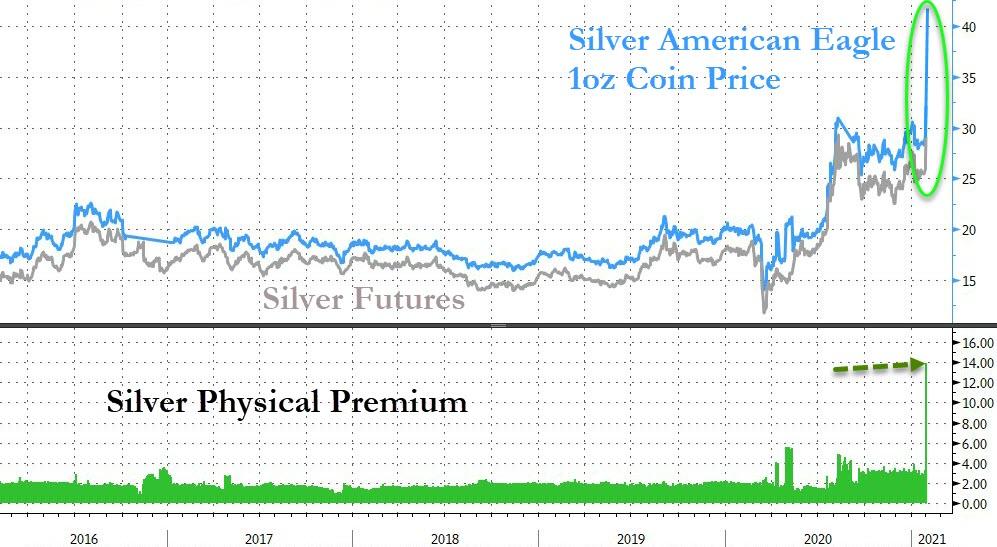
But some damage was done as the silver futures diverged heavily from the American Eagle 1 oz coin price, showing a $14 premium, as Bloomberg demonstrates in this chart.
Things were quiet in the markets as Wall Street traders tried to shake off last week’s retail trading short squeeze apocalypse featuring predominantly the GameStop stock. Word had it over the weekend that the Reddit Forum WallStreetBets would now attempt a repeat of the squeeze—but in the silver markets. They appeared to have done so, but details of its impact are still sketchy.
CNBC summed it up like this:
Many on Wall Street were spooked by a frenzy of activity among retail traders in heavily shorted stocks including GameStop and AMC Entertainment, which caused hedge funds to take off risk across the board even if they weren’t directly involved in the trade. Goldman Sachs said that the short squeeze triggered by the buying spree is the most extreme in 25 years. However, some strategists believe it’s unlikely that the impact will ripple through Wall Street and derail the new bull market.
Earnings season will kick into full gear this week with names like Alphabet, Amazon, Alibaba, Exxon, and other heavyweights on deck.
Below, please find the latest High-Volume ETF Cutline report, which shows how far above or below their respective long-term trend lines (39-week SMA) my currently tracked ETFs are positioned.
This report covers the HV ETF Master List from Thursday’s StatSheet and includes 312 High Volume ETFs, defined as those with an average daily volume of more than $5 million, of which currently 268 (last week 269) are hovering in bullish territory. The yellow line separates those ETFs that are positioned above their trend line (%M/A) from those that have dropped below it.
In case you are not familiar with some of the terminology used in the reports, please read the Glossary of Terms. If you missed the original post about the Cutline approach, you can read it here.
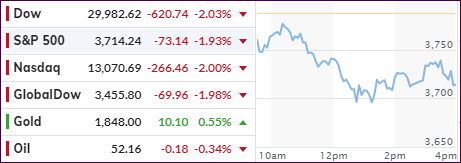
While the major indexes managed a green close yesterday, the Dow gave back about half of its early gains, but it could have been worse had it not been for the closing bell to “save” the markets from further declines.
And that is exactly what transpired, not only this morning but also during last night’s futures trading, namely that the rebound now appeared to have been a dead-cat-bounce with the sour mood continuing the entire session thus wiping out more than yesterday’s gains.
With options expiration lurking and the fallout from the GME short-squeeze debacle continuing, during which the once considered “untouchable” hedge funds’ short positions were squeezed to a degree never seen before, the battle raged on pushing up the stock another +67.9%. It is not known yet how many hedge funds had to be given a financial emergency enema, just to keep them alive.
It was the 6 million retail investors and their Robinhood accounts that unnerved the markets and made sure that the billionaire “hedgers” learned to use a little more discretion, by not shorting more than the entire market float, as they now have become intimately acquainted with the possible consequences of such actions.
As I pointed out 2 days ago, much of the selling in stocks and bonds was attributable to those hedge funds with outsized margin calls to sell everything they could to meet them—just to stay alive.
Added CNBC:
Shares of GameStop jumped 67.9% after Robinhood said it would allow limited buying of the stock and other heavily shorted names after restricting access the day before. Robinhood raised more than $1 billion from its existing investors overnight, in addition to tapping bank credit lines, to ensure it had the capital required to allow some trading again in volatile stocks like GameStop.
Investors are concerned that if GameStop continues to rise in such a volatile fashion, it may ripple through the financial markets, causing losses at brokers like Robinhood and forcing hedge funds who bet against the stock to sell other securities to raise cash.
For sure, fears have increased that this GameStop mania could be indicative of the market bubble I have talked about before, because none of the daily trading activities are a representation of the underlying economy, but merely a function of liquidity supported by the actions of the Fed. That may eventually contribute to more chaotic trading and possibly give the bearish crowd something to cheer about.
In the end, the markets scored their first losing month in four, with the Dow and S&P 500 dropping 2% and 1.1% respectively, but SmallCaps maintained their winning streak. The US Dollar scored its first monthly win since September, while Gold surged on various occasions, but every bounce was met with selling pressure, as ZH pointed out.
Yet, despite all this upheaval, panic and nervousness, the S&P 500 remains within 3.5% of its all-time highs. Go figure.
ETF Data updated through Thursday, January 28, 2021
Methodology/Use of this StatSheet:
1. From the universe of over 1,800 ETFs, I have selected only those with a trading volume of over $5 million per day (HV ETFs), so that liquidity and a small bid/ask spread are assured.
2. Trend Tracking Indexes (TTIs)
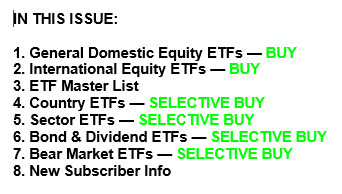
Buy or Sell decisions for Domestic and International ETFs (section 1 and 2), are made based on the respective TTI and its position either above or below its long-term M/A (Moving Average). A crossing of the trend line from below accompanied by some staying power above constitutes a “Buy” signal. Conversely, a clear break below the line constitutes a “Sell” signal. Additionally, I use a 7.5% trailing stop loss on all positions in these categories to control downside risk.
3. All other investment arenas do not have a TTI and should be traded based on the position of the individual ETF relative to its own respective trend line (%M/A). That’s why those signals are referred to as a “Selective Buy.” In other words, if an ETF crosses its own trendline to the upside, a “Buy” signal is generated. Since these areas tend to be more volatile, I recommend a wider trailing sell stop of 7.5%-10% depending on your risk tolerance.
If you are unfamiliar with some of the terminology, please see Glossary of Termsand new subscriber information in section 9.
1. DOMESTIC EQUITY ETFs: BUY — since 07/22/2020
Click on chart to enlarge
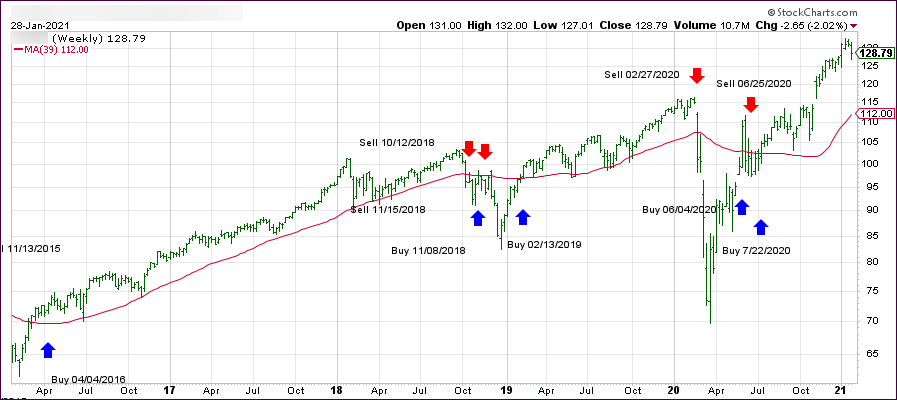
Our main directional indicator, the Domestic Trend Tracking Index (TTI-green line in the above chart) has now rallied above its long-term trend line (red) by +15.99% and remains in “BUY” mode as posted.