
- Moving the market
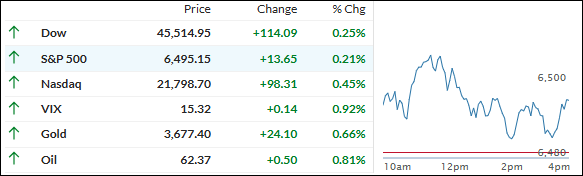
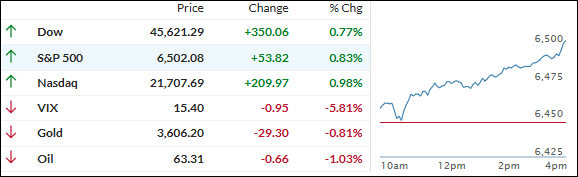
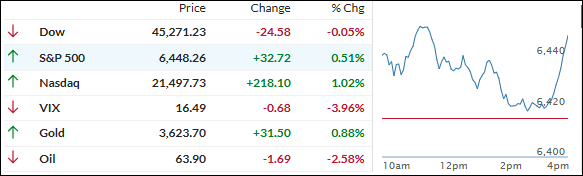
The Nasdaq popped to a new record this morning, while the S&P 500 held mostly flat as Wall Street geared up for a week packed with crucial inflation numbers.
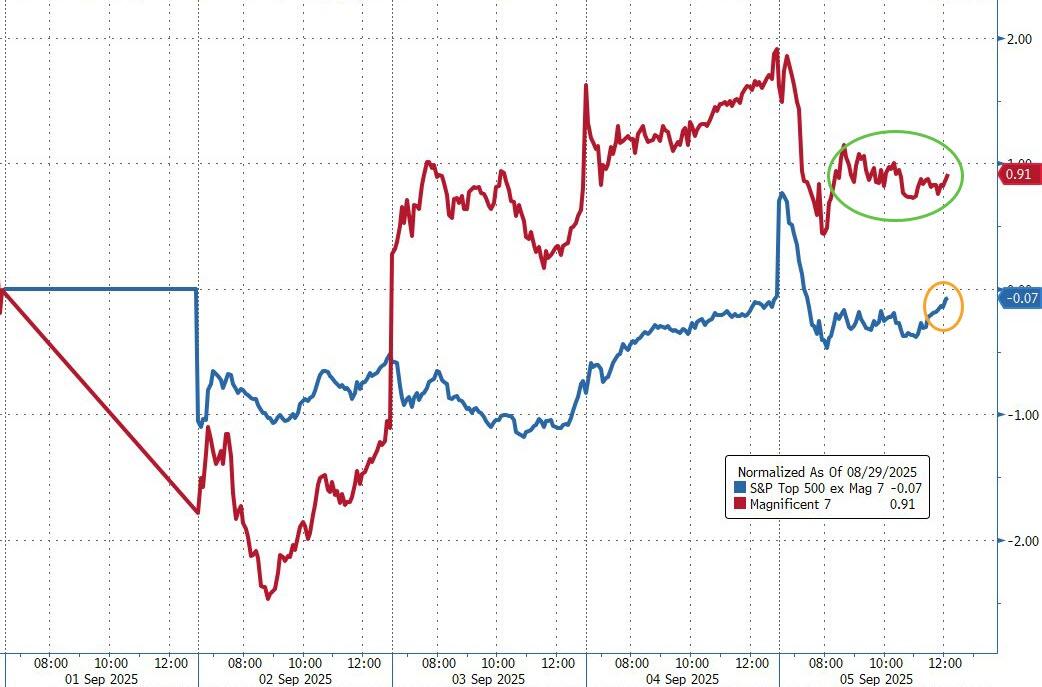
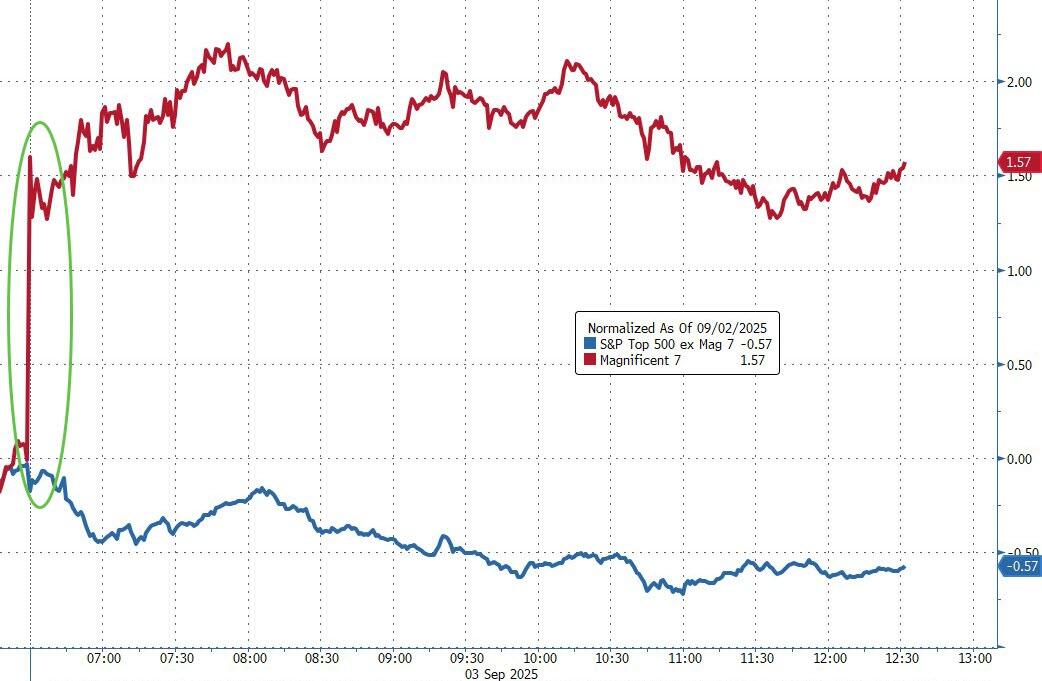
Nvidia bounced nearly 2% and Meta added over 1%, joining gains from other big tech names like Amazon and Microsoft, which helped the “Magnificent Seven” keep some heat under the market.
Traders are fixated on the upcoming Producer Price Index on Wednesday and Consumer Price Index on Thursday—two reports that could set the tone for what’s next with the Fed.
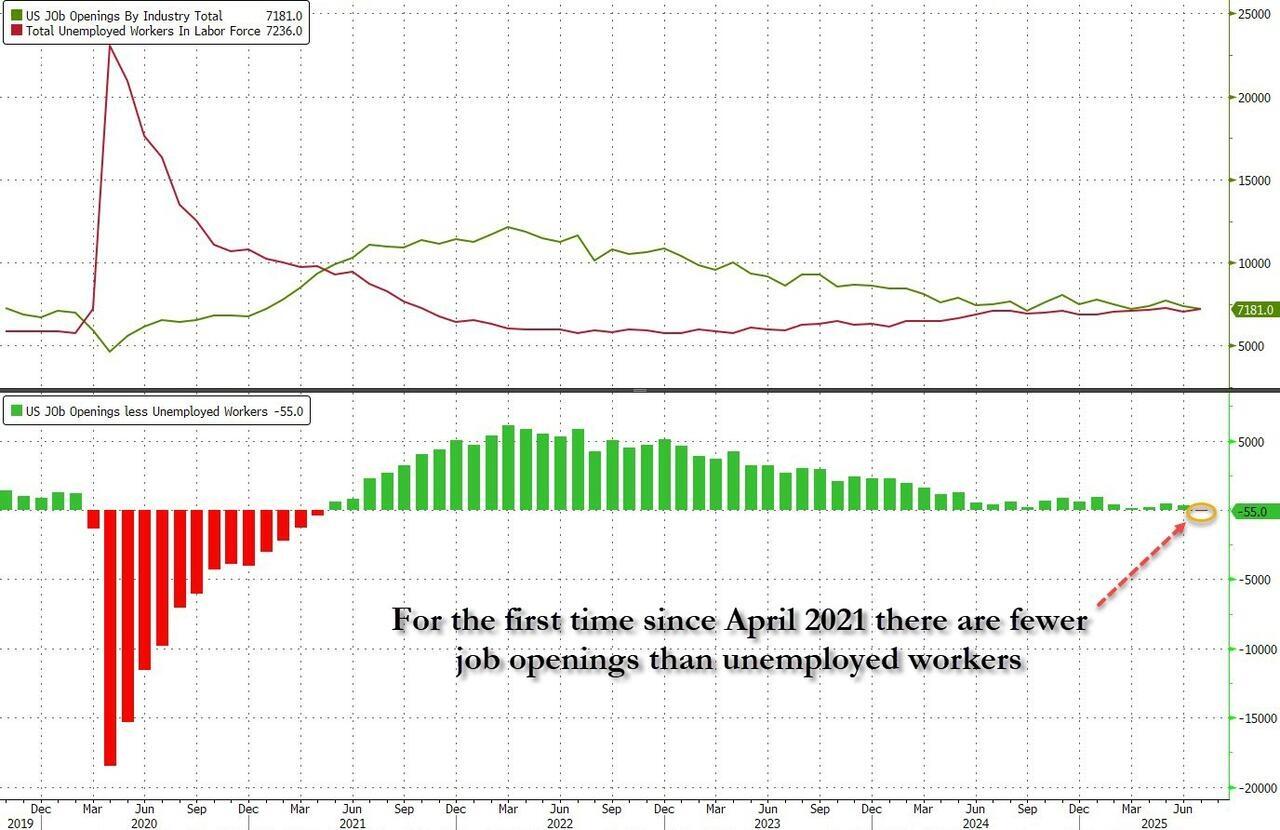
The weak jobs print from Friday has traders betting the Fed will finally go ahead with a rate cut at its September meeting, with chatter about the chance for a half-point move growing a bit louder.
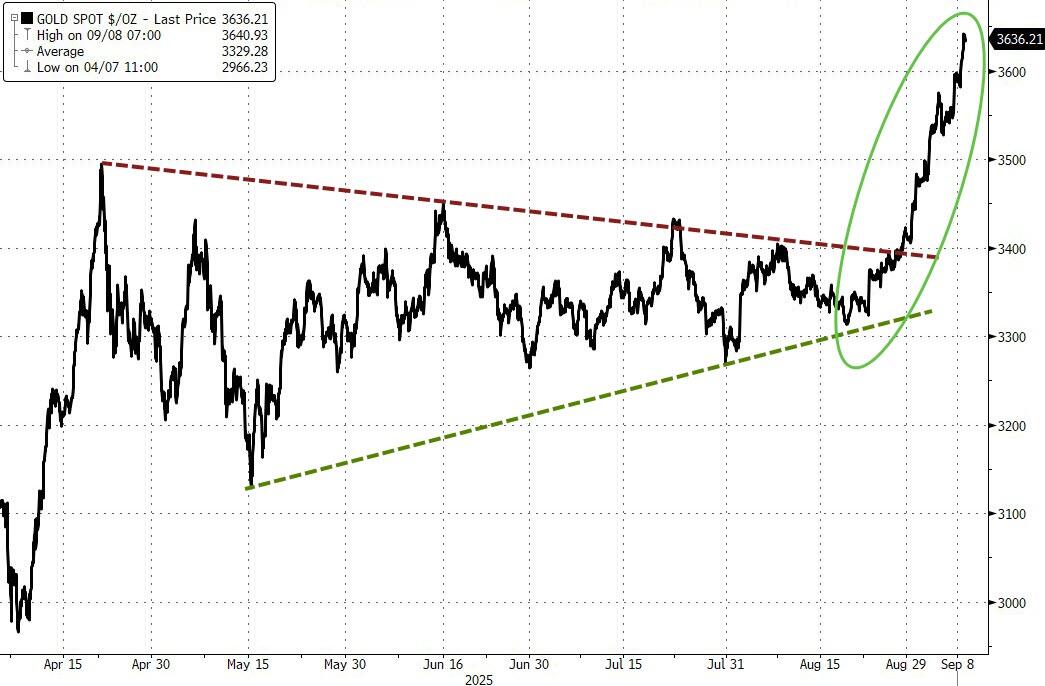
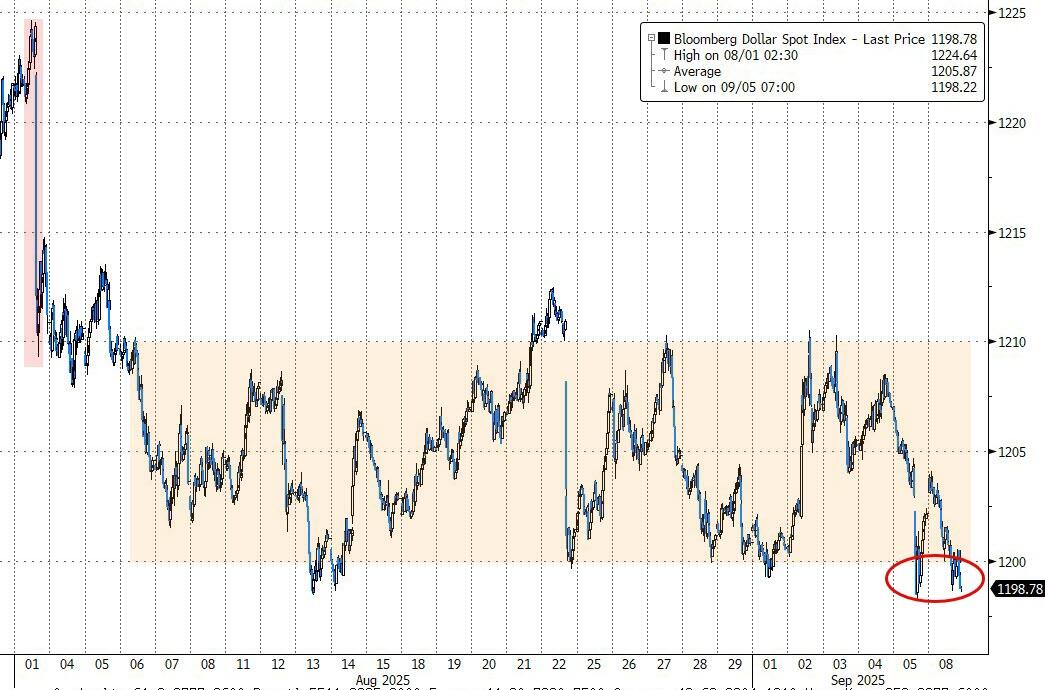
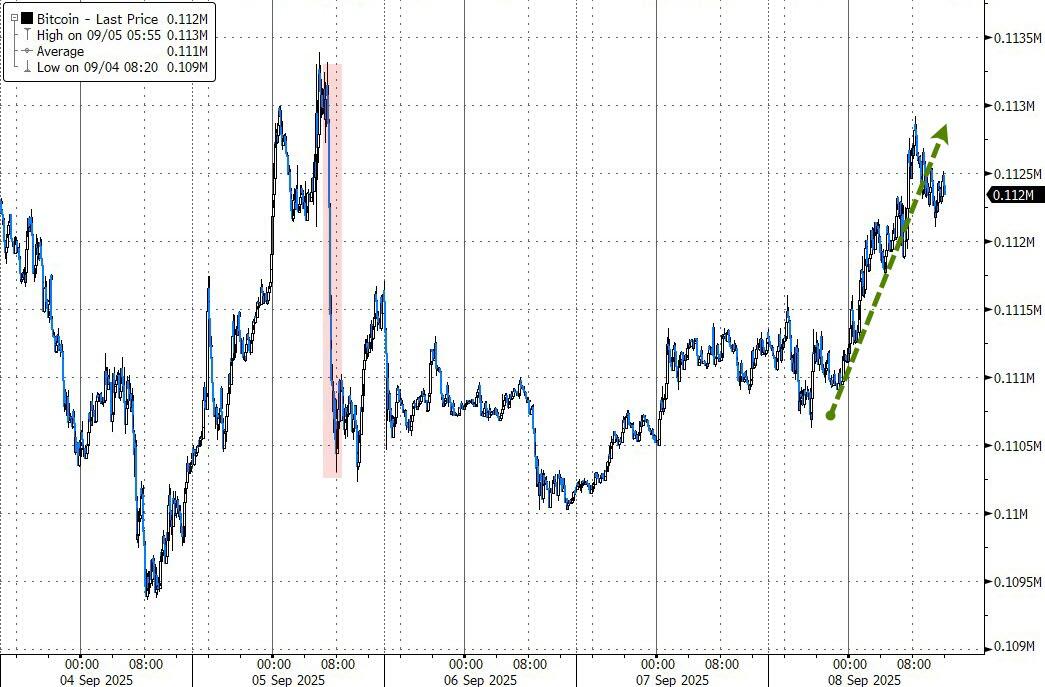
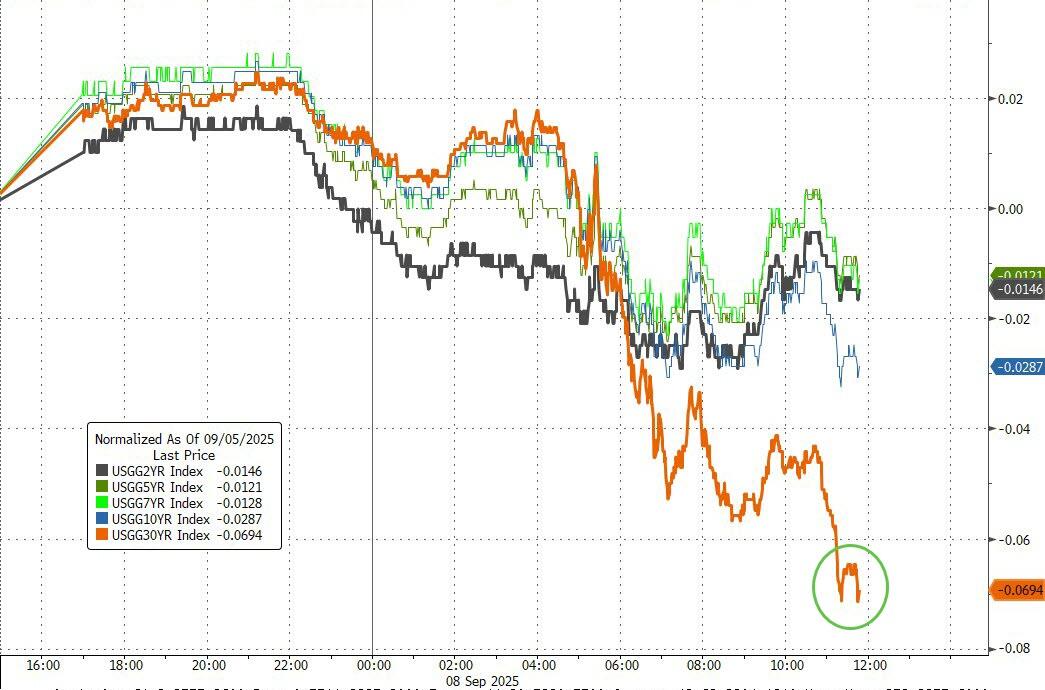
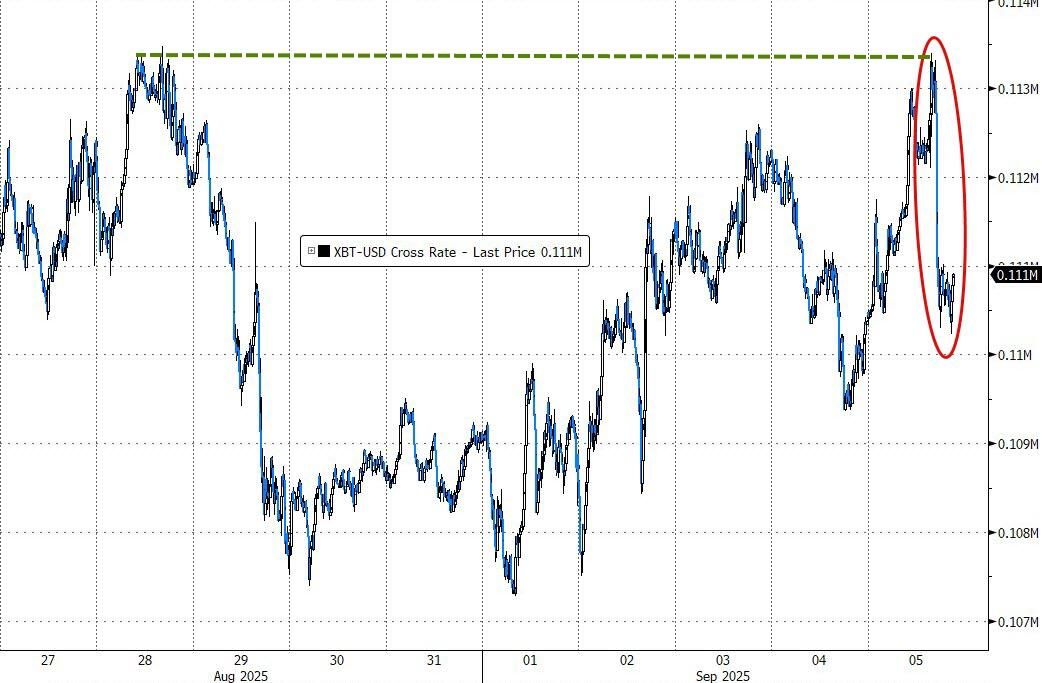
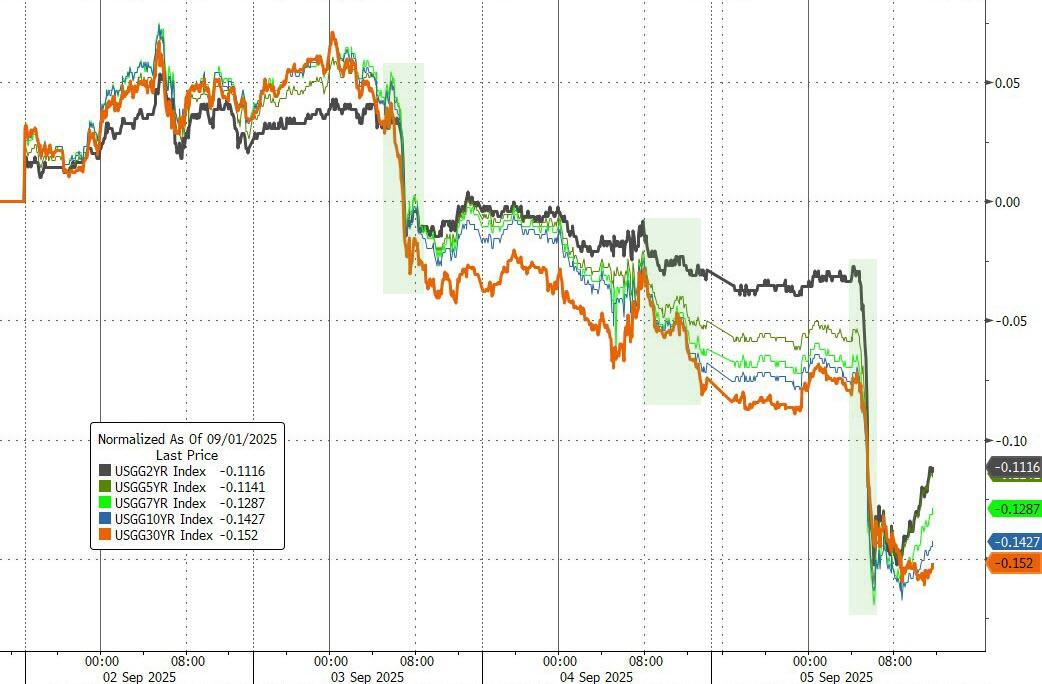
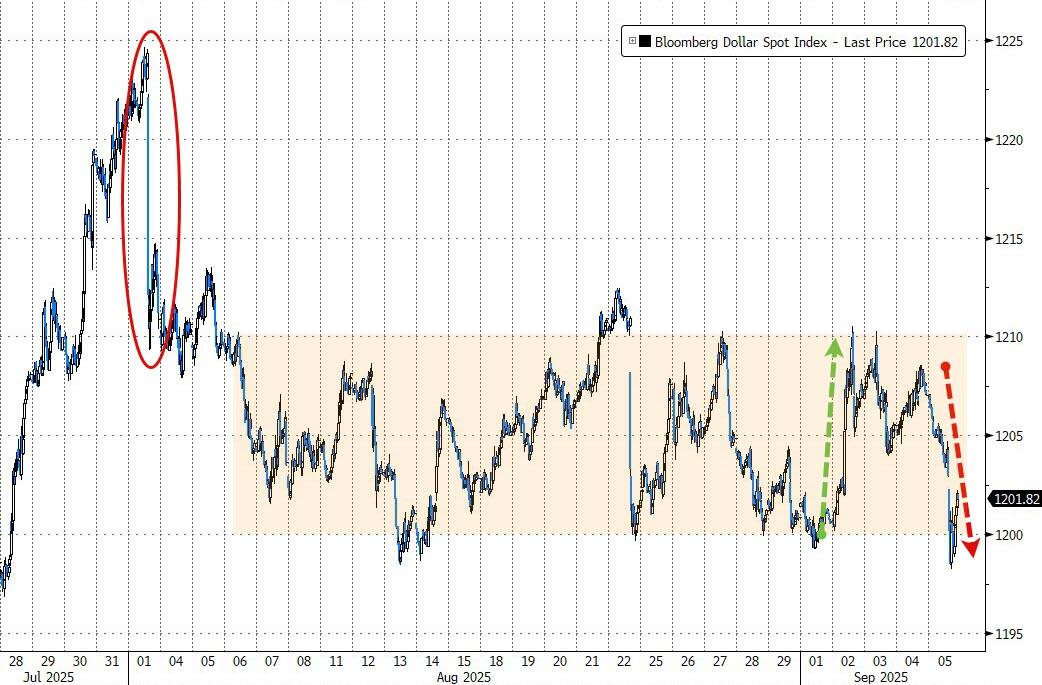
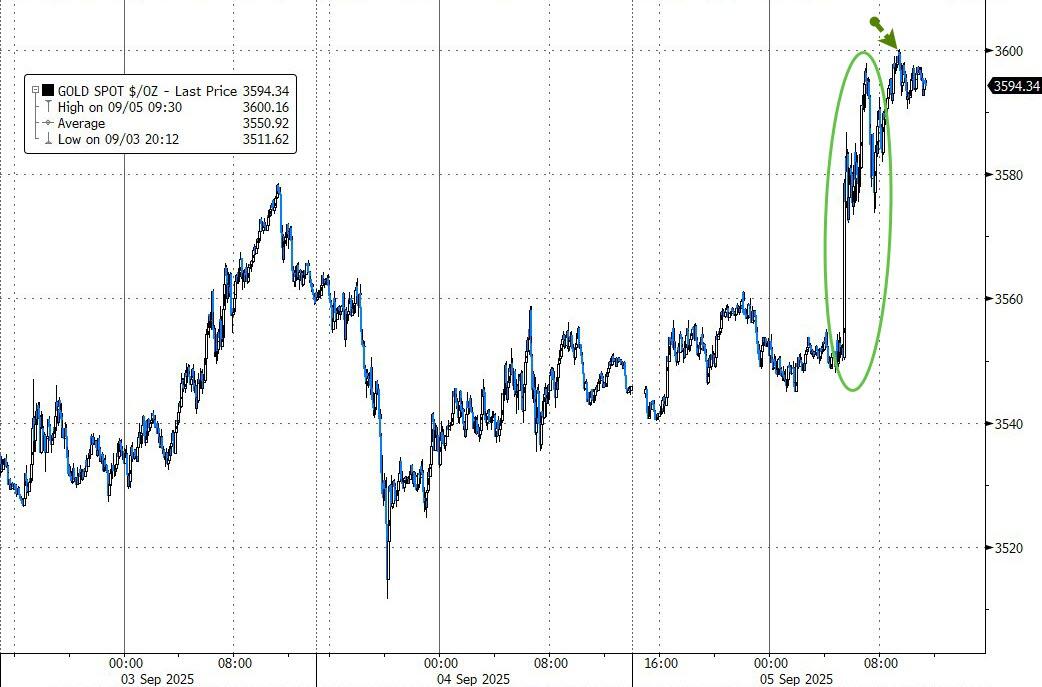
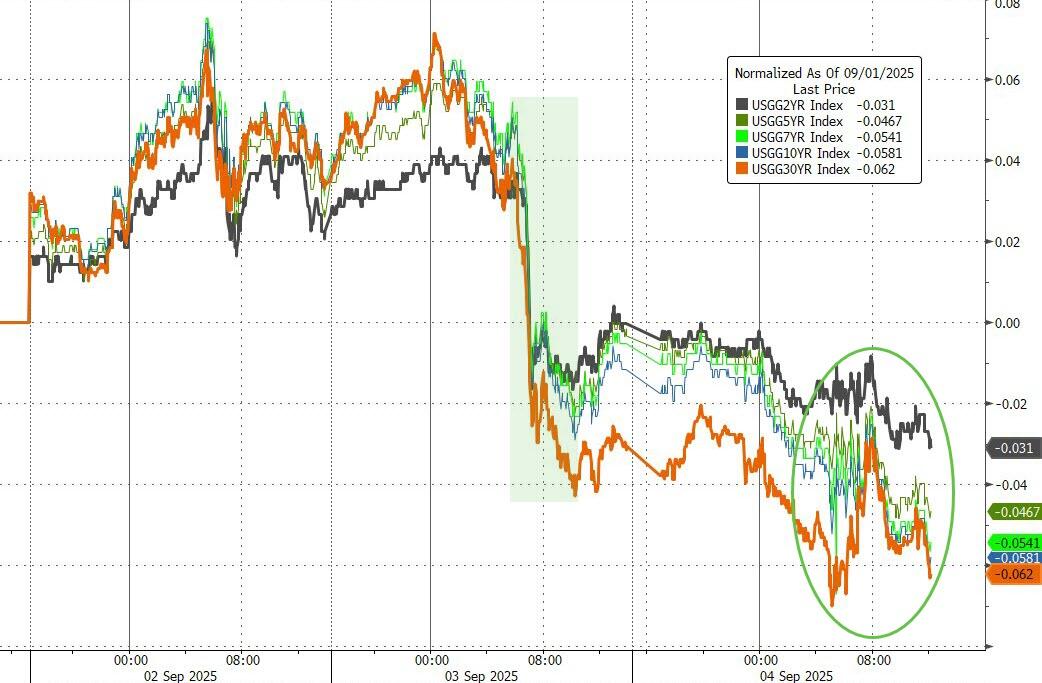
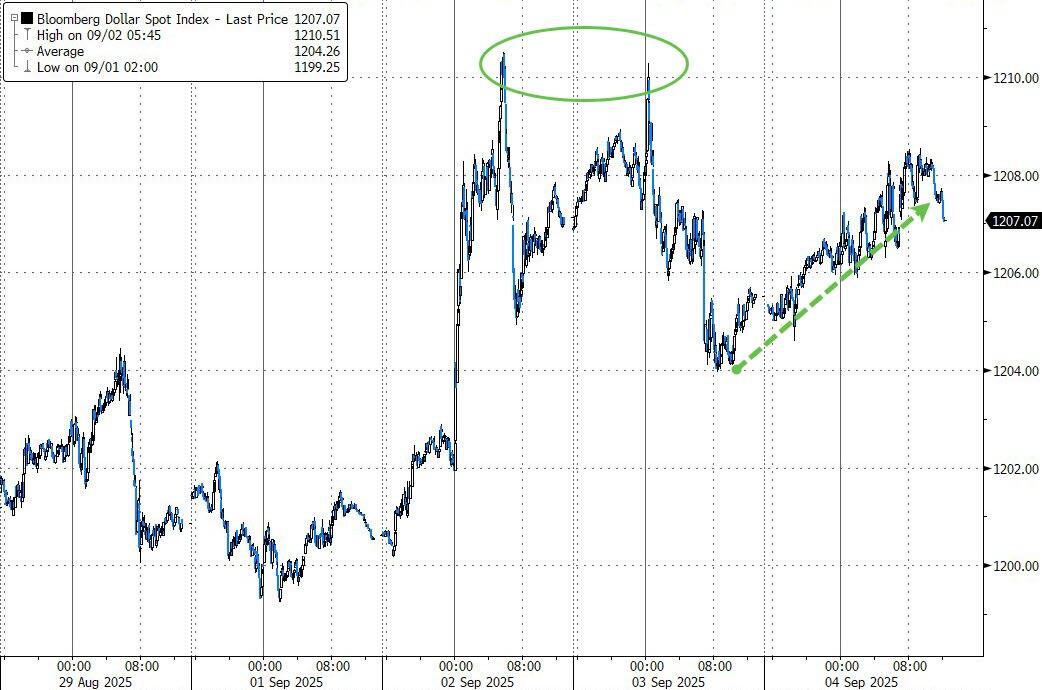
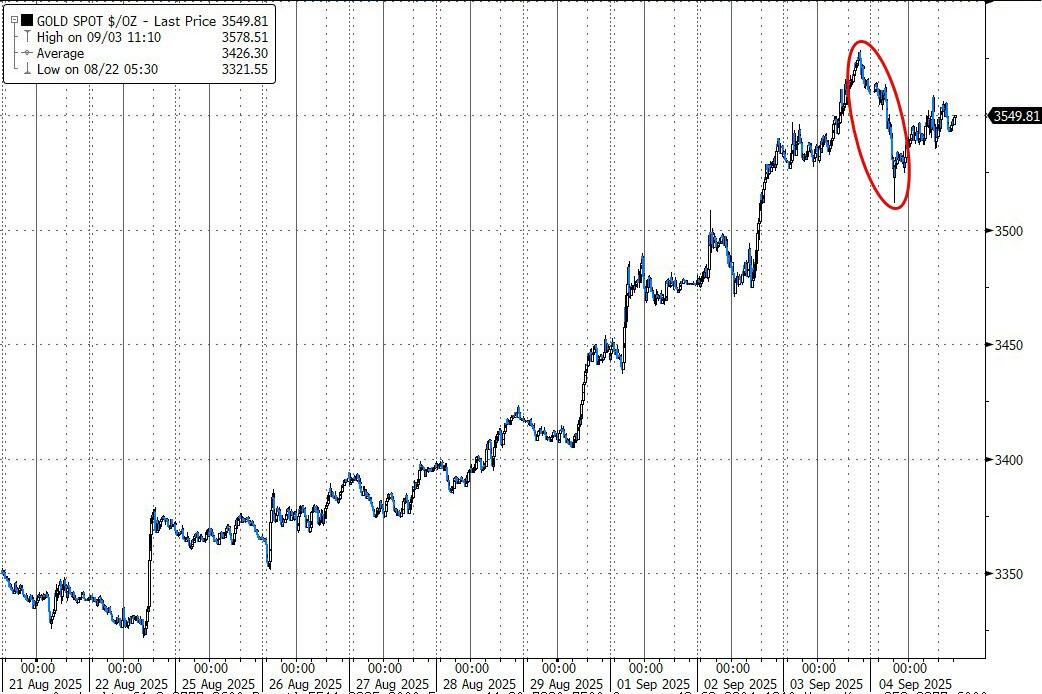
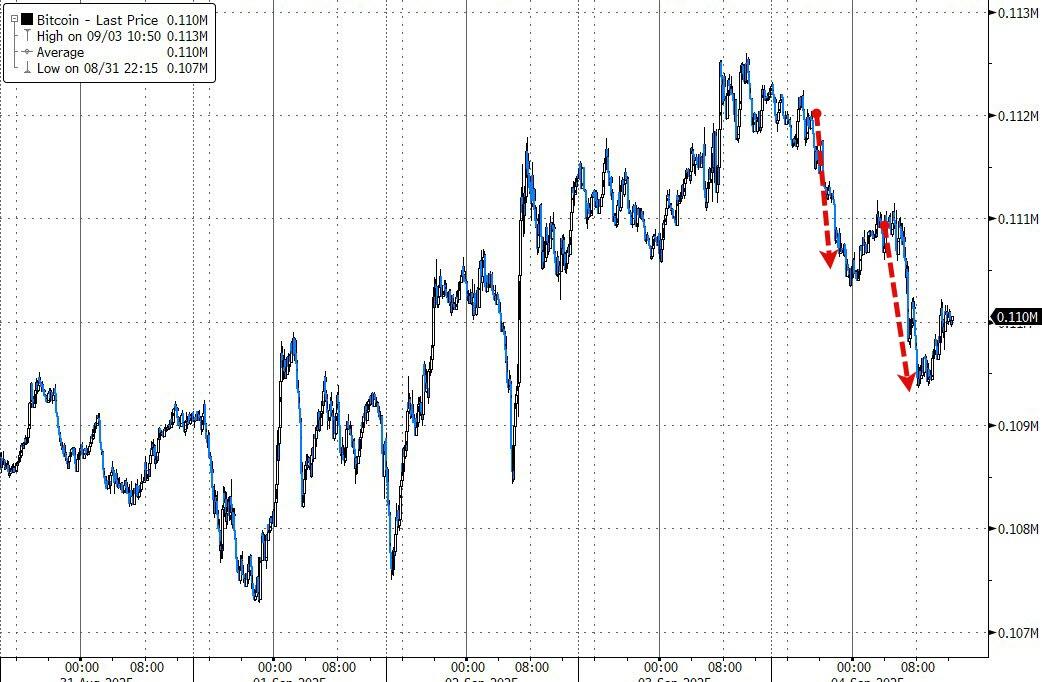
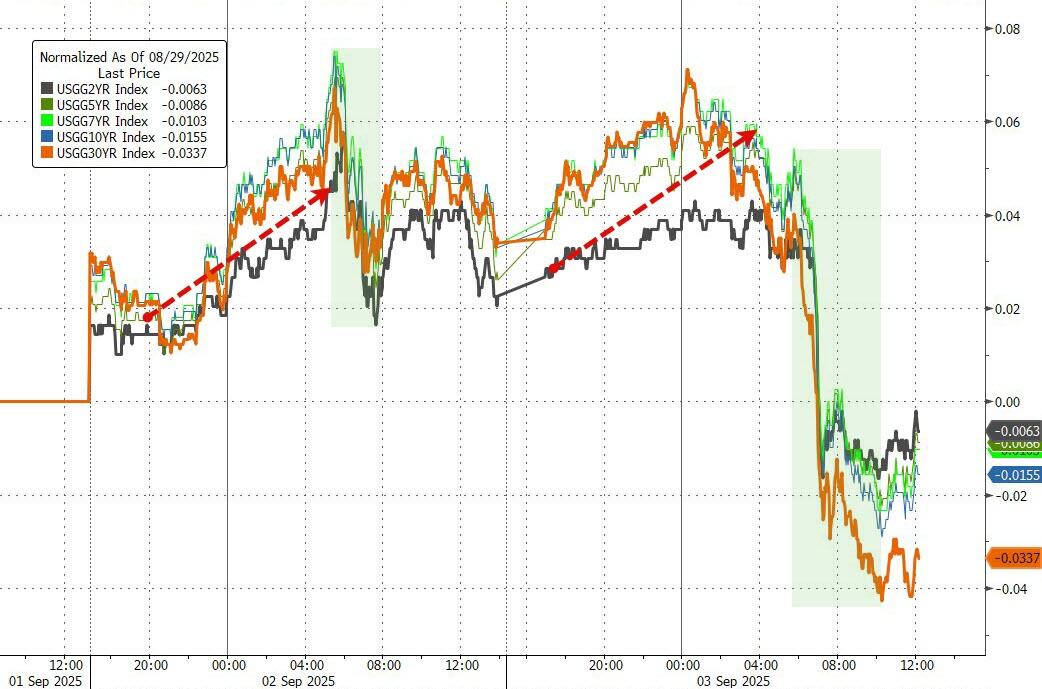
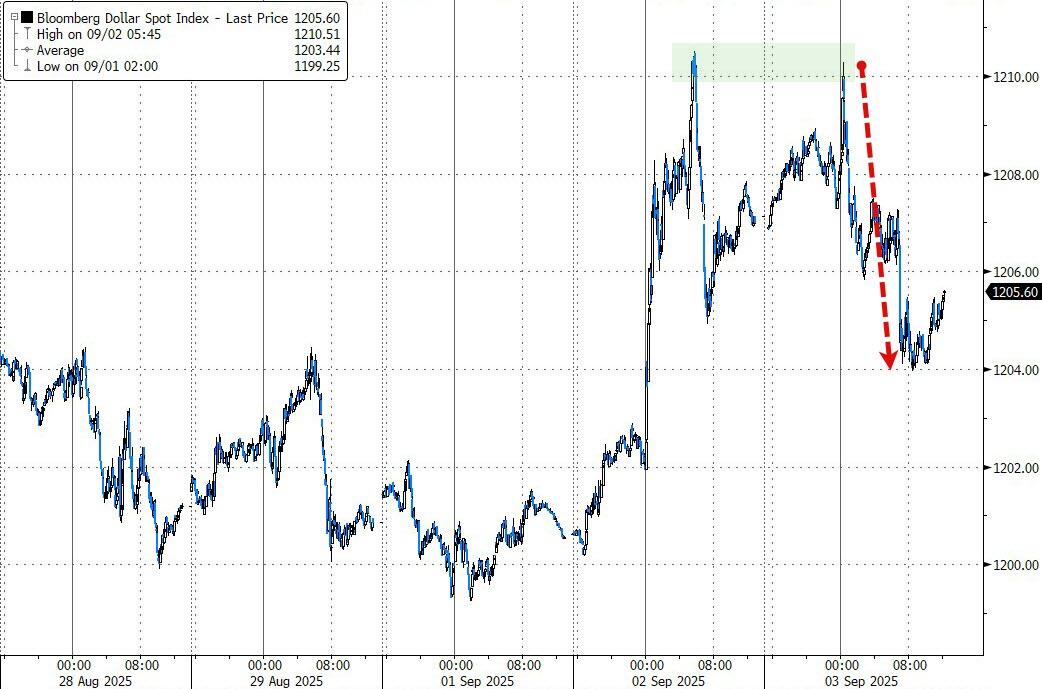
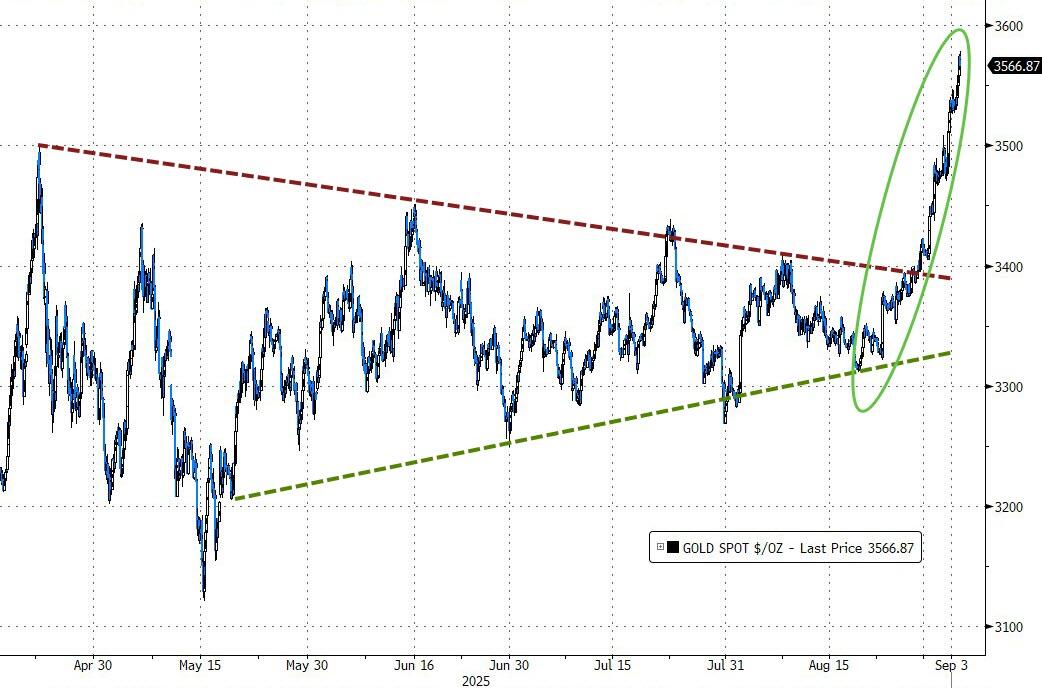
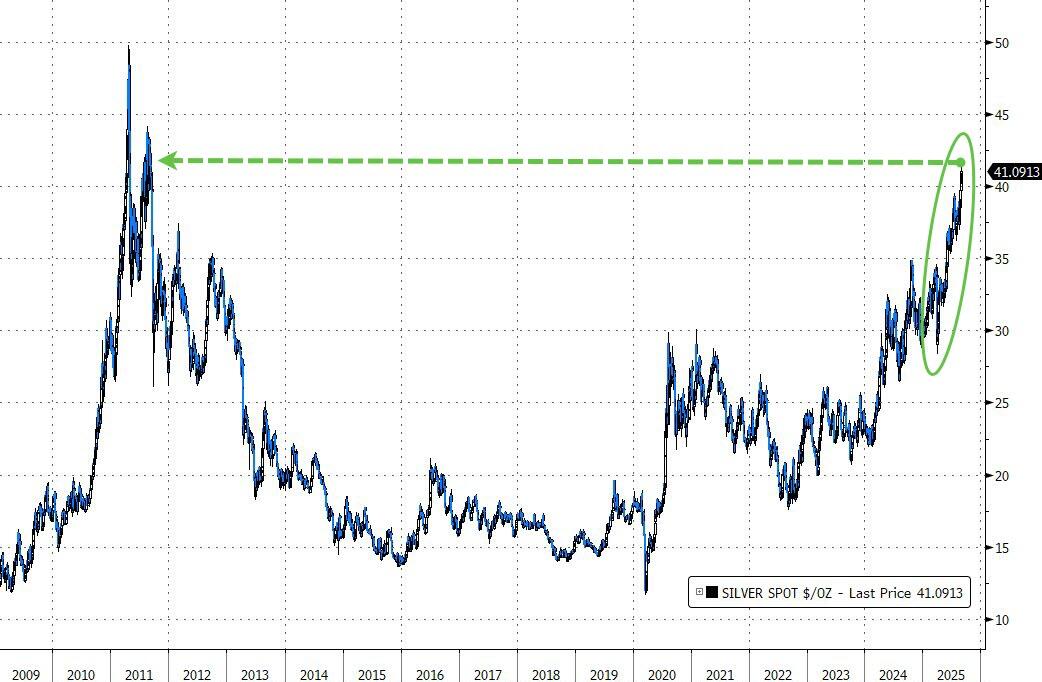
Gold’s bull run hasn’t missed a beat, conquering $3,600 for a fresh record, while the dollar softened, and bitcoin raced back up toward Friday’s highs as bond yields drifted lower.
The way I see it, this “bad news is good news” vibe has powered rate cut hopes, but it all hinges on how these inflation reads come in.
Odds are now around 15% that we get a 0.5% cut from the Fed. But the question on my mind is: If the Fed finally delivers that cut, will equities rally—or will we get another bout of “buy the rumor, sell the fact”?
Read More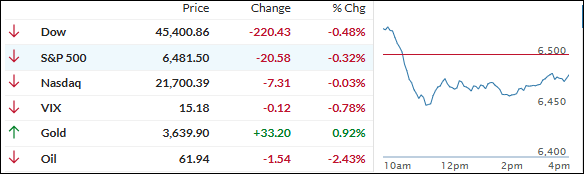