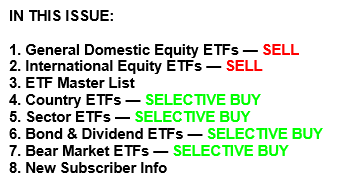
Rocketing Higher—New Domestic “Buy” Signal Generated

Ulli Market Commentary Contact

[Chart courtesy of MarketWatch.com]

  1. Moving the markets

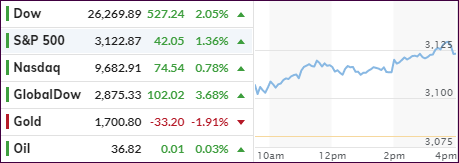
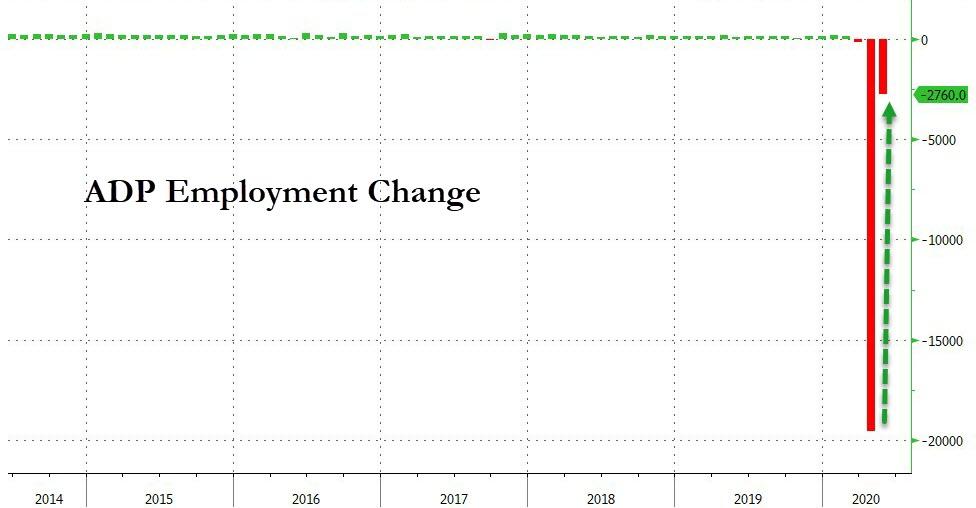
Yesterday’s levitation continued right after the opening bell with the major indexes storming ahead unabated. Today’s driver were improved ADP employment data, which solidly beat expectations. They remain negative but show a massive improvement from the prior month.

Even crashing April factory orders, by the most in some 10 years, could not offset the bullish momentum. As ZH pointed out, year-over-year, factory orders plummeted 22.3%, which was the worst since the financial crisis.

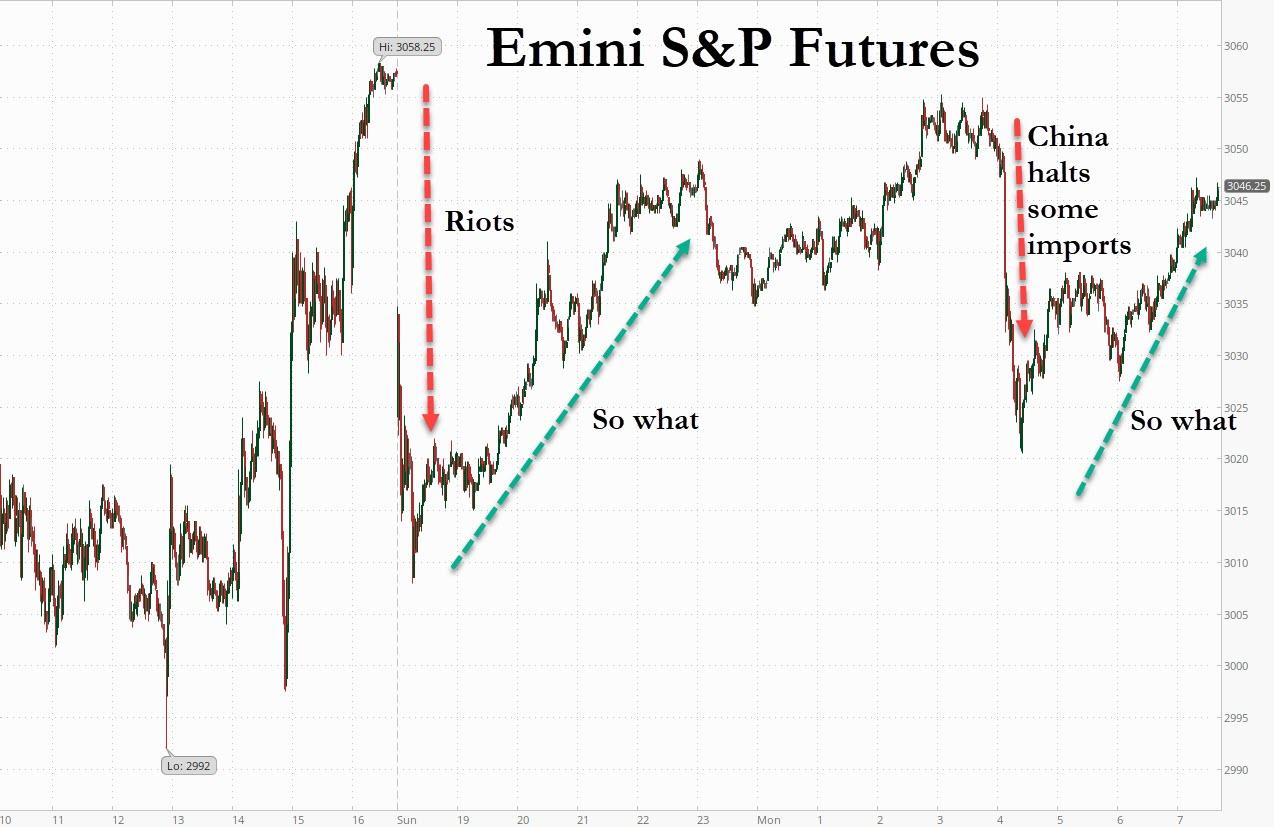
Despite the civil unrest throughout the nation, the prevailing opinion of traders is that the economy has bottomed out and is on its way to a strong recovery, possibly V-shaped—or so the hope goes.

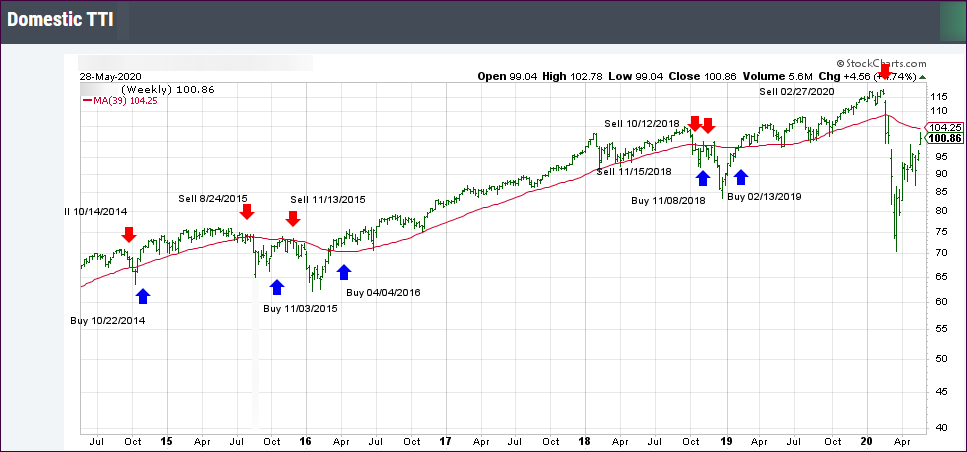
Be that as it may, today’s upswing provided enough upward momentum to push our main directional indicator, the Domestic Trend Tracking Index (TTI), above its long-term trend line into bullish territory, thereby generating a new “Buy” for “broadly diversified domestic equity ETFs and mutual funds.

In my advisor practice, as I posted, we already had selected positions in sector ETFs and will fill the bucket with more equity ETFs, which I got head start on this morning.   

If you are following along on your own, be sure to only invest in the markets, if you establish an exit strategy, and use your risk tolerance as a guide. The markets are at elevated levels, and the dangers of a sudden and massive reversal are always present.

The effective date of this signal will be tomorrow, June 4th, unless I see a huge downturn in the markets, in which case I will delay the execution of my orders.

Read More

Riots And Destruction—Stocks Rally

Ulli Market Commentary Contact

[Chart courtesy of MarketWatch.com]

  1. Moving the markets

Today’s market theme was the same one like yesterday with traders focusing on easing Covid-19 lockdowns, while the ever-increasing civil unrest and riots were again ignored.

Destroyed businesses and subsequent curfews certainly will impact an economy under stress, especially one that is trying to slowly re-open and is now threatened again with new interruptions.

It’s hard to believe that the events of the past few days have not affected stocks, which seem oblivious to anything else other than being focused on taking out the old highs. Go figure…

“Most people on Main Street think it’s crazy where the stock market is trading, especially on a day where you have major protests happening in the U.S.,” Sam Hendel, president of Levin Easterly Partners, a New York asset management firm, opined.

For sure, it remains to be seen if this “hear no evil, see no evil” market attitude can prevail, which all depends on whether current riots can be brought under control quickly. If this dilemma drags on for any length of time, I believe that stocks will shift into reverse in a hurry.

As I have posted many times, liquidity is the oil that greases the wheels of the stock market. We saw a little hiccup, AKA lack of liquidity, into the close today when the S&P 500 surged 10 points in one tick, as a $3.2 billion MOC order (Market On Close) could not be have been filled otherwise. As luck would have it, it was a Buy order, thereby helping the bullish cause.

Zero Hedge had the best closing analysis about today’s events:

While we are constantly told that Black Lives Matter, Blue Lives Matter; in fact, truth be told, ALL LIVES MATTER; but, there is one thing that matters more… higher stock market prices…

Former PIMCO chief Mohamed El-Erian saw it this way:

“This notion that it doesn’t matter what happens to fundamentals. It doesn’t matter what happens to corporate earnings. It doesn’t matter what happens to economic growth… because The Fed will buy what I want to buy… that’s the mindset of the market right now.”

Whatever you decide to do, do not enter these markets without an exit strategy.

Read More

Optimism Rules

Ulli Market Commentary Contact

[Chart courtesy of MarketWatch.com]

  1. Moving the markets

The futures started on a rollercoaster ride with a sharp opening drop being followed by a rebound, which was followed by a decline and then another bounce back, as this chart shows.

The regular session showed much less volatility when, after a weak start, bullish momentum appeared, and a slow but consistent ascent pushed the major indexes to modest gains.

The driver turned out to be hopes that the worst of the economic damage caused by Covid-19 is now in the rear-view mirror, while the current civil unrest, along with appearances of the National Guard, was simply ignored.

“The direct economic impact of the protests is small, at least so far,” Mark Zandi, chief economist of Moody’s Analytics, told MarketWatch. However, he said that the near-term damage to the psyche of consumers and the business community may be more substantial.

“Just when people were starting to come out of the proverbial bunkers, the protests may be too much for them, and they will go back in,” he said. “The protests also are symptomatic of just how deep the economic problems and racial tensions go in our country,” the economist said.

Besides a modest short squeeze, there was nothing to pump the markets, but we know that the Fed with its Quantitative Easing programs (QE) can at any time affect market direction.

To recap in simple terms what QE is, here’s analyst Bill Blain’s explanation:

“The way QE works is for a National Treasury to sell bonds in the morning, the government to spend the money by lunchtime, and the Central Bank to buy the bonds in the evening. The result is a liability on the Treasury and an asset on the books of the Central Bank.”

Can’t say it any more precisely.

Continue reading…

Read More

ETFs On The Cutline – Updated Through 05/29/2020

Ulli ETFs on the Cutline Contact

Below, please find the latest High-Volume ETF Cutline report, which shows how far above or below their respective long-term trend lines (39-week SMA) my currently tracked ETFs are positioned.

This report covers the HV ETF Master List from Thursday’s StatSheet and includes 322 High Volume ETFs, defined as those with an average daily volume of more than $5 million, of which currently 107 (last week 84) are hovering in bullish territory. The yellow line separates those ETFs that are positioned above their trend line (%M/A) from those that have dropped below it.

Take a look:                                                                   

The HV ETF Master Cutline Report

In case you are not familiar with some of the terminology used in the reports, please read the Glossary of Terms. If you missed the original post about the Cutline approach, you can read it here.      

ETF Tracker Newsletter For May 29, 2020

Ulli ETF Tracker Contact

ETF Tracker StatSheet          

You can view the latest version here.

TRUMP PLEASES MARKETS

[Chart courtesy of MarketWatch.com]

  1. Moving the markets

Nervousness prevailed in the markets with the major indexes sliding, as the world waited with bated breath for Trump’s remarks on potential actions to be taken against China’s ‘violations.’

His highly anticipated news conference came and went, but it did not turn out as stringent and disturbing as traders had feared. That caused the computer algos to shift into high gear and a vertical spike generated a green close except for the Dow.

ZeroHedge likened the ‘soft’ stance towards China as “caving to market pressure:”

In what was perhaps the clearest sign that the president was calibrating his response with one eye on the stock ticker, the president didn’t announce any new tariffs or trade actions, ameliorating fears that he might scrap the “Phase 1” trade deal.

The market cheered the move, as equities surged off their lows of the day as the president simultaneously signaled a more confrontational approach to his dealings with Beijing, while being careful not to escalate an already tenuous situation.

ZH’s headlines about poor economic data points were again a non-event, but they are at least noteworthy:

UMich Sentiment disappoints as “Hope” hits 7-year lows

Chicago PMI plummets to 11-year low as orders and production plunge

US Spending crashes by most ever despite $3 trillion government handout-driven income surge

For the week, the S&P 500 added another 3% closing out the month with a gain of some 7.5%, with SPY now having reached the level we sold at on 2/27/20. In other words, the buy-and-hold crowd has been successfully bailed out again.

As I posted, we have added selective positions from well-performing sector ETFs, and I believe a new domestic “Buy” is in the making and could possibly materialize next week, if the rebound continues unabated.

Read More

Weekly StatSheet For The ETF Tracker Newsletter – Updated Through 05/28/2020

Ulli ETF StatSheet Contact

ETF Data updated through Thursday, May 28, 2020

Methodology/Use of this StatSheet:

1. From the universe of over 1,800 ETFs, I have selected only those with a trading volume of over $5 million per day (HV ETFs), so that liquidity and a small bid/ask spread are assured.

2. Trend Tracking Indexes (TTIs)

Buy or Sell decisions for Domestic and International ETFs (section 1 and 2), are made based on the respective TTI and its position either above or below its long-term M/A (Moving Average). A crossing of the trend line from below accompanied by some staying power above constitutes a “Buy” signal. Conversely, a clear break below the line constitutes a “Sell” signal. Additionally, I use a 7.5% trailing stop loss on all positions in these categories to control downside risk.

3. All other investment arenas do not have a TTI and should be traded based on  the position of the individual ETF relative to its own respective trend line (%M/A). That’s why those signals are referred to as a “Selective Buy.” In other words, if an ETF crosses its own trendline to the upside, a “Buy” signal is generated. Since these areas tend to be more volatile, I recommend a wider trailing sell stop of 7.5% -10% depending on your risk tolerance.

If you are unfamiliar with some of the terminology, please see Glossary of Terms and new subscriber information in section 9.     

1. DOMESTIC EQUITY ETFs: SELL — since 02/27/2020


Click on chart to enlarge

Our main directional indicator, the Domestic Trend Tracking Index (TTI-green line in the above chart) is now positioned below its long-term trend line (red) by -3.31% after having generated a new Domestic “Sell” signal effective 2/27/20 as posted.

Read More