
- Moving the markets
The futures started on a rollercoaster ride with a sharp opening drop being followed by a rebound, which was followed by a decline and then another bounce back, as this chart shows.
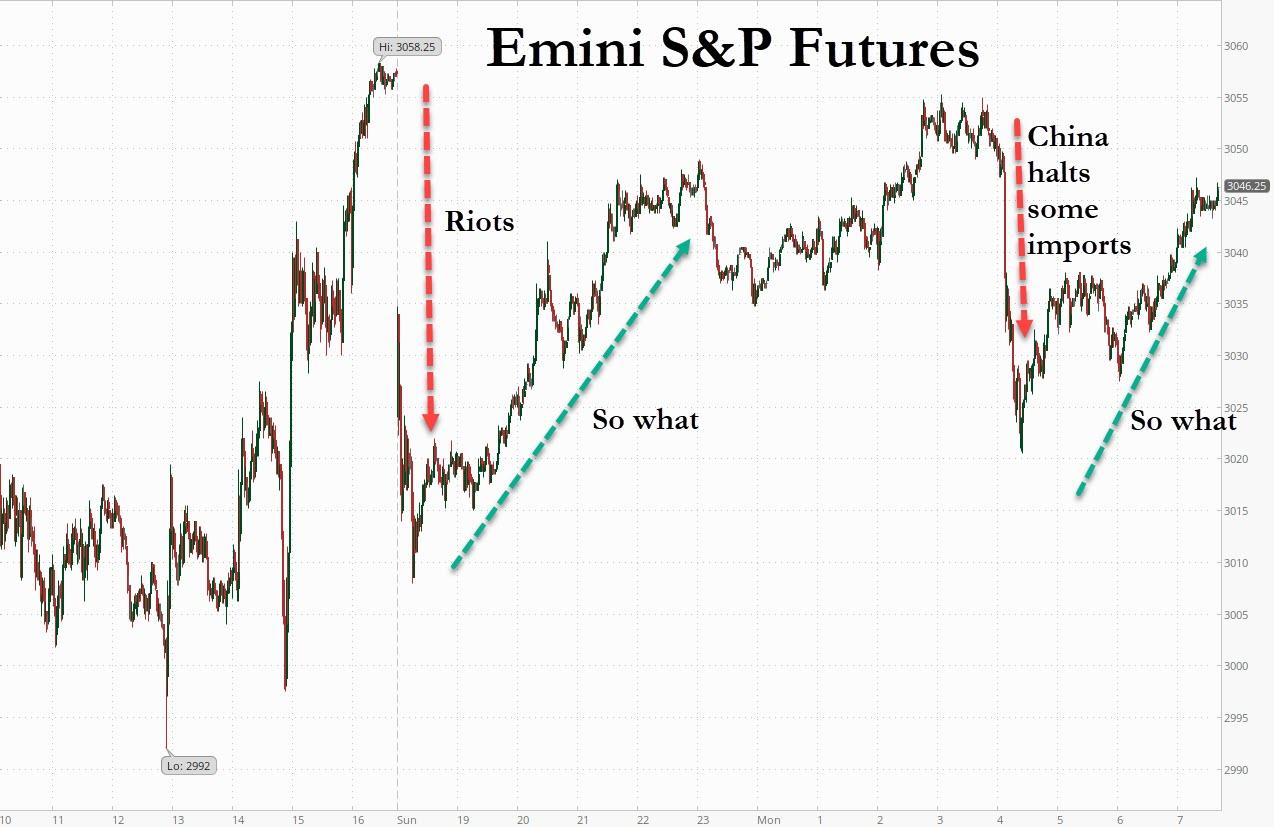
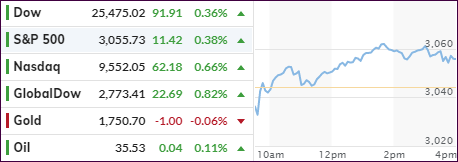
The regular session showed much less volatility when, after a weak start, bullish momentum appeared, and a slow but consistent ascent pushed the major indexes to modest gains.
The driver turned out to be hopes that the worst of the economic damage caused by Covid-19 is now in the rear-view mirror, while the current civil unrest, along with appearances of the National Guard, was simply ignored.
“The direct economic impact of the protests is small, at least so far,” Mark Zandi, chief economist of Moody’s Analytics, told MarketWatch. However, he said that the near-term damage to the psyche of consumers and the business community may be more substantial.
“Just when people were starting to come out of the proverbial bunkers, the protests may be too much for them, and they will go back in,” he said. “The protests also are symptomatic of just how deep the economic problems and racial tensions go in our country,” the economist said.
Besides a modest short squeeze, there was nothing to pump the markets, but we know that the Fed with its Quantitative Easing programs (QE) can at any time affect market direction.
To recap in simple terms what QE is, here’s analyst Bill Blain’s explanation:
“The way QE works is for a National Treasury to sell bonds in the morning, the government to spend the money by lunchtime, and the Central Bank to buy the bonds in the evening. The result is a liability on the Treasury and an asset on the books of the Central Bank.”
Can’t say it any more precisely.
Continue reading…
2. ETFs in the Spotlight
In case you missed the announcement and description of this section, you can read it here again.
It features some of the 10 broadly diversified domestic and sector ETFs from my HighVolume list as posted every Saturday. Furthermore, they are screened for the lowest MaxDD% number meaning they have been showing better resistance to temporary sell offs than all others over the past year.
The below table simply demonstrates the magnitude with which these ETFs are fluctuating above or below their respective individual trend lines (%+/-M/A). A break below, represented by a negative number, shows weakness, while a break above, represented by a positive percentage, shows strength.
For hundreds of ETF choices, be sure to reference Thursday’s StatSheet.
For this past domestic “Buy” cycle, which ended on 2/27/2020, here’s how some our candidates have fared:
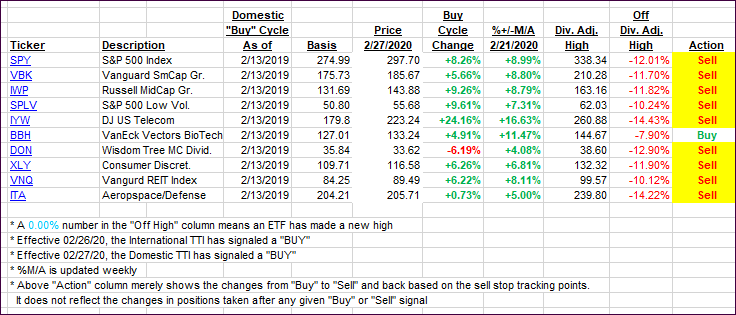
Click image to enlarge
Again, the %+/-M/A column above shows the position of the various ETFs in relation to their respective long-term trend lines, while the trailing sell stops are being tracked in the “Off High” column. The “Action” column will signal a “Sell” once the -8% point has been taken out in the “Off High” column. For more volatile sector ETFs, the trigger point is -10%.
3. Trend Tracking Indexes (TTIs)
Our TTIs improved with the Domestic one taking another step closer to breaking its trend line to the upside.
This is how we closed 06/01/2020:
Domestic TTI: -2.26% below its M/A (prior close -3.40%)—Sell signal effective 02/27/2020
International TTI: -6.04% below its M/A (prior close -6.82%)—Sell signal effective 02/26/2020
Disclosure: I am obliged to inform you that I, as well as my advisory clients, own some of the ETFs listed in the above table. Furthermore, they do not represent a specific investment recommendation for you, they merely show which ETFs from the universe I track are falling within the specified guidelines.
Contact Ulli