
- Moving the markets
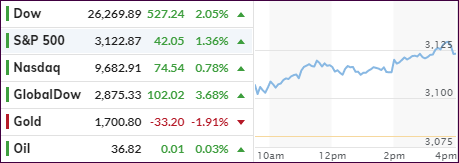
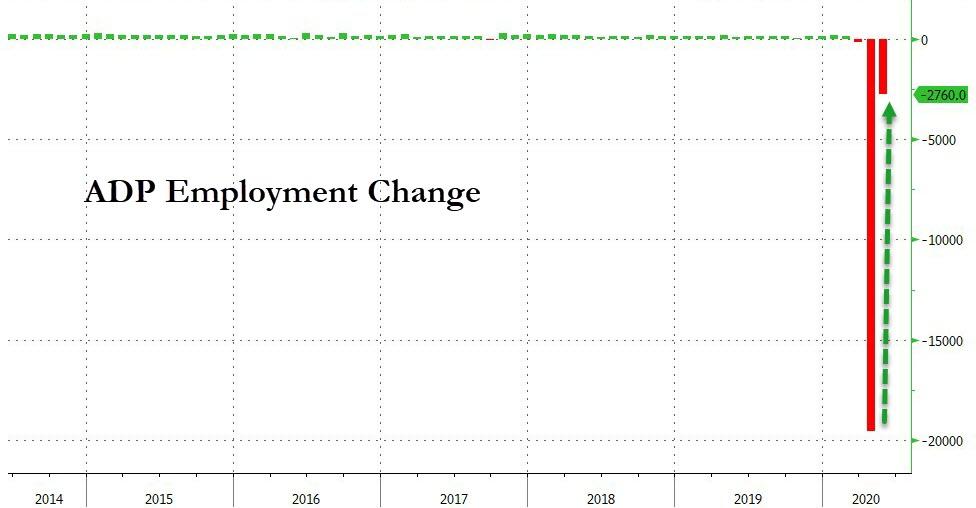
Yesterday’s levitation continued right after the opening bell with the major indexes storming ahead unabated. Today’s driver were improved ADP employment data, which solidly beat expectations. They remain negative but show a massive improvement from the prior month.
Even crashing April factory orders, by the most in some 10 years, could not offset the bullish momentum. As ZH pointed out, year-over-year, factory orders plummeted 22.3%, which was the worst since the financial crisis.
Despite the civil unrest throughout the nation, the prevailing opinion of traders is that the economy has bottomed out and is on its way to a strong recovery, possibly V-shaped—or so the hope goes.
Be that as it may, today’s upswing provided enough upward momentum to push our main directional indicator, the Domestic Trend Tracking Index (TTI), above its long-term trend line into bullish territory, thereby generating a new “Buy” for “broadly diversified domestic equity ETFs and mutual funds.”
In my advisor practice, as I posted, we already had selected positions in sector ETFs and will fill the bucket with more equity ETFs, which I got head start on this morning.
If you are following along on your own, be sure to only invest in the markets, if you establish an exit strategy, and use your risk tolerance as a guide. The markets are at elevated levels, and the dangers of a sudden and massive reversal are always present.
The effective date of this signal will be tomorrow, June 4th, unless I see a huge downturn in the markets, in which case I will delay the execution of my orders.
2. ETFs in the Spotlight
In case you missed the announcement and description of this section, you can read it here again.
It features some of the 10 broadly diversified domestic and sector ETFs from my HighVolume list as posted every Saturday. Furthermore, they are screened for the lowest MaxDD% number meaning they have been showing better resistance to temporary sell offs than all others over the past year.
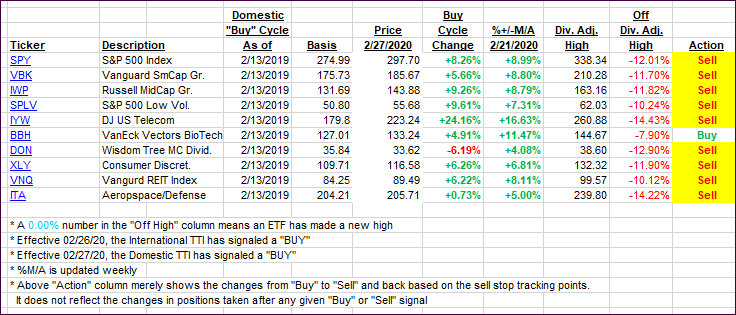
The below table simply demonstrates the magnitude with which these ETFs are fluctuating above or below their respective individual trend lines (%+/-M/A). A break below, represented by a negative number, shows weakness, while a break above, represented by a positive percentage, shows strength.
For hundreds of ETF choices, be sure to reference Thursday’s StatSheet.
For this past domestic “Buy” cycle, which ended on 2/27/2020, here’s how some our candidates have fared:
Click image to enlarge
I will update the above after the confirmation of our new 6/4/20 “Buy” signal.
Again, the %+/-M/A column above shows the position of the various ETFs in relation to their respective long-term trend lines, while the trailing sell stops are being tracked in the “Off High” column. The “Action” column will signal a “Sell” once the -8% point has been taken out in the “Off High” column. For more volatile sector ETFs, the trigger point is -10%.
3. Trend Tracking Indexes (TTIs)
Our TTIs jumped again, and the Domestic one crossed above its long-term trend line into bullish territory, thereby signaling a new “BUY” for domestic ETF/mutual funds. The effective date will be tomorrow, unless I see sharp sell-off in the making, which would delay my decision for a day.
This is how we closed 06/03/2020:
Domestic TTI: +1.65% above its M/A (prior close -1.03%)—Sell signal effective 02/27/2020
International TTI: -2.58% below its M/A (prior close -4.68%)—Sell signal effective 02/26/2020
Disclosure: I am obliged to inform you that I, as well as my advisory clients, own some of the ETFs listed in the above table. Furthermore, they do not represent a specific investment recommendation for you, they merely show which ETFs from the universe I track are falling within the specified guidelines.
Contact Ulli