Fed Keeps Rates Unchanged—An Early Pop Is Followed By A Late Drop

Ulli Market Commentary Contact

[Chart courtesy of MarketWatch.com]

  1. Moving the markets

The Fed did everything it could to put a positive spin on its pledge to keep rates low for the next few years:

The U.S. central bank kept interest rates near zero. Members of the Fed’s policymaking committee also indicated the overnight rate could stay near zero through 2023. “With inflation running persistently below this longer run goal, the Committee will aim to achieve inflation moderately above 2 percent for some time so that inflation averages 2% over time,” the Federal Open Market Committee said in a statement.

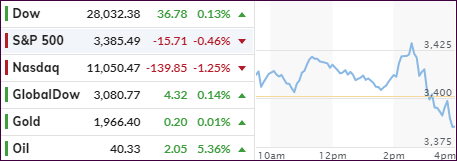
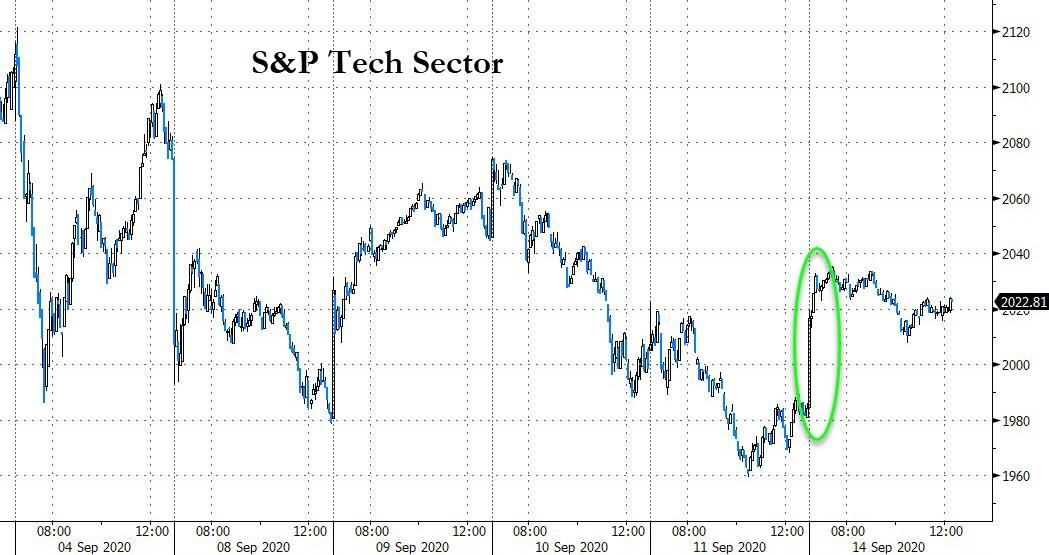
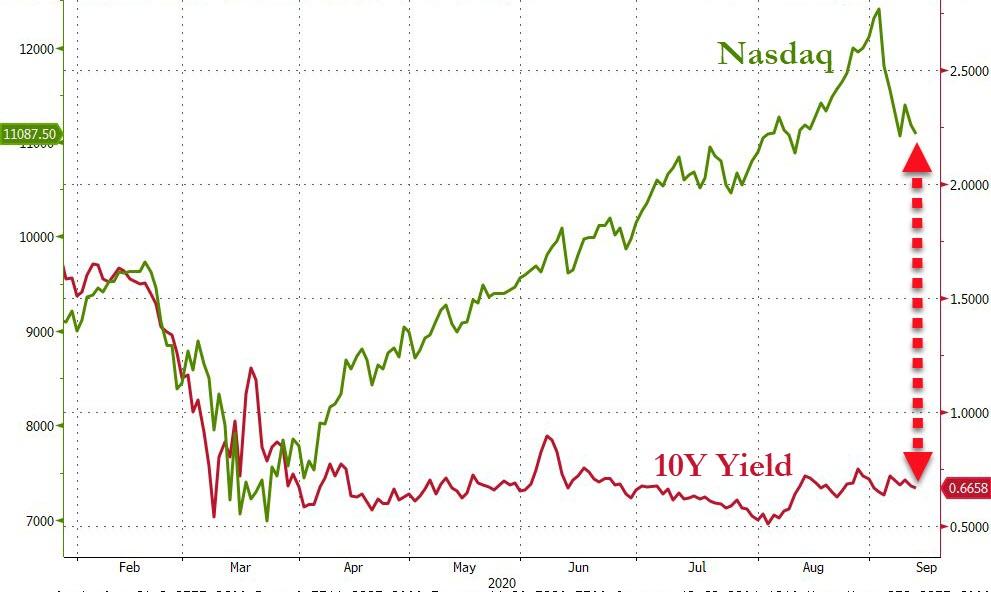
Apparently, the news was not good enough, and a mid-day spike in equities hit the skids, and down we went. Leading the charge into the red was the Nasdaq followed by the S&P 500. The Dow, however, managed to stay above water and eked out a tiny gain.

Not helping matters either was the continued struggle between Reps and Dems to reach an agreement on further stimulus, with hopes dwindling that an agreement can be struck before the elections. Of course, as history has shown, much gamesmanship is involved, so a compromise is always within reach.

More market uncertainty could be in play towards the end of the month/quarter, only two weeks away. JP Morgan warned that some $200 billion of forced month-end selling could affect markets negatively:

With month and quarter-end just two weeks away, Wall Street shifts its collective attention to a recurring phenomenon, namely the quarter-end rebalancing where outsized stock buying or selling can lead to short-term market havoc. The reason is that in quarters in which stocks outperform bonds – as they have in Q3 – funds need to rebalance by selling stocks to remain in compliance with their position mandates (vice versa in quarters when bonds outperform stocks).

From my point of view, we will be in for more choppiness in the markets, as this quarter winds down and, if JP Morgan is correct, the usual quarter-ending window dressing (bullish) might turn into abrupt equity market moves (bearish).

Should these moves be modest, we will not be affected, but should they turn out to be more of an extreme nature, our exit strategy will kick in. Given that, having reduced our exposure to some of the more volatile sectors of the market, will help us to better weather this potential storm.

Read More

No Market Commentary

Ulli Uncategorized Contact

As announced yesterday, I will be out all afternoon and not be able to write today’s market commentary.

Regular posting will resume tomorrow.

Ulli…

Tech In Rebound Mode

Ulli Market Commentary Contact

[Chart courtesy of MarketWatch.com]

  1. Moving the markets

After its worst week since March, the tech sector managed to bounce back, along with the other major indexes, to end the session solidly in the green but off the intra-day highs.

The big jump happened right after the opening on news of corporate deal making and improved prospects for a Covid-19 vaccine involving a host of companies. The arrival of any product is uncertain, as is the question as to how quickly a successful vaccine candidate can be mass produced and distributed. In other words, I am hearing nothing but hype.

ZH added this:

Global stocks are coming off the back of the first consecutive weeks of declines since March and traders remain on edge given the recent reassessment of valuations and volatility in options markets, however late last week, analysts at Goldman, JPMorgan and Deutsche Bank all suggested the recent pullback in the U.S. is nearing an end. On Wednesday, the Federal Reserve is expected to maintain its dovish stance on policy as investors look for signs the global economy is recovering from the pandemic.

However, as important is the answer to the question whether the warring parties can agree on a stimulus package prior to the election. If not, there would be political fallout, as well yet to be determined effects on the markets, none of which I see as positive. On the other hand, we may just witness the usual political grand standing, after which one of parties will cave and compromise.

In the meantime, today’s advance was clearly supported by another short squeeze with “most shorted” stocks rebounding some 3% on the session. Gold had a nice showing as well with GLD adding +0.78%.

On a personal note, I will be out tomorrow afternoon and not be able to write the market commentary, however, regular posting will resume on Wednesday.

Read More

ETFs On The Cutline – Updated Through 09/11/2020

Ulli ETFs on the Cutline Contact

Below, please find the latest High-Volume ETF Cutline report, which shows how far above or below their respective long-term trend lines (39-week SMA) my currently tracked ETFs are positioned.

This report covers the HV ETF Master List from Thursday’s StatSheet and includes 312 High Volume ETFs, defined as those with an average daily volume of more than $5 million, of which currently 234 (last week 245) are hovering in bullish territory. The yellow line separates those ETFs that are positioned above their trend line (%M/A) from those that have dropped below it.

Take a look:                                                                   

The HV ETF Master Cutline Report

In case you are not familiar with some of the terminology used in the reports, please read the Glossary of Terms. If you missed the original post about the Cutline approach, you can read it here.      

ETF Tracker Newsletter For September 11, 2020

Ulli ETF Tracker Contact

ETF Tracker StatSheet          

You can view the latest version here.

NASDAQ ENDS ITS WORST WEEK SINCE MARCH

[Chart courtesy of MarketWatch.com]

  1. Moving the markets

An early bounce was not enough to restore the bullish momentum, as the Nasdaq bobbed and weaved throughout the session, closing in the red and ending its worst week since March with a loss of -4.2%.

The Dow and S&P 500 whipsawed as well but managed to eke out green closes but, for the week, the latter slipped by some -2.5% while the former now shows a -3% performance YTD.

“Markets continue to struggle finding an equilibrium,” said Mark Hackett, chief of investment research at Nationwide. “This market is more akin to the emotional swings of March and April than in recent months. We are likely to continue in a period of directionless volatility as bulls and bears wrestle between the strong Fed liquidity and improving economic backdrop and the continued uncertainty and elevated valuations.”

I agree with that, but I also think that the next few sessions will be critical with bulls and bears continuing their tug-of-war with the bulls looking for signs of support, as the major indexes head towards their respective 50 day M/As. If that support is violated, we may see an acceleration of downward momentum.

Added ZH:

In fact, FANGMAN (Facebook, Apple, Netflix, Google, Microsoft, Amazon, Nvidia) has lost over $1tn in market cap this week and still accounts for over 25% of the total market value of all S&P 500 comps.

On the economic front, the Labor Department reported that the consumer price index rose 0.4% in August vs. expectations of 0.3%. Contributing to this rise was a spike in used car and furniture prices, while rent inflation slowed.

The divergence between the Nasdaq and the 10-year yield, while having narrowed, is still extremely wide, and it will take a correction of gigantic proportions to restore synchronicity again.  

Read More

Weekly StatSheet For The ETF Tracker Newsletter – Updated Through 09/10/2020

Ulli ETF StatSheet Contact

ETF Data updated through Thursday, September 10, 2020

Methodology/Use of this StatSheet:

1. From the universe of over 1,800 ETFs, I have selected only those with a trading volume of over $5 million per day (HV ETFs), so that liquidity and a small bid/ask spread are assured.

2. Trend Tracking Indexes (TTIs)

Buy or Sell decisions for Domestic and International ETFs (section 1 and 2), are made based on the respective TTI and its position either above or below its long-term M/A (Moving Average). A crossing of the trend line from below accompanied by some staying power above constitutes a “Buy” signal. Conversely, a clear break below the line constitutes a “Sell” signal. Additionally, I use a 7.5% trailing stop loss on all positions in these categories to control downside risk.

3. All other investment arenas do not have a TTI and should be traded based on  the position of the individual ETF relative to its own respective trend line (%M/A). That’s why those signals are referred to as a “Selective Buy.” In other words, if an ETF crosses its own trendline to the upside, a “Buy” signal is generated. Since these areas tend to be more volatile, I recommend a wider trailing sell stop of 7.5% -10% depending on your risk tolerance.

If you are unfamiliar with some of the terminology, please see Glossary of Terms and new subscriber information in section 9.     

1. DOMESTIC EQUITY ETFs: BUY — since 07/22/2020

Click on chart to enlarge

Our main directional indicator, the Domestic Trend Tracking Index (TTI-green line in the above chart) has now rallied above its long-term trend line (red) by +4.98% and remains in “BUY” mode as posted.

Read More