
- Moving the markets
The Fed did everything it could to put a positive spin on its pledge to keep rates low for the next few years:
The U.S. central bank kept interest rates near zero. Members of the Fed’s policymaking committee also indicated the overnight rate could stay near zero through 2023. “With inflation running persistently below this longer run goal, the Committee will aim to achieve inflation moderately above 2 percent for some time so that inflation averages 2% over time,” the Federal Open Market Committee said in a statement.
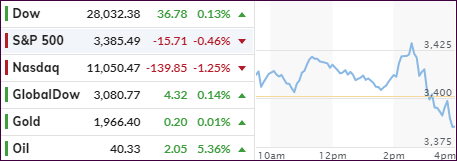
Apparently, the news was not good enough, and a mid-day spike in equities hit the skids, and down we went. Leading the charge into the red was the Nasdaq followed by the S&P 500. The Dow, however, managed to stay above water and eked out a tiny gain.
Not helping matters either was the continued struggle between Reps and Dems to reach an agreement on further stimulus, with hopes dwindling that an agreement can be struck before the elections. Of course, as history has shown, much gamesmanship is involved, so a compromise is always within reach.
More market uncertainty could be in play towards the end of the month/quarter, only two weeks away. JP Morgan warned that some $200 billion of forced month-end selling could affect markets negatively:
With month and quarter-end just two weeks away, Wall Street shifts its collective attention to a recurring phenomenon, namely the quarter-end rebalancing where outsized stock buying or selling can lead to short-term market havoc. The reason is that in quarters in which stocks outperform bonds – as they have in Q3 – funds need to rebalance by selling stocks to remain in compliance with their position mandates (vice versa in quarters when bonds outperform stocks).
From my point of view, we will be in for more choppiness in the markets, as this quarter winds down and, if JP Morgan is correct, the usual quarter-ending window dressing (bullish) might turn into abrupt equity market moves (bearish).
Should these moves be modest, we will not be affected, but should they turn out to be more of an extreme nature, our exit strategy will kick in. Given that, having reduced our exposure to some of the more volatile sectors of the market, will help us to better weather this potential storm.
2. ETFs in the Spotlight
In case you missed the announcement and description of this section, you can read it here again.
It features some of the 10 broadly diversified domestic and sector ETFs from my HighVolume list as posted every Saturday. Furthermore, they are screened for the lowest MaxDD% number meaning they have been showing better resistance to temporary sell offs than all others over the past year.
The below table simply demonstrates the magnitude with which these ETFs are fluctuating above or below their respective individual trend lines (%+/-M/A). A break below, represented by a negative number, shows weakness, while a break above, represented by a positive percentage, shows strength.
For hundreds of ETF choices, be sure to reference Thursday’s StatSheet.
For this current domestic “Buy” cycle, here’s how some our candidates have fared:

Click image to enlarge
Again, the %+/-M/A column above shows the position of the various ETFs in relation to their respective long-term trend lines, while the trailing sell stops are being tracked in the “Off High” column. The “Action” column will signal a “Sell” once the -8% point has been taken out in the “Off High” column. For more volatile sector ETFs, the trigger point is -10%.
3. Trend Tracking Indexes (TTIs)
Our TTIs improved despite the major indexes sliding.
This is how we closed 09/16/2020:
Domestic TTI: +8.14% above its M/A (prior close +7.42%)—Buy signal effective 07/22/2020
International TTI: +6.38% above its M/A (prior close +6.22%)—Buy signal effective 07/22/2020
Disclosure: I am obliged to inform you that I, as well as my advisory clients, own some of the ETFs listed in the above table. Furthermore, they do not represent a specific investment recommendation for you, they merely show which ETFs from the universe I track are falling within the specified guidelines.
Contact Ulli