The Day After: Recovering From The Selloff

Ulli Market Commentary Contact

[Chart courtesy of MarketWatch.com]

  1. Moving the markets

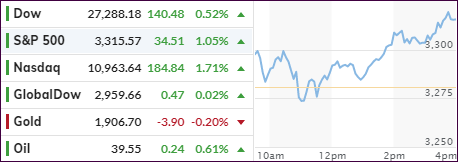
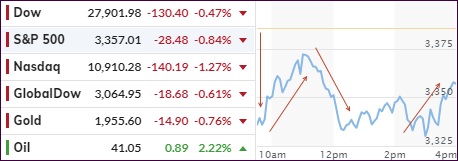
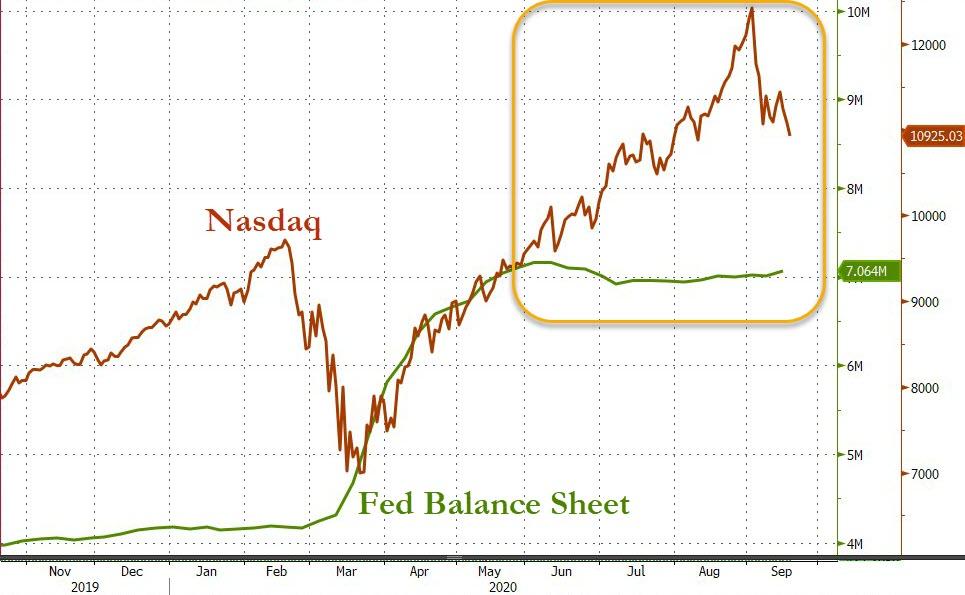
Despite staggering around their respective unchanged lines for most of the session, a mid-day burst propelled the major indexes solidly into the green with the Nasdaq leading the charge.

The S&P 500 snapped a 4-day losing streak supported by soothing words from the Fed:

Traders also digested remarks by Federal Reserve Chairman Jerome Powell, who reiterated the central bank will support the economy “for as long as it takes.” Powell added that, while the path forward “continues to be highly uncertain,” economic activity has “picked up.”

However, the jury is still out as to whether this is the beginning of the end of the selloff,” as Jim Cramer calls it, or is there more wisdom in the words of billionaire Barry Diller that it’s time to raise some cash?”

While nobody knows for sure, in these times of great uncertainty, I am personally more in alignment with Barry. After all, the downside risk can be huge, but on the upside, you merely give up a few percentage points by re-entering at a later but much safer time frame.

Others seem to agree:

“Some money is being taken off the table pre-election, and as we approach elections in the next six weeks I think there will be more of this happening,” Saed Abukarsh, senior executive officer at Ark Capital Management Dubai Ltd., told Bloomberg Television. “We’re now consolidating into a lower range in the S&P.”

Of course, the coronavirus and its potential vaccines, the SCOTUS nomination and uncertainty around the election continue to be headlines which, depending on any outcomes, could swing markets in either direction.

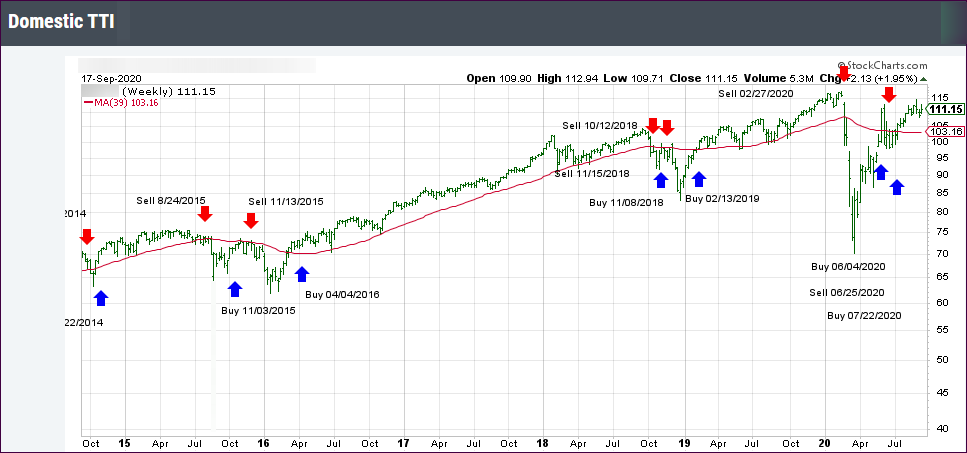
Technically speaking, all the major indexes remain stuck below their respective 50-day M/As but were helped into the green by another short-squeeze, the best tool available to rescue a sinking ship. Today was no exception, as Bloomberg’s chart shows.

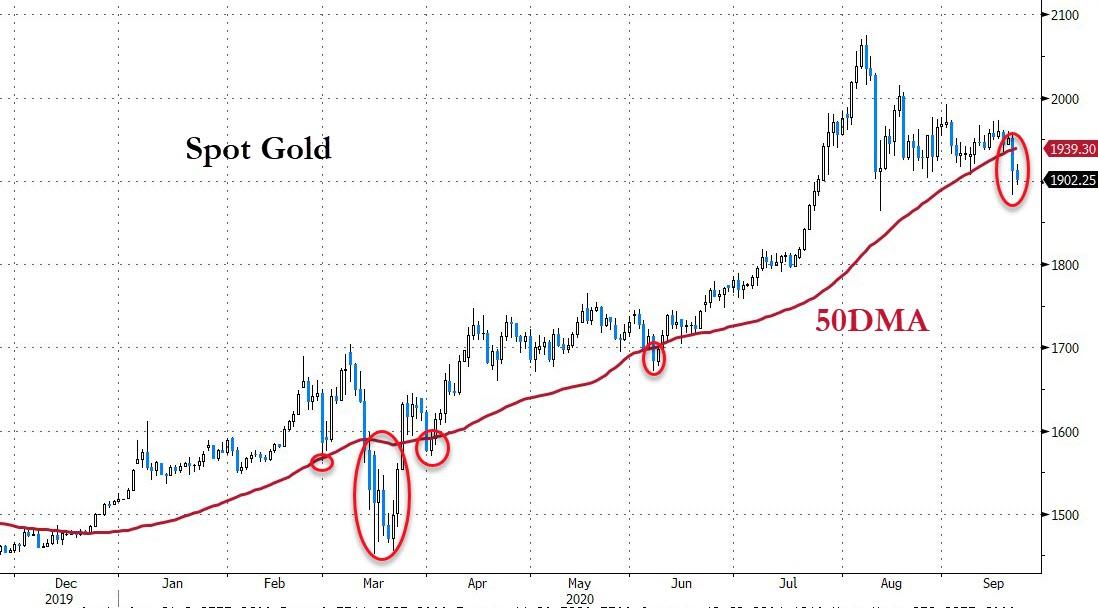
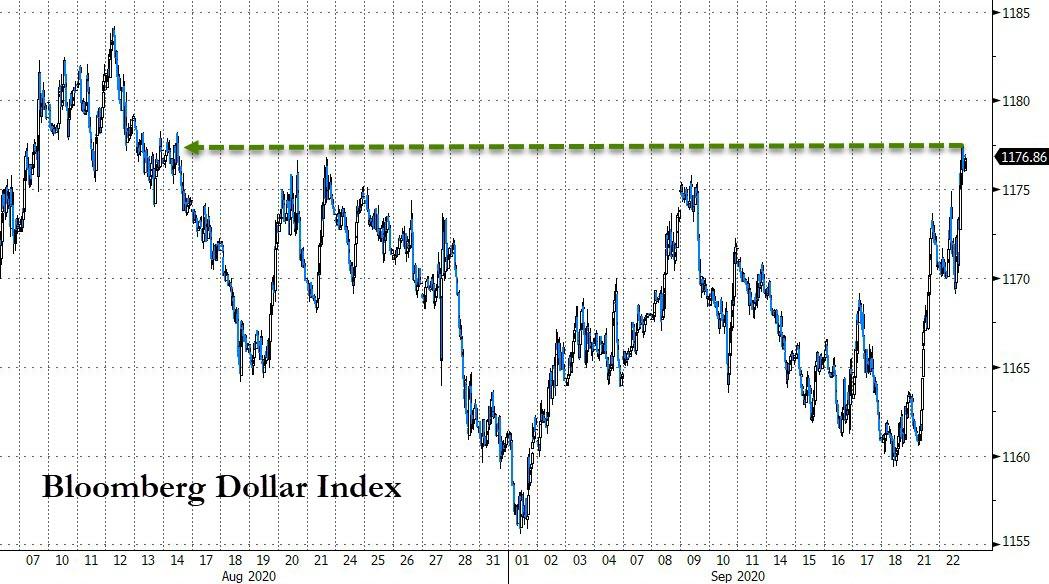
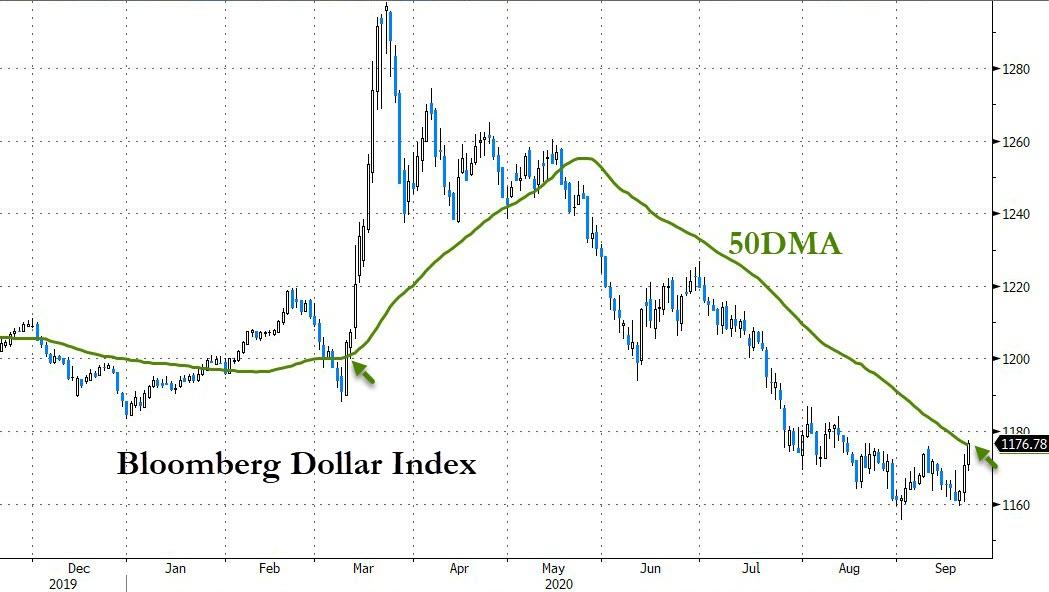
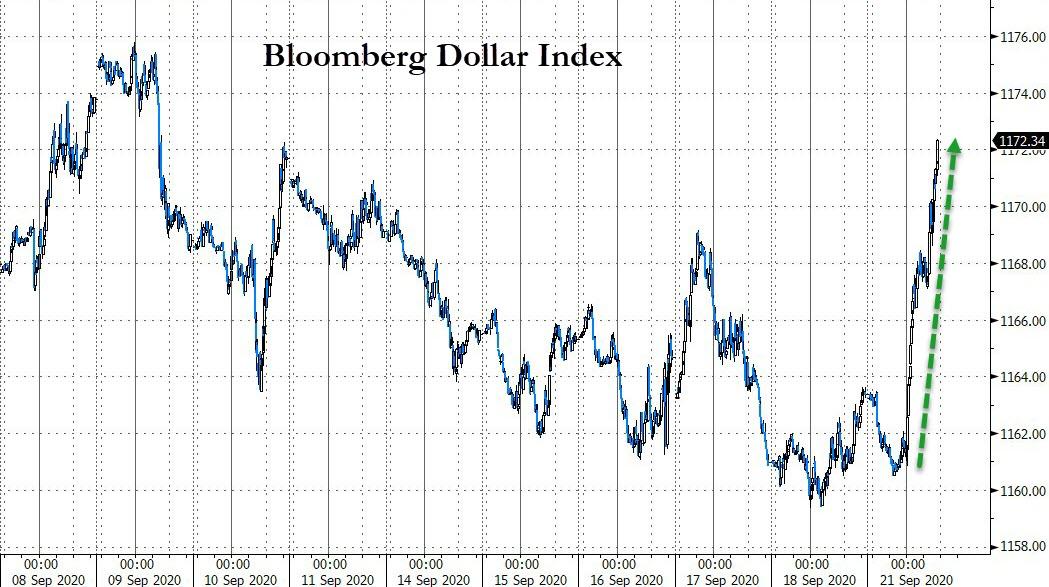
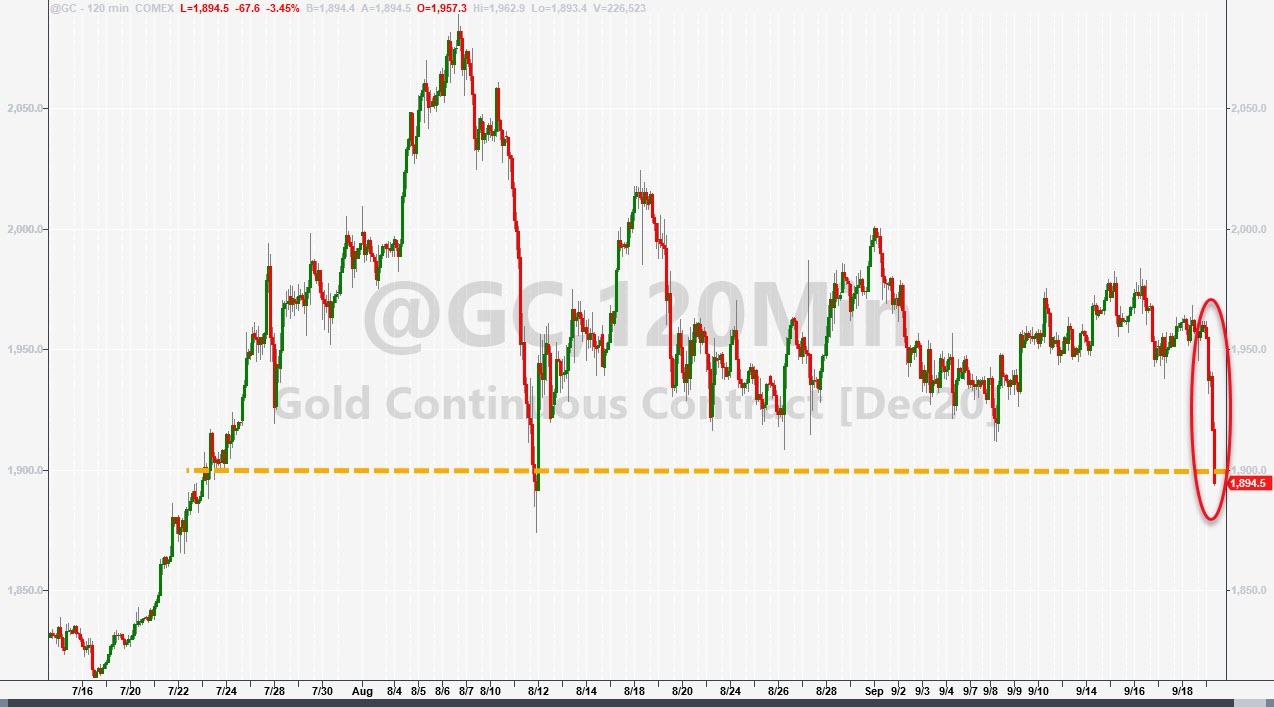
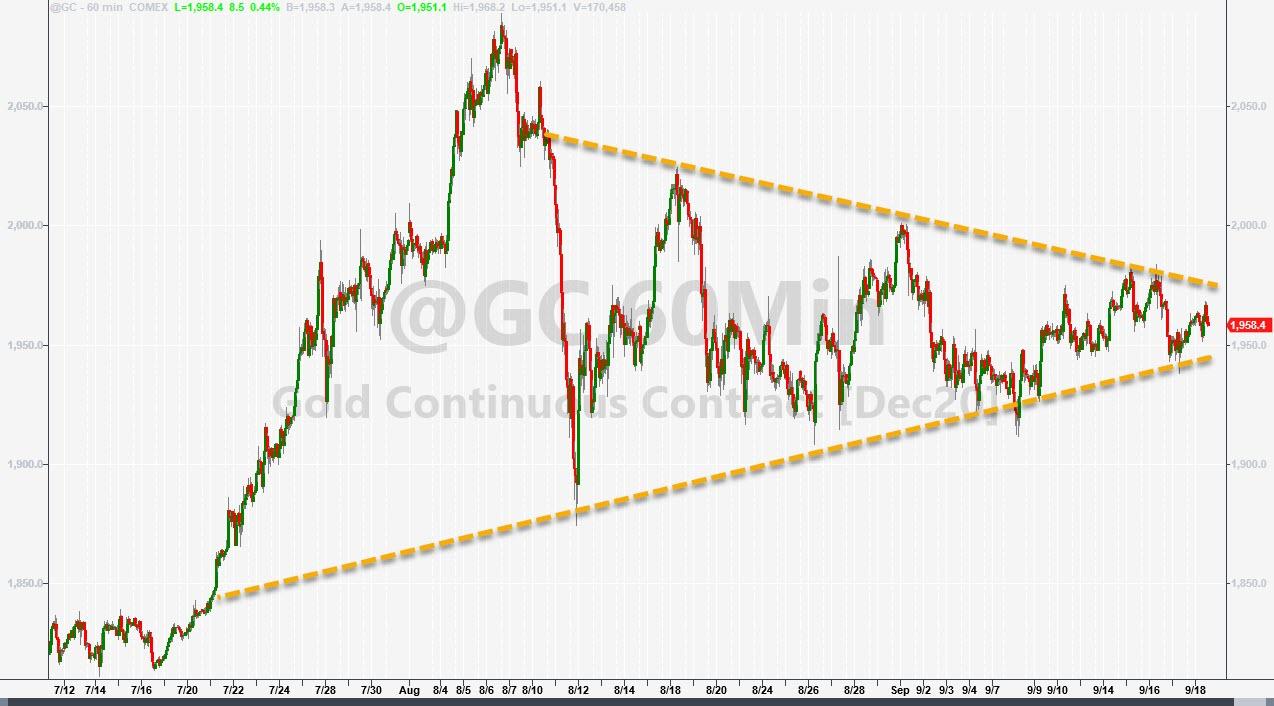
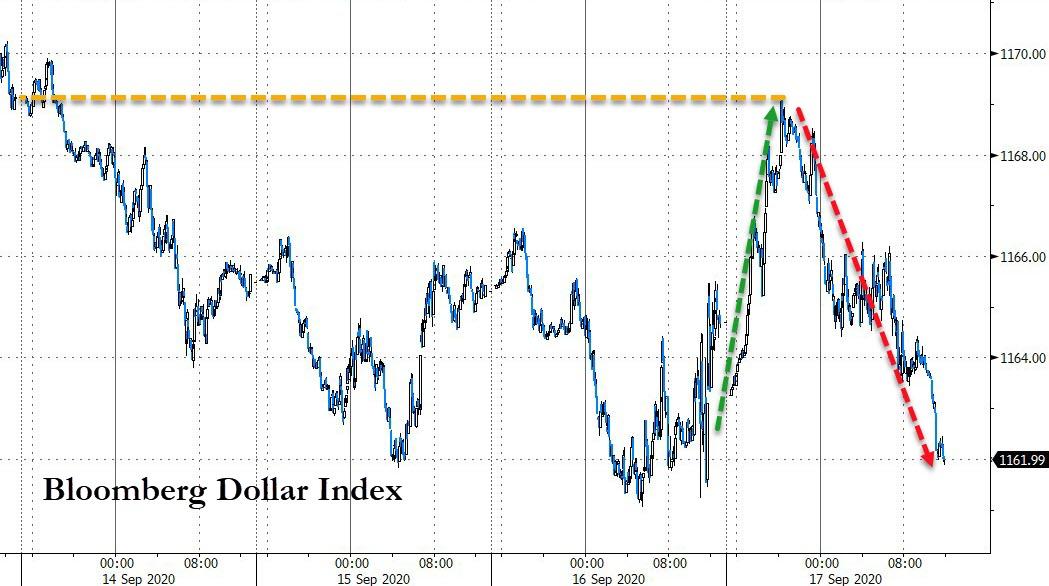
Not helping Gold was the US dollar, which not only ripped higher after yesterday’s bounce but also managed to break its 50-day M/A to the upside.  

Read More

Markets Dump—No Place To Hide

Ulli Market Commentary Contact

[Chart courtesy of MarketWatch.com]

  1. Moving the markets

As the futures last night indicated, today would be a downer for the markets, and that’s exactly how it turned out. The Dow was down over 900 points mid-day but recovered to “only” close in the red by some -500 points.

The other two major indexes slumped in similar fashion but recouped better in the end, with especially the Nasdaq almost reaching its unchanged line. Still, one of our holdings clearly pierced its trailing sell stop and was sold.

Of course, the question is: “Is the tech melt over, or has it just started?” No one has the answer, so we have prudently followed our sell stop discipline and took some money of the table, the process of which started almost 3 weeks ago.

The culprits for today’s dump were the same ones as last week, with fears being stoked about the coronavirus’ resurgence across Europe, while at the same time the lack of progress of any stimulus programs rattled the markets. Of course, no doubt, the passing of Bader Ginsburg added a whole new dimension to the word “uncertainty.”

CNBC added some color:

In Washington, negotiations for a new coronavirus stimulus bill could become more complicated after the passing of Supreme Court Justice Ruth Bader Ginsburg, which could lead to a bitter nomination process ahead of the election. President Donald Trump said he would nominate someone this week to take Ginsburg’s seat. Republicans and Democrats have been in a stalemate since July after provisions from the previous stimulus bill expired.

Regarding the markets, there was no place to hide with the Dollar surging, which sent gold reeling, while stocks and bond yields tumbled.

It remains to be seen how much more downside momentum lies ahead of us, or of this will be close to the bottom. Does not matter, as in these uncertain times, I think it’s wise to be a little cautious, rather than reckless, when it comes to market exposure.

Read More

ETFs On The Cutline – Updated Through 09/18/2020

Ulli ETFs on the Cutline Contact

Below, please find the latest High-Volume ETF Cutline report, which shows how far above or below their respective long-term trend lines (39-week SMA) my currently tracked ETFs are positioned.

This report covers the HV ETF Master List from Thursday’s StatSheet and includes 312 High Volume ETFs, defined as those with an average daily volume of more than $5 million, of which currently 244 (last week 234) are hovering in bullish territory. The yellow line separates those ETFs that are positioned above their trend line (%M/A) from those that have dropped below it.

Take a look:                                                                   

The HV ETF Master Cutline Report

In case you are not familiar with some of the terminology used in the reports, please read the Glossary of Terms. If you missed the original post about the Cutline approach, you can read it here.      

ETF Tracker Newsletter For September 18, 2020

Ulli ETF Tracker Contact

ETF Tracker StatSheet          

You can view the latest version here.

STUMBLING INTO THE WEEKEND

[Chart courtesy of MarketWatch.com]

  1. Moving the markets

Sloppy and choppy best describes the swan dives the major indexes did today, as the S&P 500 gave up gains made early in the week and closed with a modest loss of some -0.66%.

A last hour bounce back, however, helped the major indexes trim their losses.  

As I pointed out yesterday, today being a quadruple witching expirations session contributed much to the volatility and caused one of our holdings to bounce against its trailing sell stop. Depending on the follow up action next Monday, this position may be liquidated.

In the end, equities are down for the 3rd week in a row with the Dow now having lost 3% YTD, while the S&P 500 is up just over 2% YTD.

Some point to the Fed’s balance sheet as the dominator for tech advances or tech declines, which Bloomberg’s chart makes abundantly clear. The implication is obvious. Either the Fed continues its balance sheet expansion, or the Nasdaq will continue with its best imitation of a swan dive.

Gold saved the day by closing in the green, but while the precious metal is stuck in a triangle pattern, it sure looks that a breakout is about to happen in the near future.

Contributing to the overall market weakness was the stimulus battle with the Dems sticking to their demand of at least $2.2 trillion for the next corona relief bill, while the White House showed willingness to settle at the $1.5 trillion level.

Noted analyst Charlie McElliott:

“In short, while a stimulus bill may be delayed – at least until the election – it is only a matter of time before it passes, with the final bill likely to be far greater than the $2.2 trillion some have tentatively priced in.”

While that maybe so, a delay could have more of an economic impact than anticipated, as in people running short of money, which in turn will dampen econ forecasts and subsequently affect markets negatively.

Read More

Weekly StatSheet For The ETF Tracker Newsletter – Updated Through 09/17/2020

Ulli ETF StatSheet Contact

ETF Data updated through Thursday, September 17, 2020

Methodology/Use of this StatSheet:

1. From the universe of over 1,800 ETFs, I have selected only those with a trading volume of over $5 million per day (HV ETFs), so that liquidity and a small bid/ask spread are assured.

2. Trend Tracking Indexes (TTIs)

Buy or Sell decisions for Domestic and International ETFs (section 1 and 2), are made based on the respective TTI and its position either above or below its long-term M/A (Moving Average). A crossing of the trend line from below accompanied by some staying power above constitutes a “Buy” signal. Conversely, a clear break below the line constitutes a “Sell” signal. Additionally, I use a 7.5% trailing stop loss on all positions in these categories to control downside risk.

3. All other investment arenas do not have a TTI and should be traded based on  the position of the individual ETF relative to its own respective trend line (%M/A). That’s why those signals are referred to as a “Selective Buy.” In other words, if an ETF crosses its own trendline to the upside, a “Buy” signal is generated. Since these areas tend to be more volatile, I recommend a wider trailing sell stop of 7.5% -10% depending on your risk tolerance.

If you are unfamiliar with some of the terminology, please see Glossary of Terms and new subscriber information in section 9.     

1. DOMESTIC EQUITY ETFs: BUY — since 07/22/2020

Click on chart to enlarge

Our main directional indicator, the Domestic Trend Tracking Index (TTI-green line in the above chart) has now rallied above its long-term trend line (red) by +7.67% and remains in “BUY” mode as posted.

Read More

The Roller Coaster Ride Accelerates

Ulli Market Commentary Contact

[Chart courtesy of MarketWatch.com]

  1. Moving the markets

Yesterday, I pointed towards more choppiness in the markets and, as if on command, we witnessed a wild roller coaster ride today. It started with a huge dump, followed by a pump to the unchanged line, which was followed by another dump and a failed last-ditch effort to get to green.

The futures market caused some of that havoc with tech stumbling after Powell’s message that “more fiscal support is likely to be needed,” which caused concerns that the Fed’s monetary toolbox may be running empty. That thought spooked equities, and the sour mood prevailed throughout the session. As a result, traders dumped stocks, bonds, dollars and gold.

Not helping matters was the impact of inconsistent messages about the coronavirus vaccine battles and the continued battles about further stimulus.

On the economic front, we learned that another 860k Americans filed for first time jobless benefits last week, which is still more than four times the pre-Covid ‘normal’ and well above any peak week during the great financial crisis collapse, as ZH reported. And this is 7 months after the lockdowns began!

Tomorrow, traders will have to deal with quadruple witching hour, which most likely will add a load of volatility.

To add insult to injury, the analog to 1930 appears to be more than coincidental when looking at the big picture.

Read More