Rebounding With A Bang

Ulli Market Commentary Contact

[Chart courtesy of MarketWatch.com]

  1. Moving the markets

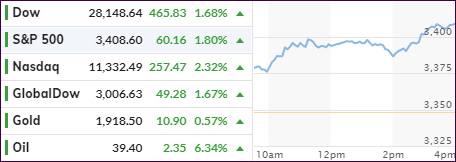
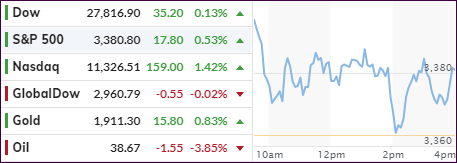
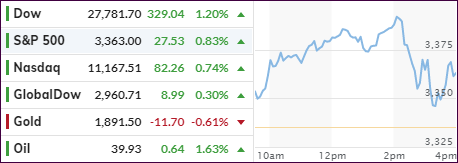
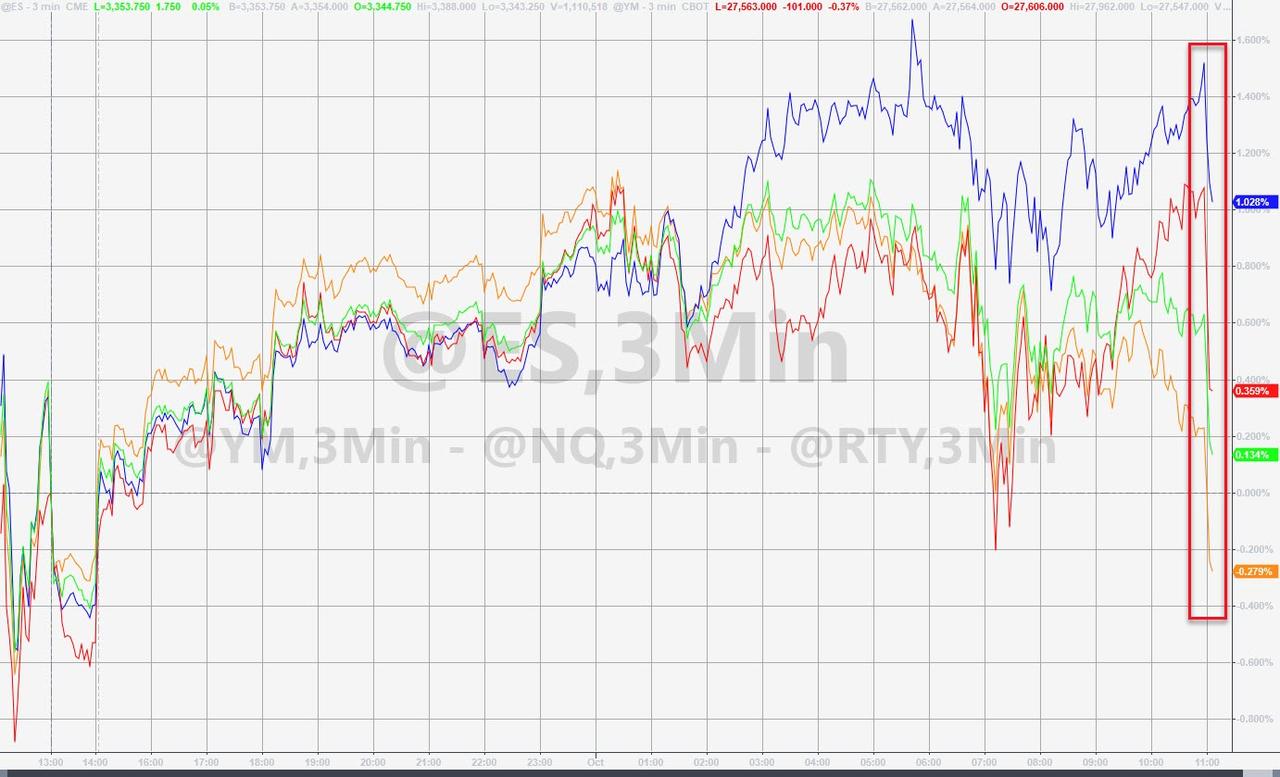
After the markets ended last week with a whimper, there was none of that left today, as the major indexes jumped out of the gate, never looked back, and shifted into overdrive during the last hour.

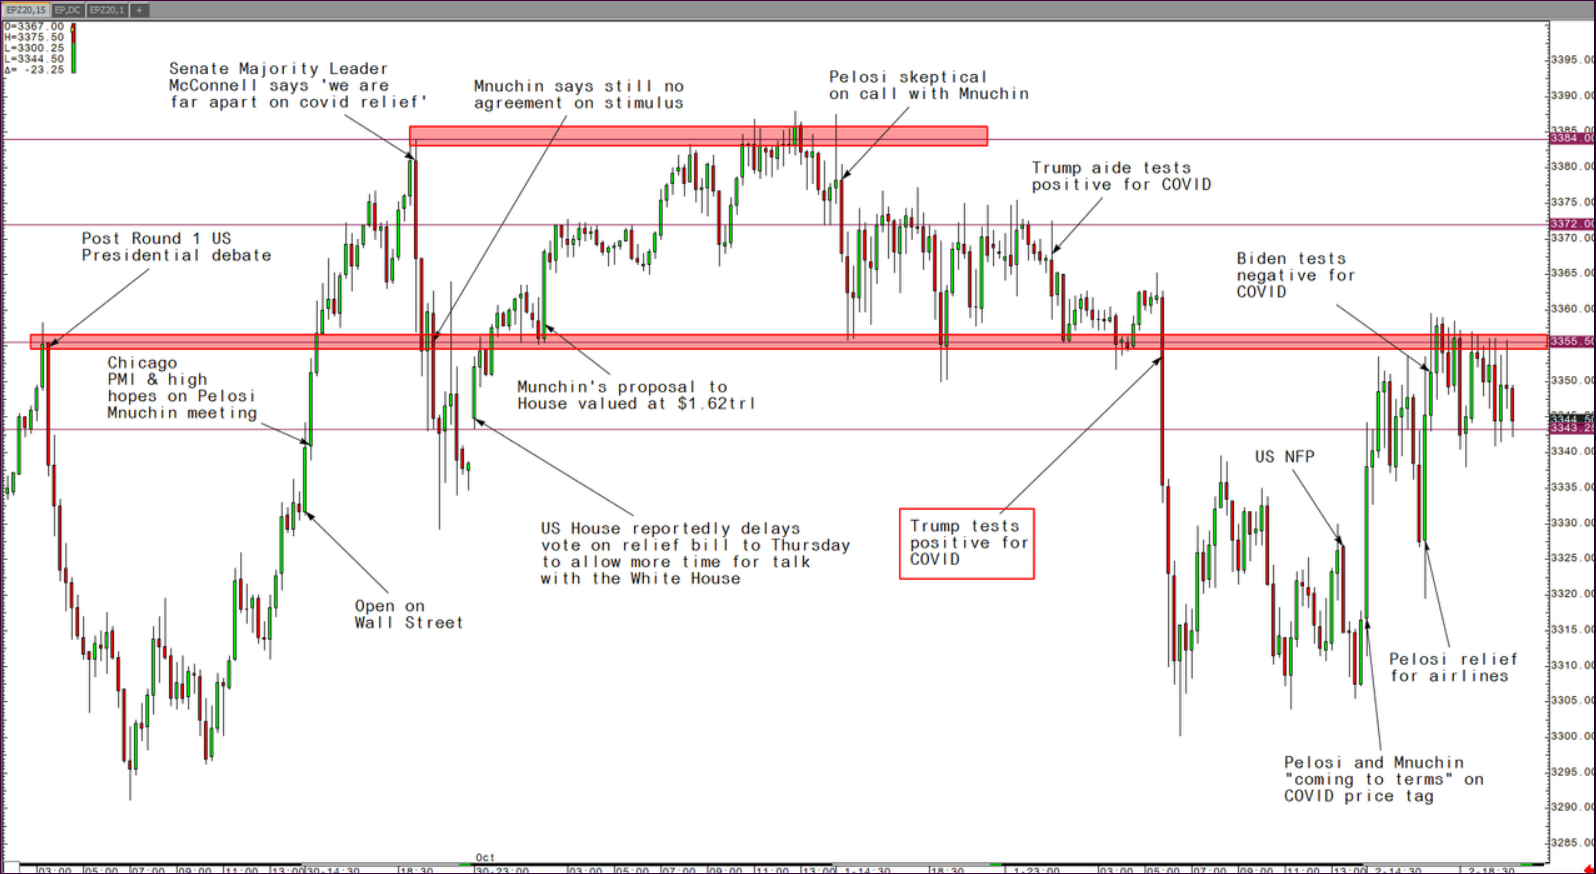
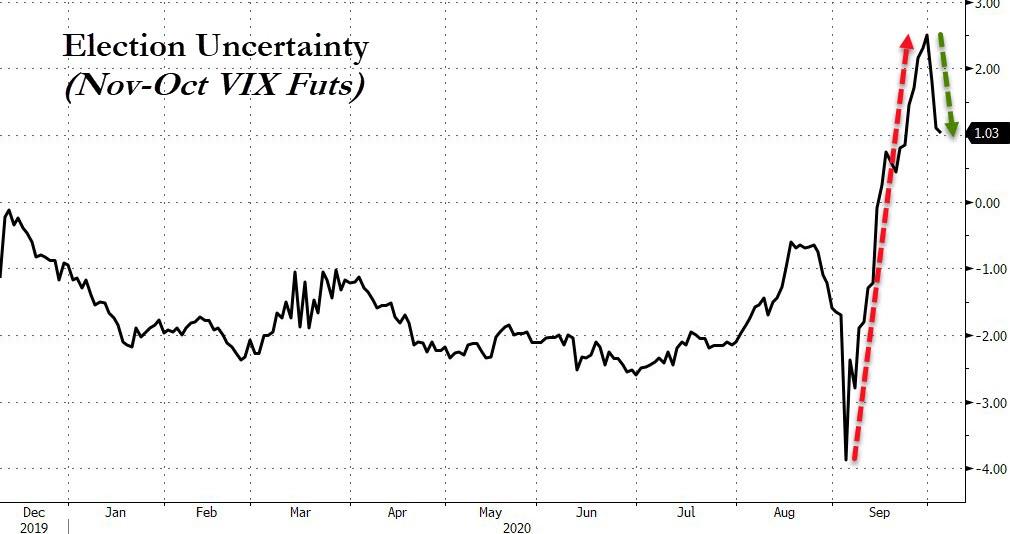
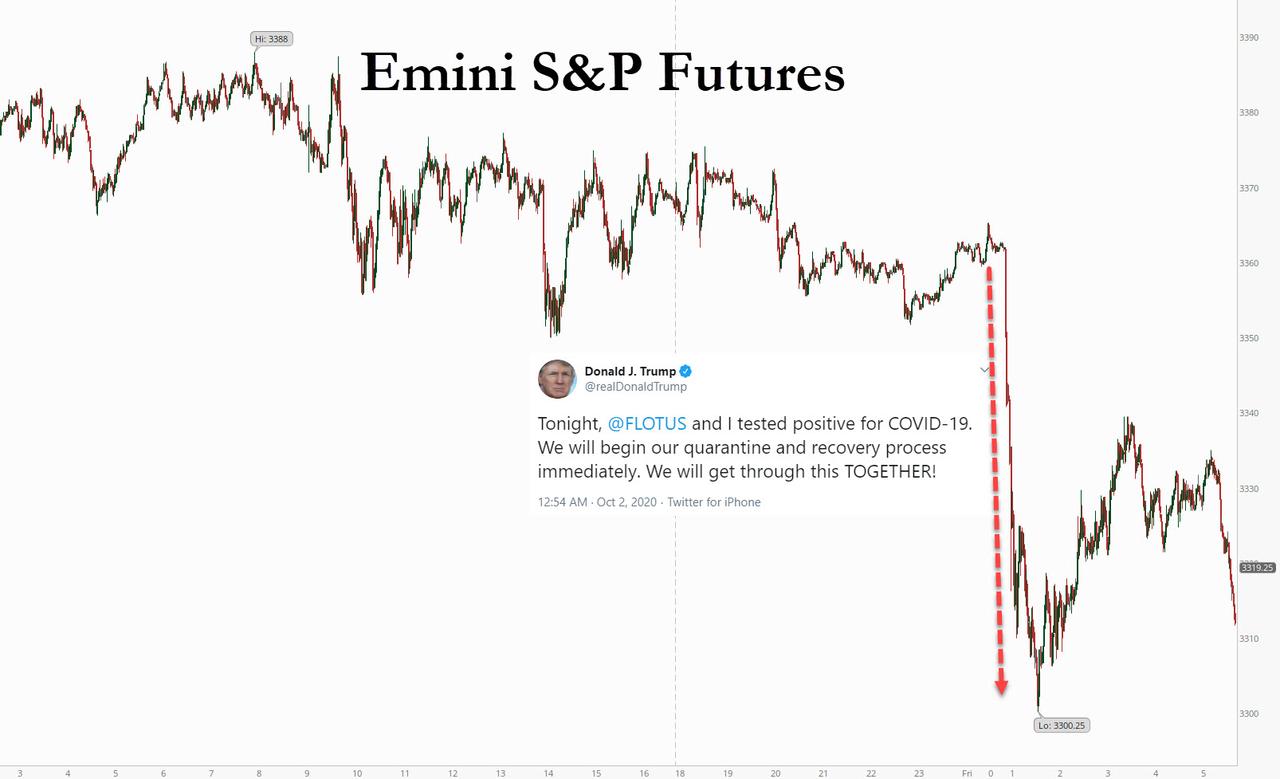
The result was a solid and broad advance supported by various news headlines. One was the announcement that President Trump would be released from the hospital tonight, which eased concerns about election worries.

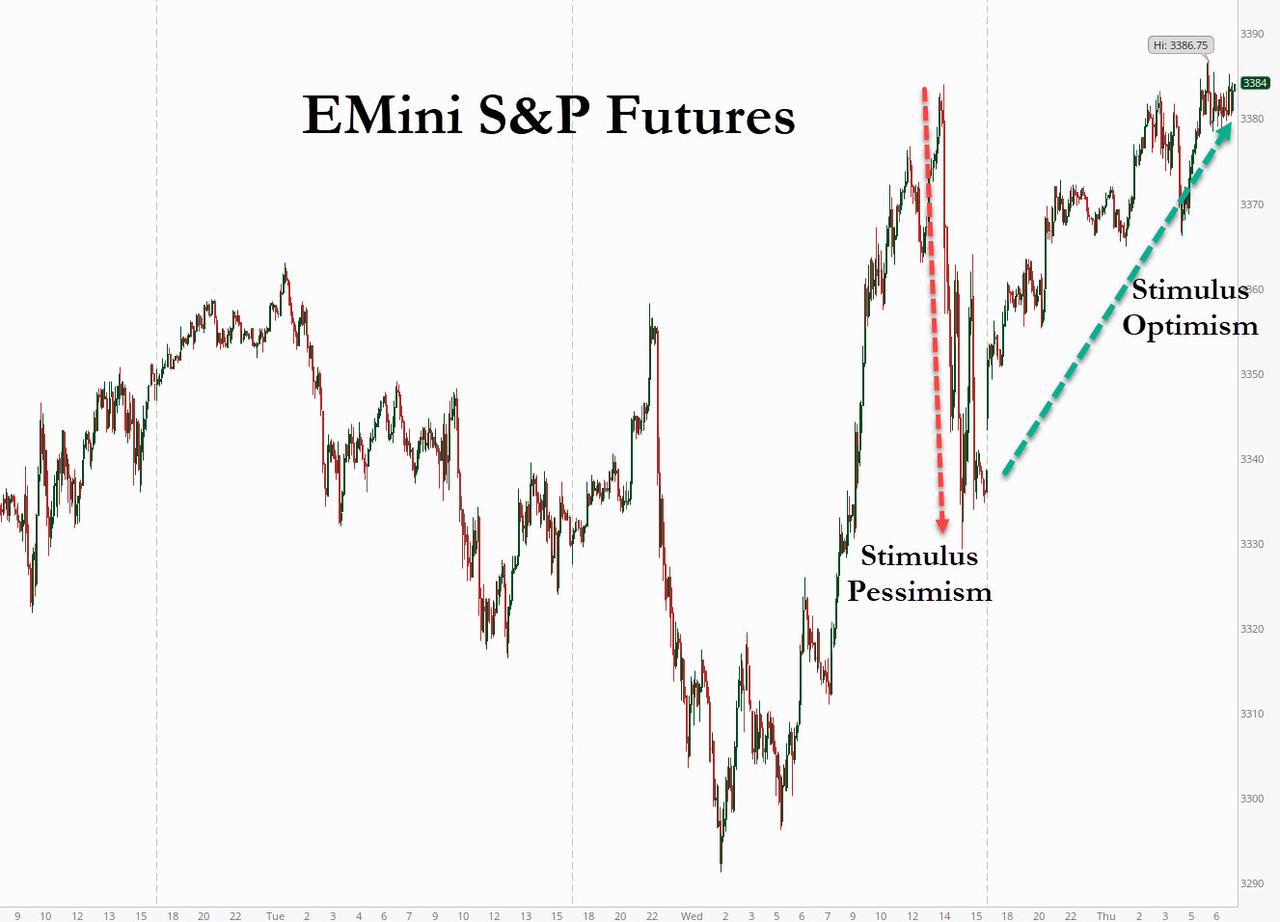
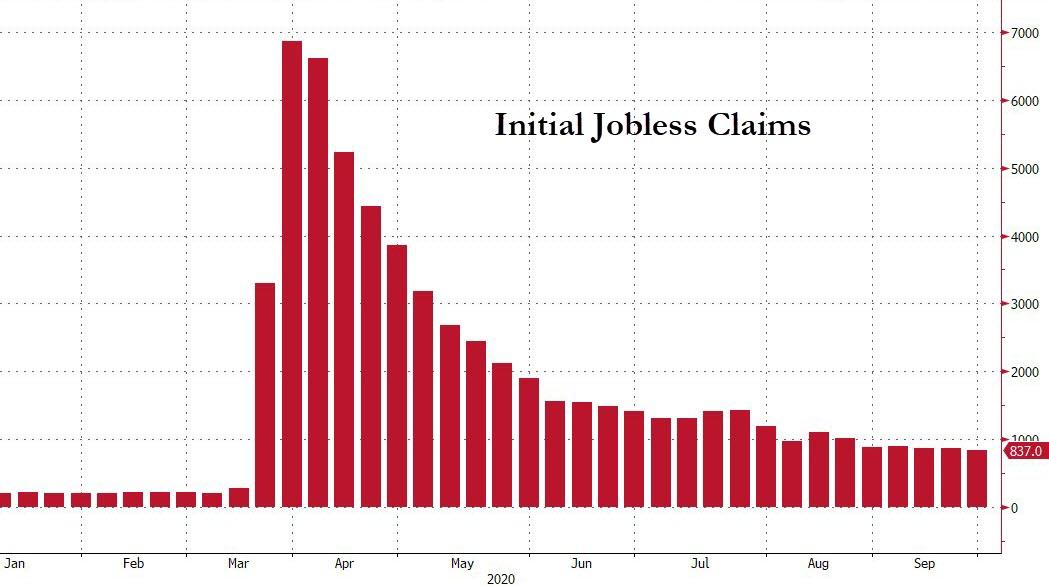
The other came from the on-off stimulus negotiations with traders growing hopeful that lawmakers can reach a compromise deal—soon. The importance of that was highlighted by Friday’s jobs report, which showed decent numbers but well below expectations.

House Speaker Nancy Pelosi and Treasury Secretary Steven Mnuchin held an hourlong phone call Monday and discussed “the justifications for various numbers” and “plan to exchange paper” in preparation for further discussions on Tuesday, Pelosi’s chief of staff said.

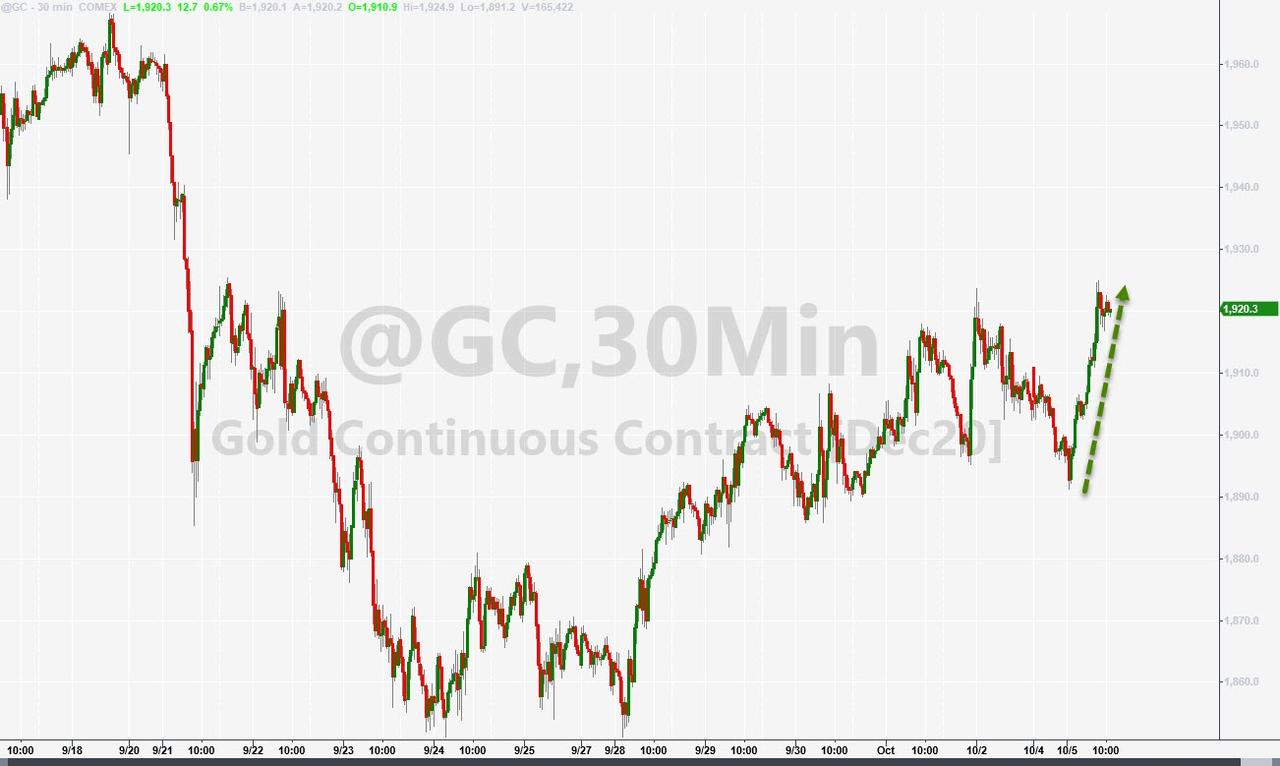
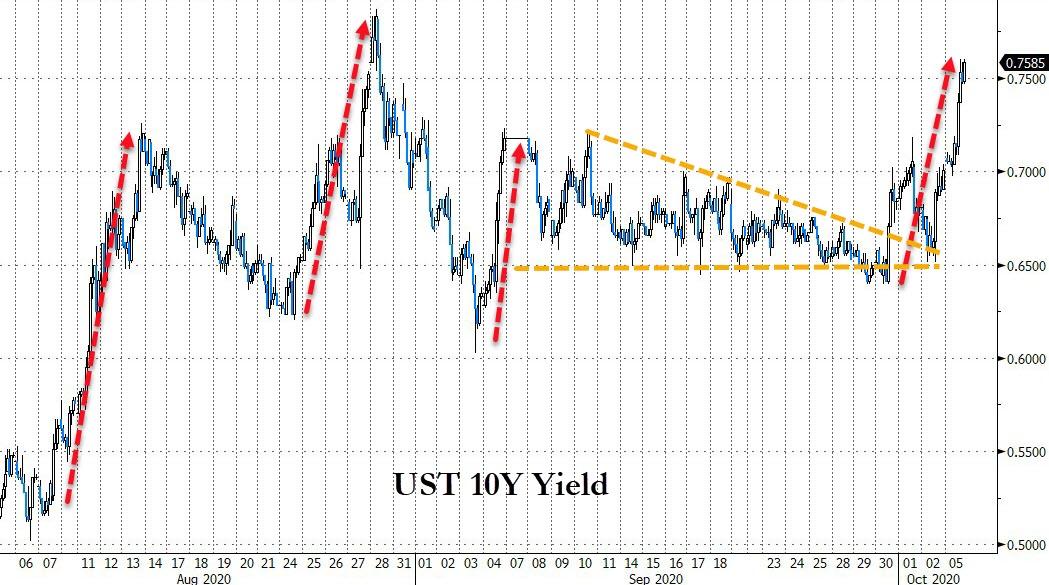
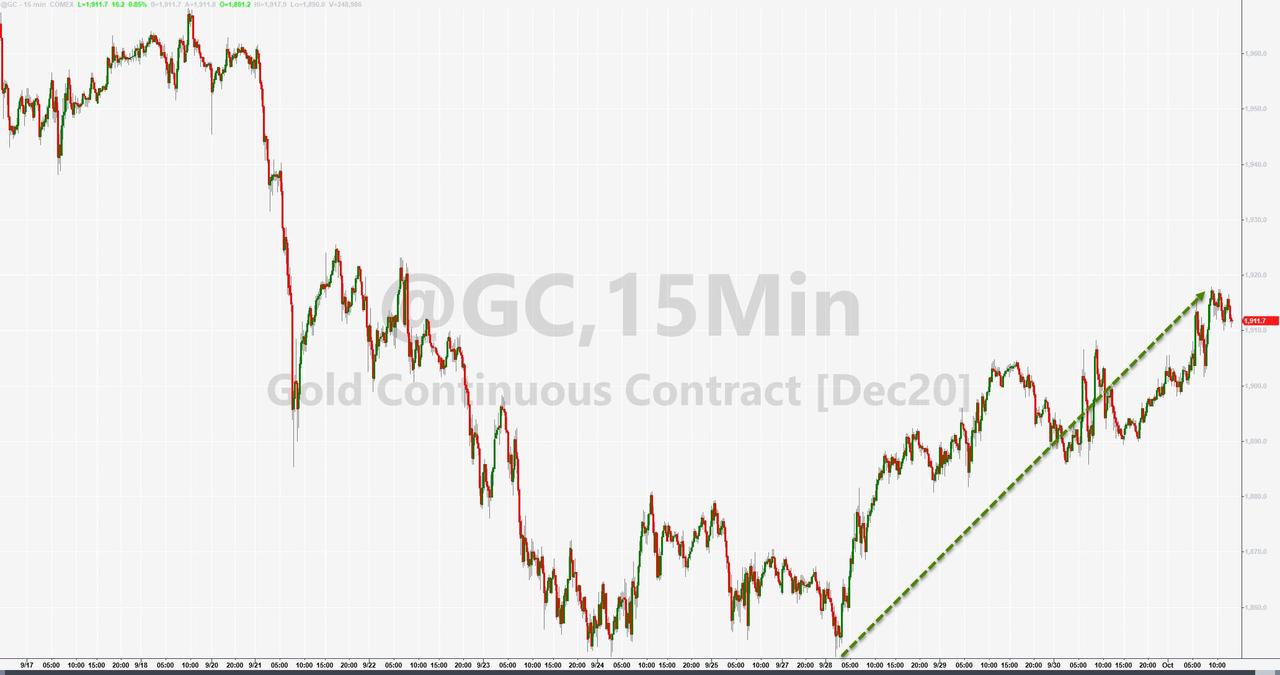
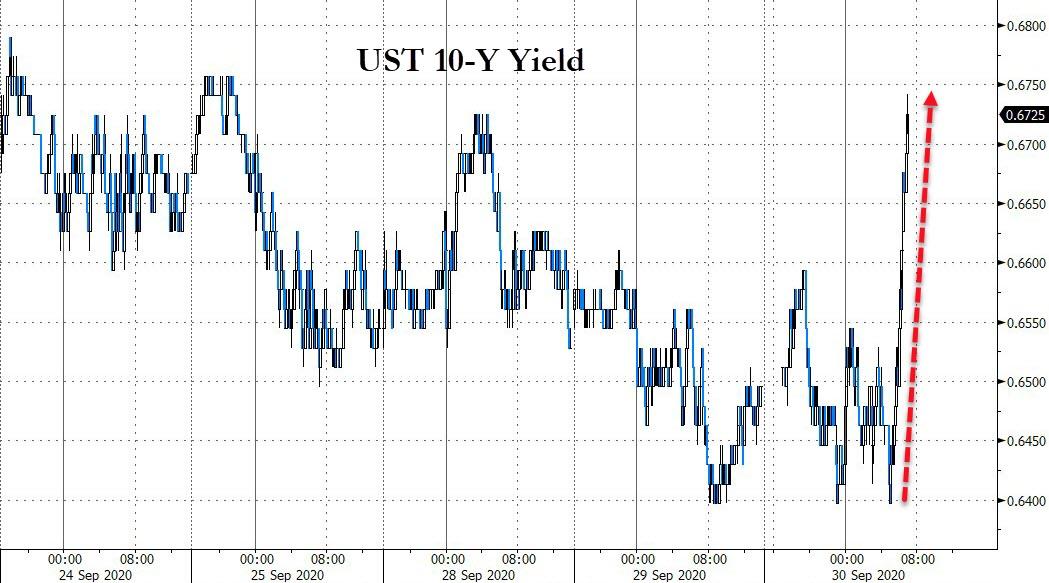
At least for today, election uncertainty took a backseat, as not only stocks jumped but gold as well, while the dollar tanked along with bonds, due to rising yields.

This week looks to be a quiet one, besides the VP debate on Wednesday night, but there will be FED and ECB meetings and subsequent announcements, any of which could be market moving events.

Read More

ETFs On The Cutline – Updated Through 10/02/2020

Ulli ETFs on the Cutline Contact

Below, please find the latest High-Volume ETF Cutline report, which shows how far above or below their respective long-term trend lines (39-week SMA) my currently tracked ETFs are positioned.

This report covers the HV ETF Master List from Thursday’s StatSheet and includes 312 High Volume ETFs, defined as those with an average daily volume of more than $5 million, of which currently 244 (last week 244) are hovering in bullish territory. The yellow line separates those ETFs that are positioned above their trend line (%M/A) from those that have dropped below it.

Take a look:                                                                   

The HV ETF Master Cutline Report

In case you are not familiar with some of the terminology used in the reports, please read the Glossary of Terms. If you missed the original post about the Cutline approach, you can read it here.      

ETF Tracker Newsletter For October 2, 2020

Ulli ETF Tracker Contact

ETF Tracker StatSheet          

You can view the latest version here.

STAGGERING INTO THE WEEKEND

[Chart courtesy of MarketWatch.com]

  1. Moving the markets

Traders woke up this morning to a real October shock, namely that President Trump and his wife had tested positive for Covid-19, after one of his senior advisors, who traveled with him, had tested positive as well.

The immediate reaction in the futures market was negative, but a rebound ensued as Europe opened.

“We’re just a month to the election so this news does throw the election campaign into a disarray for the Republican Party,” said Jingyi Pan, market strategist at IG Asia. “Even though Joe Biden is seen as the friendlier choice for Asia and a Trump absence could in some way or another keep that status quo of a Biden lead, generally, a contested election would generate uncertainties across the world and would not bode well for Asia equities as well.”

Added CNBC:

Still, the president’s diagnosis added more uncertainty to the election, an event that was already weighing on the market and keeping traders on edge as they attempted to evaluate the possible outcomes. It also raised concerns about a second wave of the virus and a slower reopening.

The regular session opened in the red and ended up there, but off the lows, with a lot of bobbing and weaving in between. In the end, the S&P 500 managed to eke out a small gain for the week.

It came as no surprise that the most volatile, and best performing index, namely the Nasdaq, fared the worst by dumping -2.22% while GLD, the ETF not the spot price, surrendered a negligible -0.11%.

Not helping the sour mood on Wall Street was the fact that only 661k jobs were added, which was way below the 868k expected. The US unemployment rate unexpectedly dropped below 8%, which made for a nice headline number. However, when looking under the hood, it turns out that the biggest reason for the drop in the jobless rate was people no longer looking for work. Ouch! Concluded ZH: The true unemployment rate is likely 8.4%, unchanged from last month.

The effects of the barrage of headline news on market behavior are nicely displayed in this graph by @AWMCheung:

Looking at the big picture, the analog to 1930 remains spot on, as Bloomberg’s updated chart shows.

It seems to me that the month of October will have many more surprises in store for us.

Read More

Weekly StatSheet For The ETF Tracker Newsletter – Updated Through 10/01/2020

Ulli ETF StatSheet Contact

ETF Data updated through Thursday, October 1, 2020

Methodology/Use of this StatSheet:

1. From the universe of over 1,800 ETFs, I have selected only those with a trading volume of over $5 million per day (HV ETFs), so that liquidity and a small bid/ask spread are assured.

2. Trend Tracking Indexes (TTIs)

Buy or Sell decisions for Domestic and International ETFs (section 1 and 2), are made based on the respective TTI and its position either above or below its long-term M/A (Moving Average). A crossing of the trend line from below accompanied by some staying power above constitutes a “Buy” signal. Conversely, a clear break below the line constitutes a “Sell” signal. Additionally, I use a 7.5% trailing stop loss on all positions in these categories to control downside risk.

3. All other investment arenas do not have a TTI and should be traded based on  the position of the individual ETF relative to its own respective trend line (%M/A). That’s why those signals are referred to as a “Selective Buy.” In other words, if an ETF crosses its own trendline to the upside, a “Buy” signal is generated. Since these areas tend to be more volatile, I recommend a wider trailing sell stop of 7.5% -10% depending on your risk tolerance.

If you are unfamiliar with some of the terminology, please see Glossary of Terms and new subscriber information in section 9.     

1. DOMESTIC EQUITY ETFs: BUY — since 07/22/2020

Click on chart to enlarge

Our main directional indicator, the Domestic Trend Tracking Index (TTI-green line in the above chart) has now rallied above its long-term trend line (red) by +5.88% and remains in “BUY” mode as posted.

Read More

Early Gains Dwindle

Ulli Market Commentary Contact

[Chart courtesy of MarketWatch.com]

  1. Moving the markets

The futures market already fluctuated between stimulus pessimism and optimism causing the S&P to oscillate wildly, as this chart shows.

The regular session continued with that volatile theme when, similarly to yesterday, an early rally hit a brick wall with the indexes resembling a roller-coaster ride. The exception was the Nasdaq, which continued its northerly path without interruption, while the Dow dipped in and out of the red during the last couple of hours.

A buying surge into the close assured green numbers all around, with especially Gold sporting a nice comeback.

The sudden plunge mid-day occurred because of house stimulus headlines with Pelosi declaring the difference is ‘not dollars, but value’…

Added ZH:

AS a reminder, yesterday the House had delayed the vote by one day as a concession to the ongoing dialog between Secretary Mnuchin and Nancy Pelosi. However, the fact that the House speaker now plans to ram through the vote confirms what should have been obvious weeks ago- that no agreement has been reached and that no agreement will likely be reached until after the election.

On the economic front, the picture remains mixed at best with the US Manufacturing Survey suggesting that “The Outlook Has Darkened,” according to ZH. The filing for First-Time Jobless Benefits, while slightly improved from last week, still shows an economic environment in trouble. The fly in the ointment is that California announced a two-week pause in the processing of initial claims. Hmmm…

All these questionable numbers have not been lost on Dr. Copper, the metal which often acts as a proxy for the economy, but its latest plunge could serve notice that not all is well, and that it has a long way to fall to catch up with the reality of bonds. Hat tip goes to Bloomberg for this graph.

Read More

Ending The Quarter With A Bounce

Ulli Market Commentary Contact

[Chart courtesy of MarketWatch.com]

  1. Moving the markets

After the somewhat chaotic US presidential debate, the future markets headed lower by as much as 1%, with Asian trading being sloppy and choppy, while Europe also headed south.

None of that mattered, as renewed hopes for further coronavirus stimulus pushed the major indexes to higher levels throughout the session in addition to some encouraging economic data. Pending Home Sales soared 8.8% MoM, which was far better than the 3.1% rise expected. This sent the YoY rise in pending home sales to +20.5%, the biggest annual gain since April 2010, according to ZH. Of course, that comes as no surprise given the “tremendously low interest rates.”

ADP Employment also came in better than expectations with a 749,000 increase in jobs in September, which boosted hopes that Friday’s payroll number could come in at close to 800,000.

Today’s surge to higher levels hit a glass ceiling mid-session, when the Mnuchin-Pelosi meeting turned into a dud. Senate majority leader McConnell poured cold water on the rally by declaring that the Senate and House are “very, very far apart” on stimulus talks. He made it clear that they will not come up to the $2.2 trillion number the Democrats were demanding.

The rally hit the skids and south we went but last hour buying prevented the indexes from slipping into the red.

Gold rode the giant rollercoaster by getting pumped and dumped but ending up on the downside, as US 10-year bond yields surged. Could have been quarter-end rebalancing…

In the end, while the quarter was positive for the indexes, equities suffered their worst September since 2011. And now, we’ll be facing the notoriously volatile October—where anything can happen.

According to Bloomberg, on average, the S&P 500 has lost 2.5% in October over the past seven election years (since 1992), the worst performance of any month during that period.

Read More