The futures were again directing the way via an ecstatic “hope” move in the markets with ZH narrating it this way:
Last night, when discussing the euphoric surge in Sunday markets, we said that the move is on expectations that the “Moderna covid vaccine may hit as early as tomorrow, and a favorable outcome would have a similar result to last Monday’s Pfizer surprise which sent the S&P as high as 3,668 before fading much of the losses.”
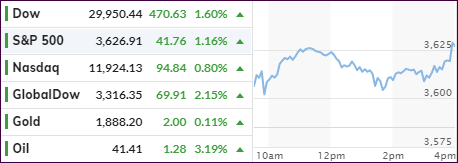
This observation was spot on, and today we saw Moderna pick up the baton handed to them by Pfizer, which pushed futures higher. The theme continued in the regular session with the major indexes heading north without looking back.
The Dow lead the way but fell short of claiming the $30k level, the S&P 500 placed 2nd and the Nasdaq lagged a little. Both, the Dow and S&P closed in record territory.
Shattering Pfizer’s effectiveness claim of 92%, Moderna upped the ante via an effective rate of 94%, so the tug-of-war will continue. However, the ever-optimistic traders see the Covid crises now as something that might be more manageable, thereby assisting future earnings and justifying elevated stock prices.
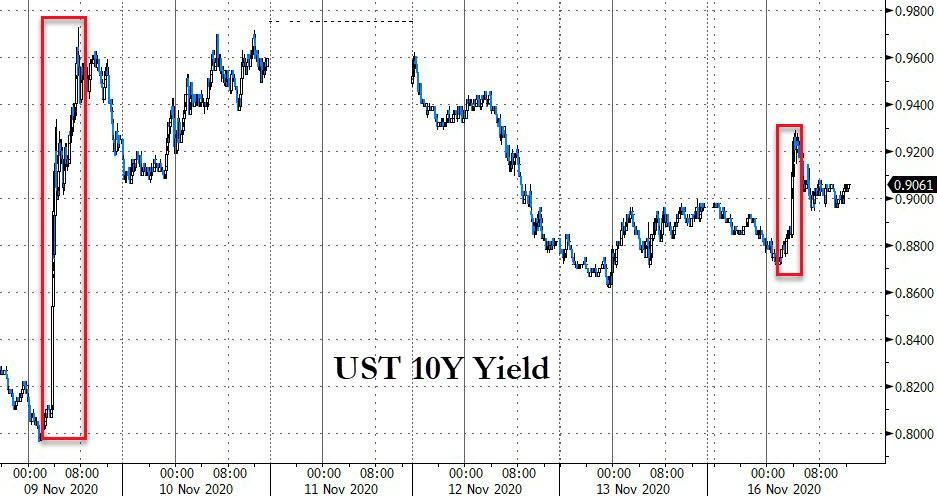
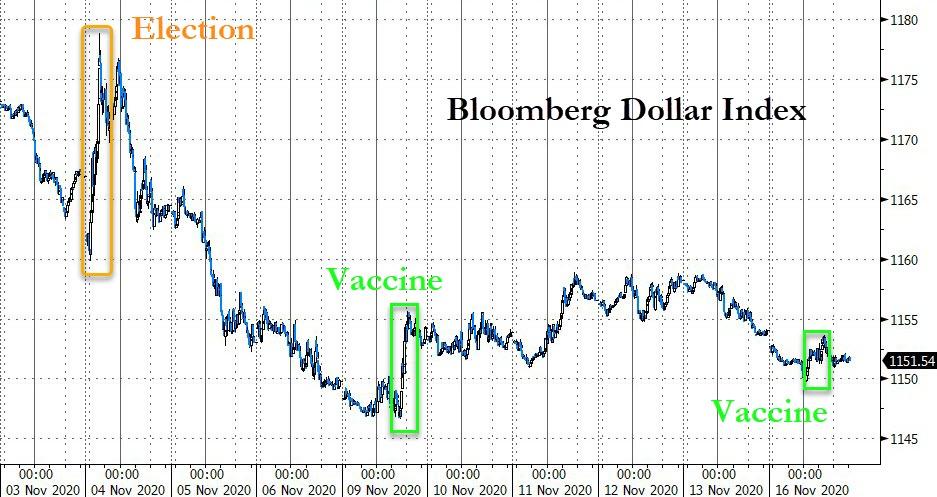
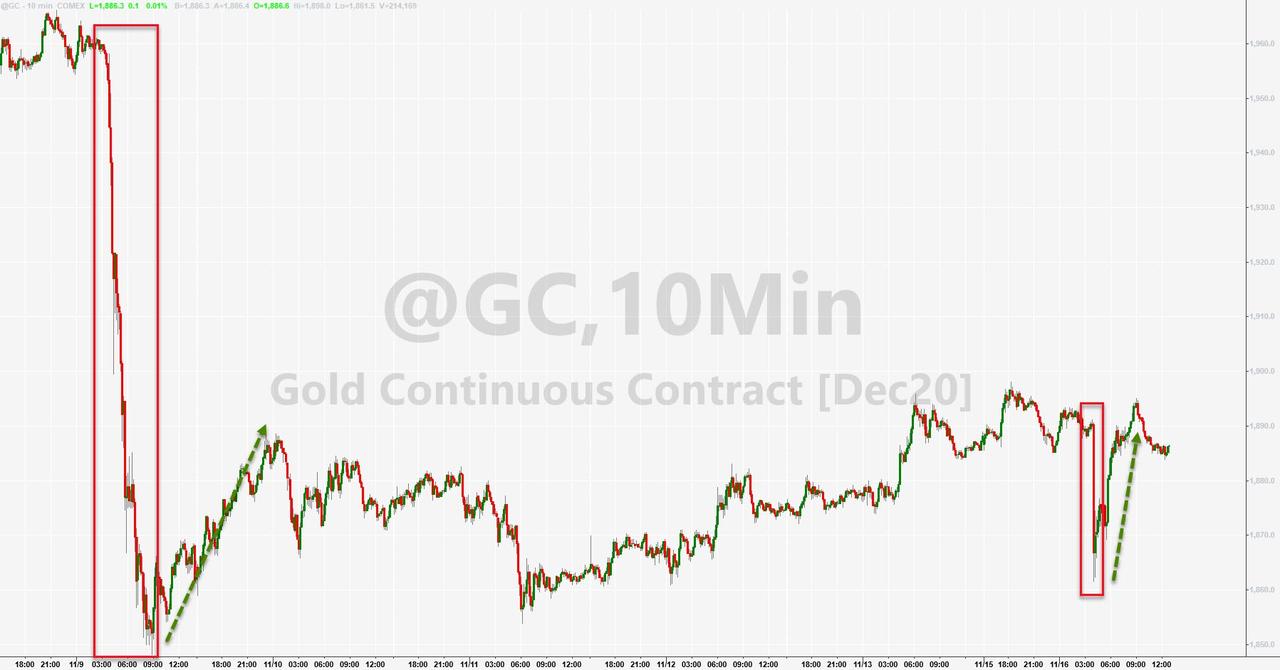
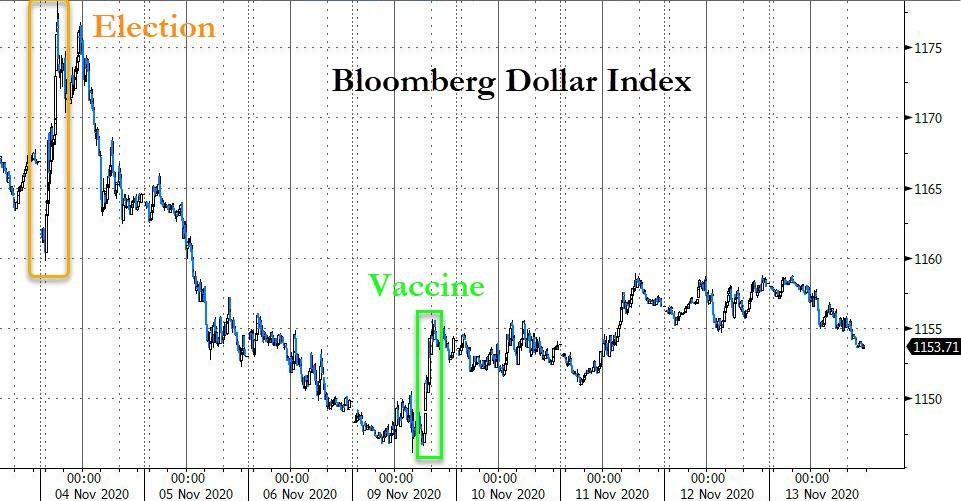
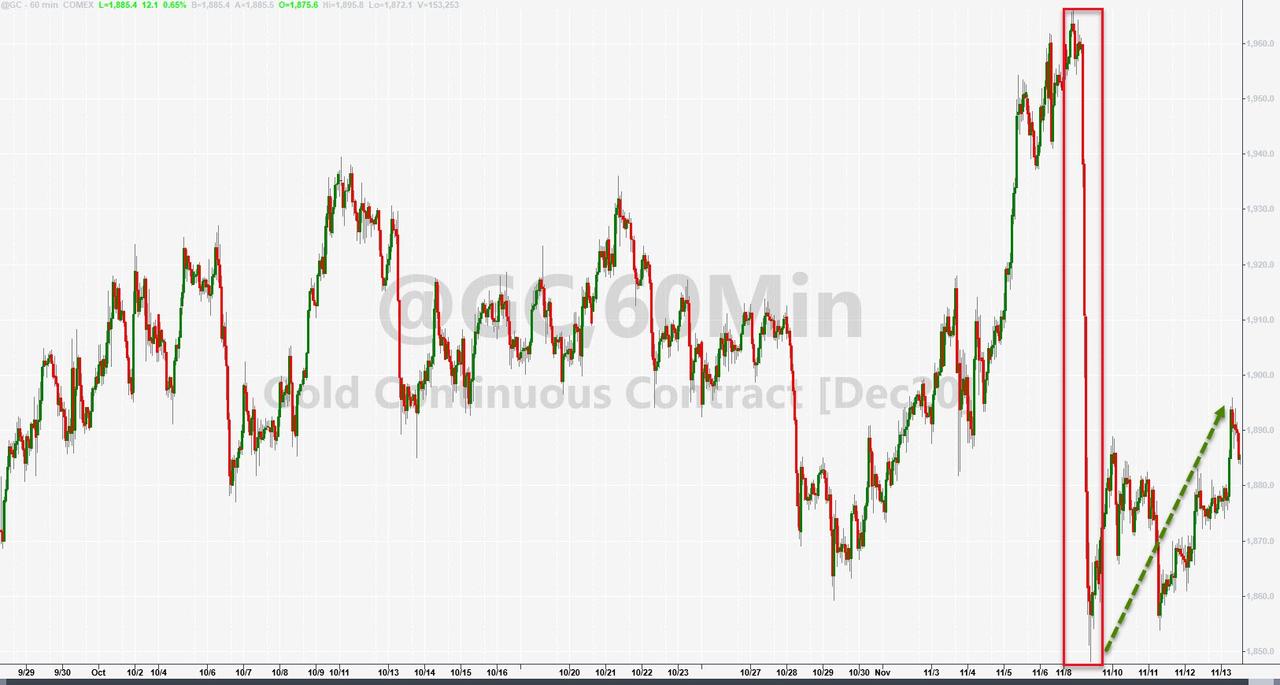
The 10-year bond yield inched higher, while the US dollar index also climbed, both of which took the steam out of an early bounce in gold.
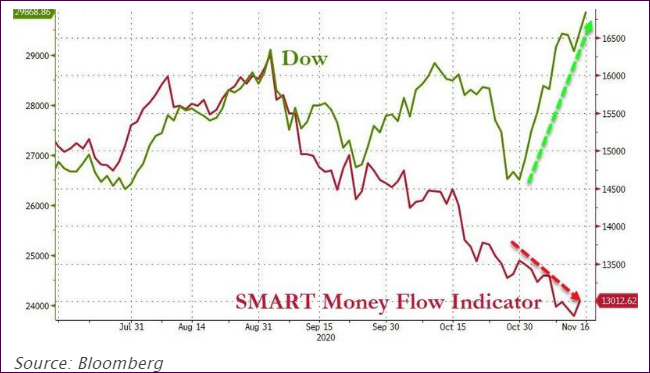
With all that enthusiasm, one group of investors, surely and quietly continue to exit the markets, namely the “Smart Money:”
It makes me wonder what these people know that traders don’t.
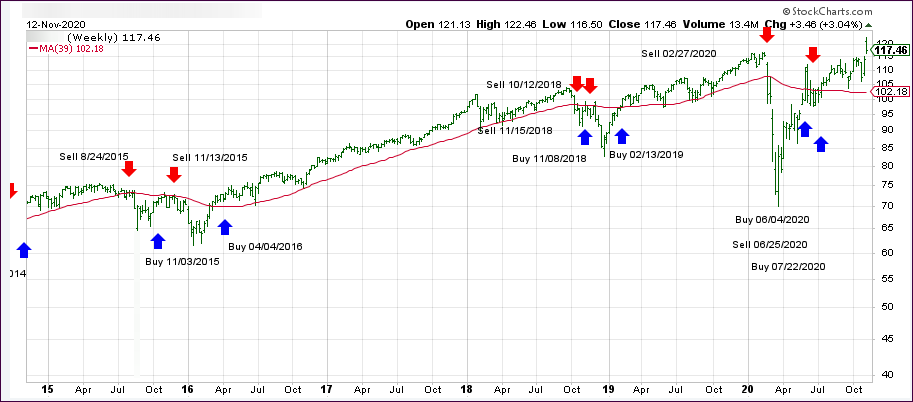
Below, please find the latest High-Volume ETF Cutline report, which shows how far above or below their respective long-term trend lines (39-week SMA) my currently tracked ETFs are positioned.
This report covers the HV ETF Master List from Thursday’s StatSheet and includes 312 High Volume ETFs, defined as those with an average daily volume of more than $5 million, of which currently 282 (last week 270) are hovering in bullish territory. The yellow line separates those ETFs that are positioned above their trend line (%M/A) from those that have dropped below it.
In case you are not familiar with some of the terminology used in the reports, please read the Glossary of Terms. If you missed the original post about the Cutline approach, you can read it here.
Hope reigned supreme that a hypothetically effective vaccine will become reality and cause the economy to recover some time next year, which would benefit stocks.
“This week’s positive vaccine news is a game-changer in our view, as it allows the market to look through the recent surge in COVID-19 cases to the impending end of the pandemic and broader reopening of the economy,” opined Marko Kolanovic, JPMorgan’s head of macro quantitative and derivatives strategy, who was among the first to call the market’s turn in March.
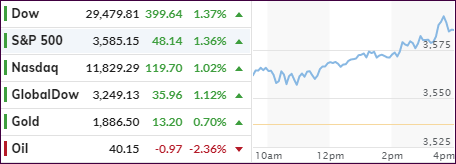
That was the theme today, and the major indexes rallied over 1%, with the Nasdaq lagging at first, then picking up steam but still ending up in 3rd place. For the week, the S&P 500 added +2.2%.
Still, concerns are mounting over the continued strict social distancing measures with some mayors suggesting cancelling Thanksgiving and staying indoors, while others issued new curfews on bars, restaurants, and gyms. That means, if the much-touted vaccine does not arrive as anticipated, you can kiss the hoped-for economic recovery goodbye.
The Energy sector soared to its best week ever, joined by nice pops in Airlines and Banking, while FANG stocks suffered. The 30-year bond yield dropped, and the US dollar closed higher. After Monday’s slam down, gold worked its way back but fell short of reclaiming the $1,900 level.
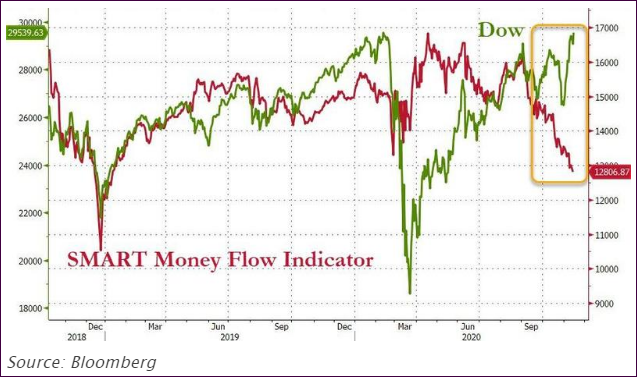
But not all is hunky dory, as ZH reported:
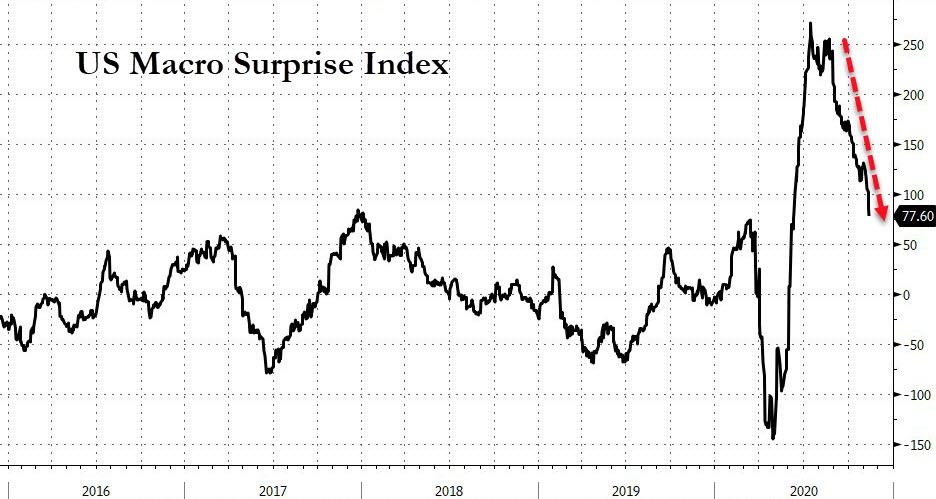
The US Macro Surprise Index is slipping, the Baltic Dry Freight Index is in retreat mode, which brings up the question: “Is this why the smart money is exiting the markets?”
Given the above, it’s wise to approach this market with caution and not with reckless abandon.
ETF Data updated through Thursday, November 12, 2020
Methodology/Use of this StatSheet:
1. From the universe of over 1,800 ETFs, I have selected only those with a trading volume of over $5 million per day (HV ETFs), so that liquidity and a small bid/ask spread are assured.
2. Trend Tracking Indexes (TTIs)
Buy or Sell decisions for Domestic and International ETFs (section 1 and 2), are made based on the respective TTI and its position either above or below its long-term M/A (Moving Average). A crossing of the trend line from below accompanied by some staying power above constitutes a “Buy” signal. Conversely, a clear break below the line constitutes a “Sell” signal. Additionally, I use a 7.5% trailing stop loss on all positions in these categories to control downside risk.
3. All other investment arenas do not have a TTI and should be traded based on the position of the individual ETF relative to its own respective trend line (%M/A). That’s why those signals are referred to as a “Selective Buy.” In other words, if an ETF crosses its own trendline to the upside, a “Buy” signal is generated. Since these areas tend to be more volatile, I recommend a wider trailing sell stop of 7.5% -10% depending on your risk tolerance.
If you are unfamiliar with some of the terminology, please see Glossary of Termsand new subscriber information in section 9.
1. DOMESTIC EQUITY ETFs: BUY— since 07/22/2020
Click on chart to enlarge
Our main directional indicator, the Domestic Trend Tracking Index (TTI-green line in the above chart) has now rallied above its long-term trend line (red) by +14.98% and remains in “BUY” mode as posted.
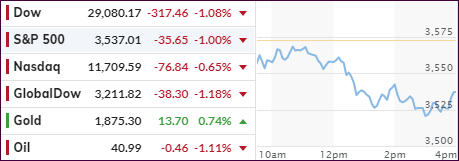
The futures market already indicated that volatility was on its way, with the indexes slipping around 1%, then trimming their losses and vacillating around their respective unchanged lines.
Moving into the regular session, the Dow and S&P 500 never saw the light of day and stumbled around in negative territory, then losing footing fast as selling accelerated late in the day before rebounding into the close. The Nasdaq fared much better and held onto gains till about mid-day, after which the bearish forces proved too strong, and the index capitulated as well.
The bearer of bad news was reports showing increasing numbers of U.S. coronavirus cases, which brought concerns back to the front burner that the nascent economic recovery may not be as solid as assumed, especially in view of recent new lockdown orders. As a result, the S&P barely remains above Friday’s closing level, which means much of the “vaccine rally” has been given back.
Further sapping bullish strength were Fed head Powell’s remarks that the economic outlook remained uncertain despite the positive vaccine news story.
“From our standpoint, it’s just too soon to assess with any confidence the implications of the news for the path of the economy, especially in the near term,” Powell said regarding the vaccine. “With the virus spreading, the next few months could be challenging.”
Also keeping the bulls in check were WH statements, which greatly diminished the chances of a trillion-dollar or more stimulus for the economy before January, but Dems and Reps are still talking.
Moving into bullish mode was gold, which managed to stage a modest rally thereby offsetting most of the equity losses.
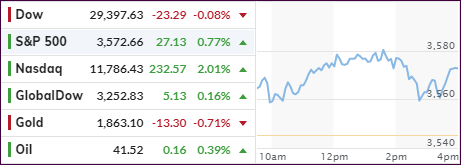
In the futures markets, we saw stocks in rally mode, including the Nasdaq staging a comeback. The US dollar inched higher, thereby keeping a lid on gold’s attempts to rebound.
The tug-of-war between surging infections and prospects for a new effective Covid-19 vaccine had the latter coming out ahead by lending support to equities, which carried over into the regular session.
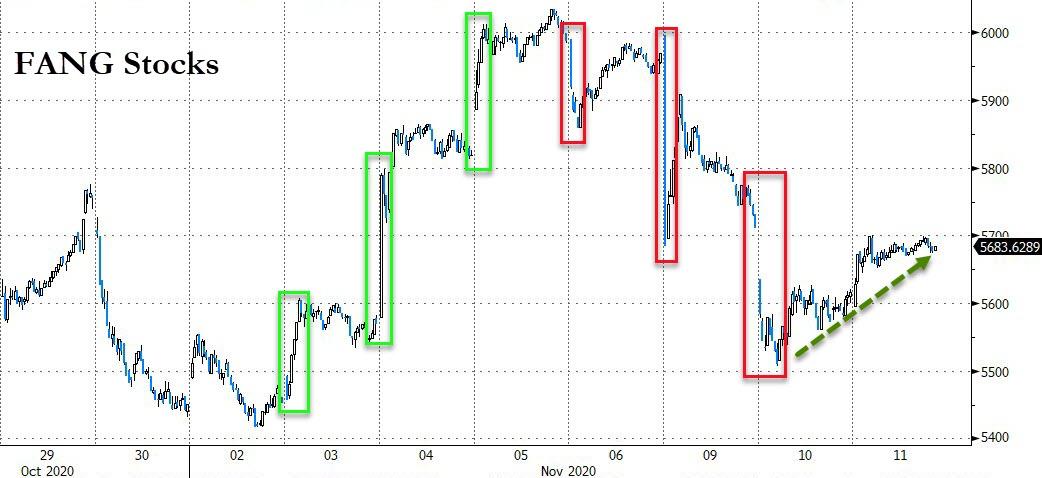
After taking a beating over the last few trading days, dip buyers stepped in and pushed the Nasdaq up over 2%, with the S&P 500 placing a distant second place, while the Dow slipped slightly into the red after strong back-to-back sessions.
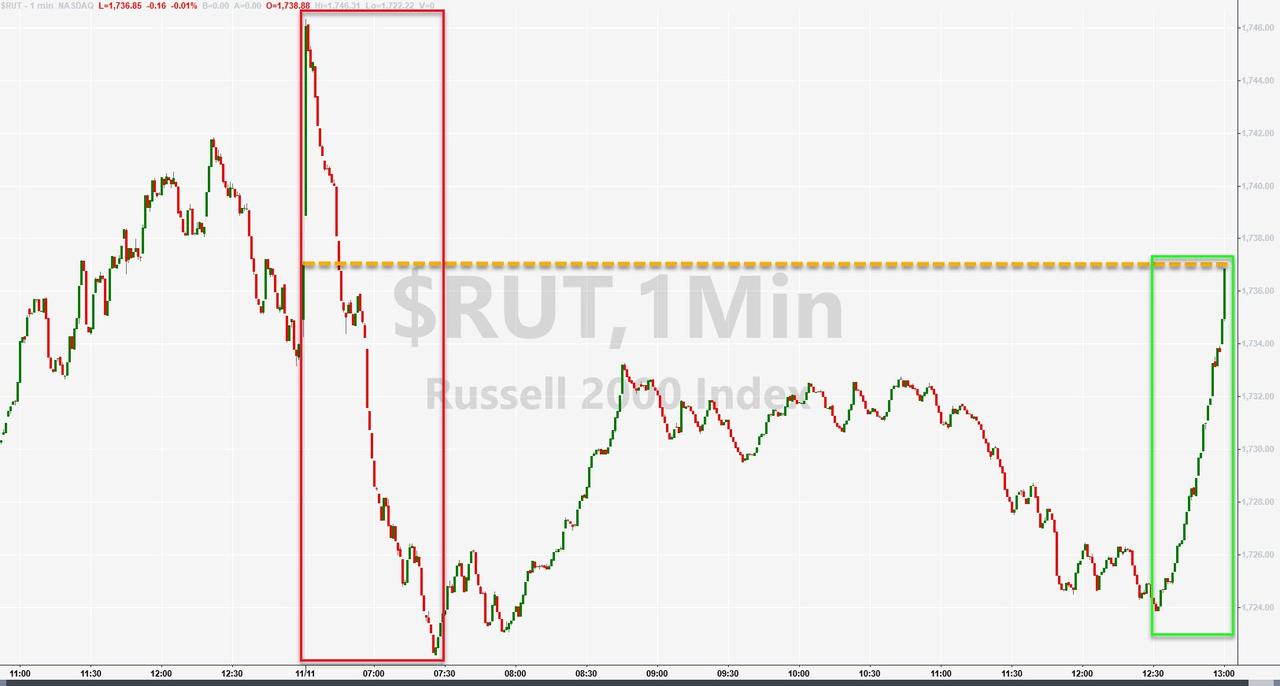
The bond market was closed due to Veteran’s Day, which prompted a reversal from value back to growth, as small caps suffered but were able to climb back to the unchanged line. As the Nasdaq recovered, so the did the FANG stocks, as Bloomberg shows in this chart.
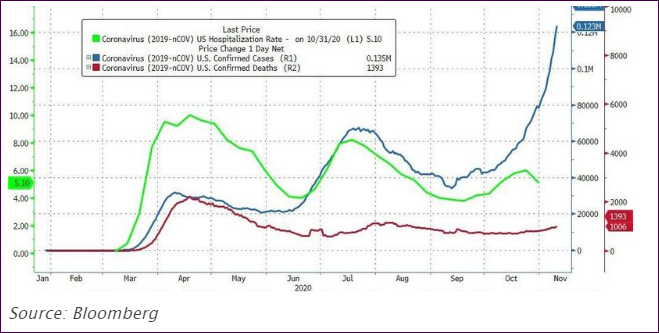
Cycling back to the Coronavirus, Bloomberg’s latest update shows that, while confirmed cases are rising, the hospitalization rate is vacillating but not storming higher, and the confirmed deaths have not increased:
You can draw your own conclusions.
Continue reading…
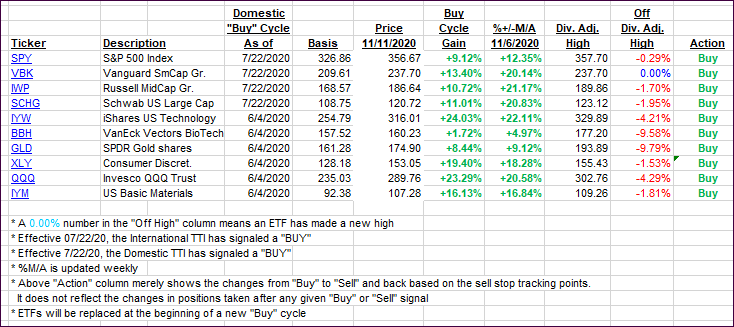
2. ETFs in the Spotlight
In case you missed the announcement and description of this section, you can read it here again.
It features some of the 10 broadly diversified domestic and sector ETFs from my HighVolume list as posted every Saturday. Furthermore, they are screened for the lowest MaxDD% number meaning they have been showing better resistance to temporary sell offs than all others over the past year.
The below table simply demonstrates the magnitude with which these ETFs are fluctuating above or below their respective individual trend lines (%+/-M/A). A break below, represented by a negative number, shows weakness, while a break above, represented by a positive percentage, shows strength.
For hundreds of ETF choices, be sure to reference Thursday’s StatSheet.
For this current domestic “Buy” cycle, here’s how some our candidates have fared:
Click image to enlarge
Again, the %+/-M/A column above shows the position of the various ETFs in relation to their respective long-term trend lines, while the trailing sell stops are being tracked in the “Off High” column. The “Action” column will signal a “Sell” once the -8% point has been taken out in the “Off High” column. For more volatile sector ETFs, the trigger point is -10%.
3. Trend Tracking Indexes (TTIs)
Our TTIs barely changed as big tech dominated today’s session.
This is how we closed 11/11/2020:
Domestic TTI: +16.80% above its M/A (prior close +17.01%)—Buy signal effective 07/22/2020
International TTI: +14.28% above its M/A (prior close +14.06%)—Buy signal effective 07/22/2020
Disclosure: I am obliged to inform you that I, as well as my advisory clients, own some of the ETFs listed in the above table. Furthermore, they do not represent a specific investment recommendation for you, they merely show which ETFs from the universe I track are falling within the specified guidelines.

