
- Moving the markets
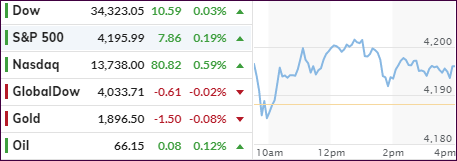
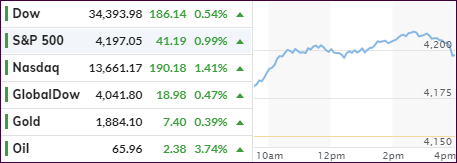
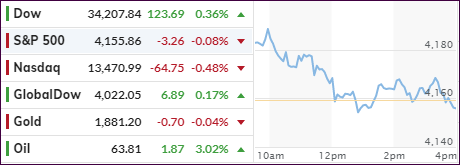
Despite an early bounce, much of the gains were given back during the session with only the Nasdaq staying solidly in the green, while the other two major indexes clung to their respective unchanged lines.
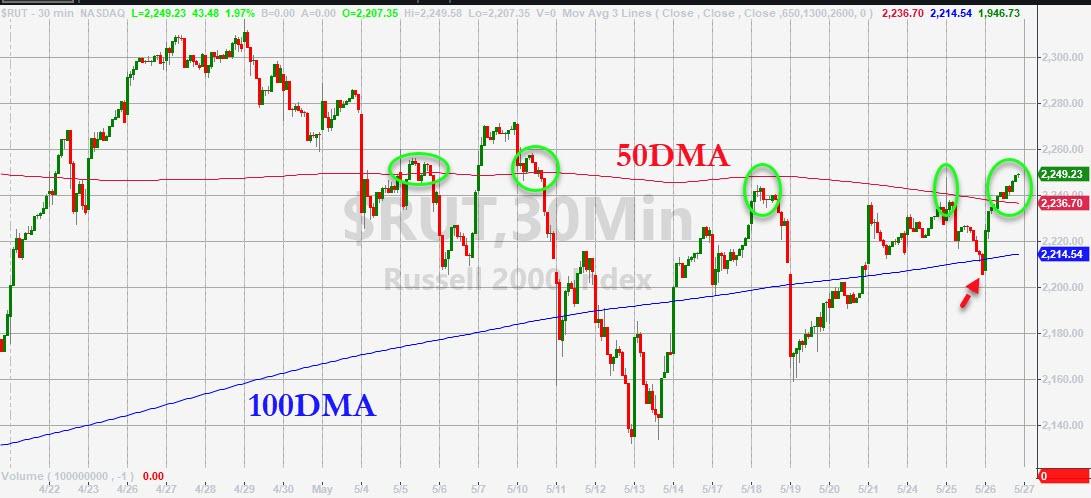
The theme remained the same as those stocks, which are closely connected to the economic reopening, benefitted the most. That helped the tech sector and especially Small Caps to gain some footing, after the latter had been sliding ever since making an ATH the middle of February.
A positive outlook about the economy continues to be the center of discussion, with CNBC adding:
The optimism on the economy comes as U.S. average daily Covid cases fall below 25,000 and as nearly half the U.S. population has received at least one vaccination dose.
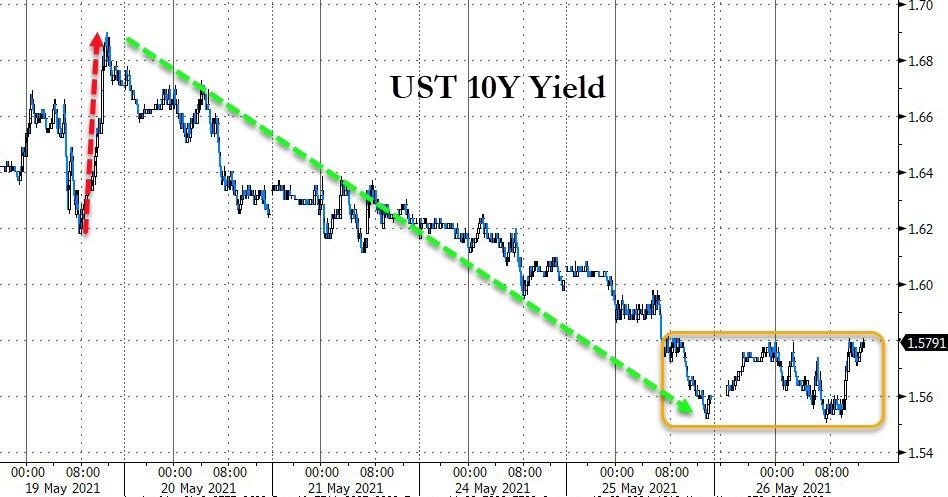
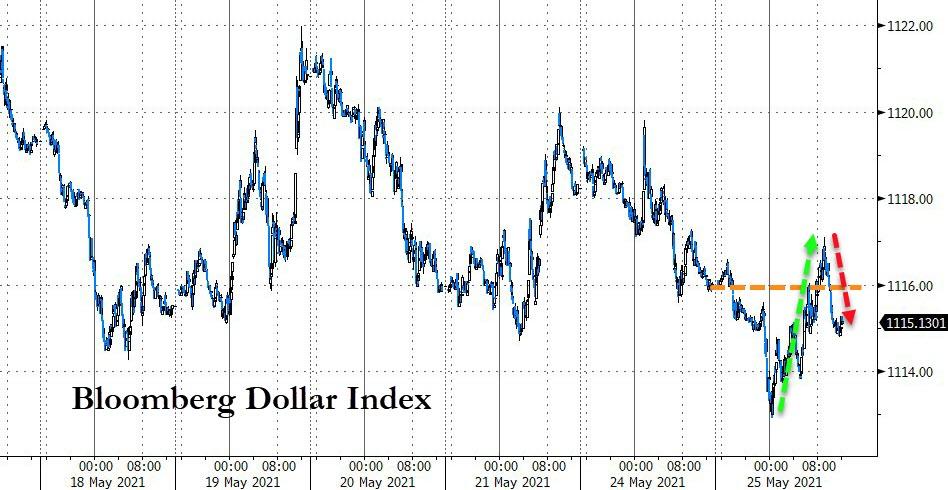
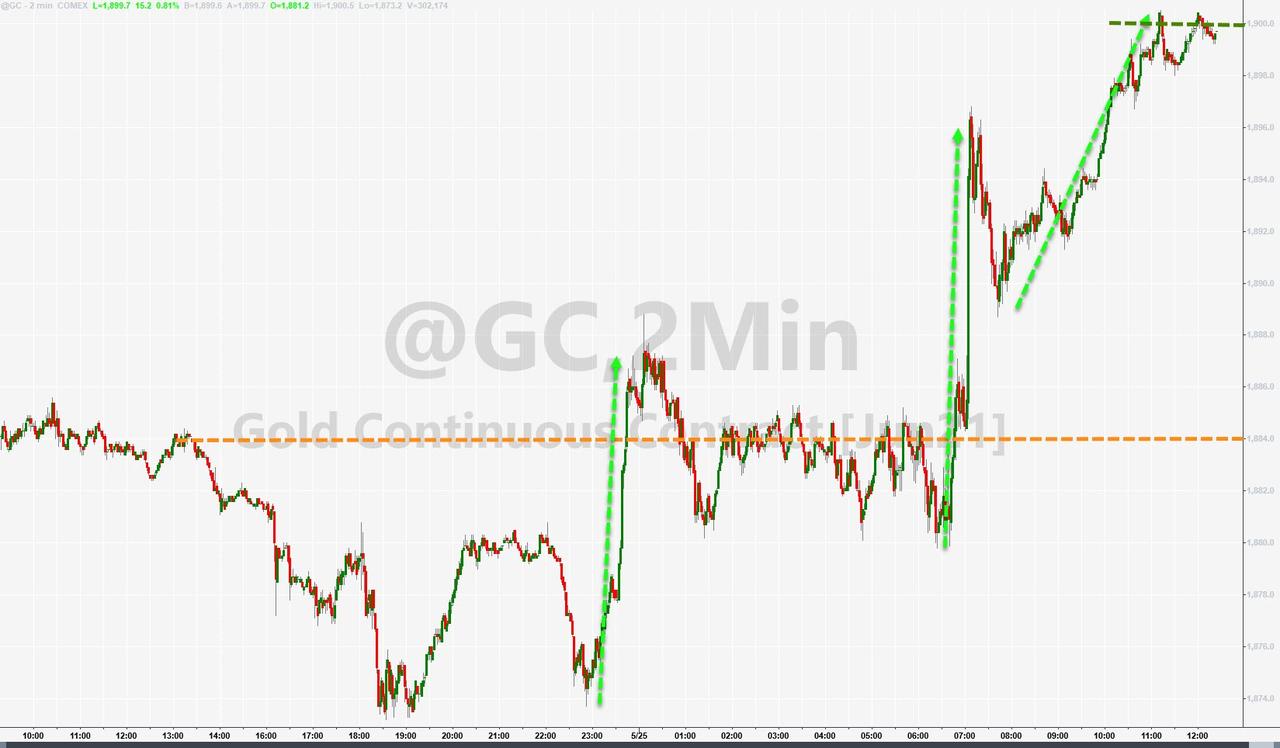
Bond yields went mostly sideways but edged a tad higher into the close, which was followed by the US Dollar index finally finding a reason to rally. That combination took the starch out of an early surge in Gold, with the precious metal surrendering its $1,900 level by a small margin.
It was a session where not much was lost and not much was gained. To me, it seems like another driver will be needed to push the major indexes higher.
Read More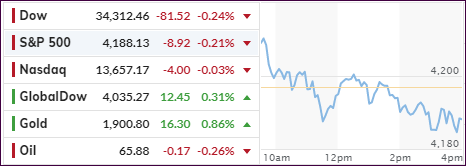
