Taking A Time Out

Ulli Market Commentary Contact

[Chart courtesy of MarketWatch.com]

  1. Moving the markets

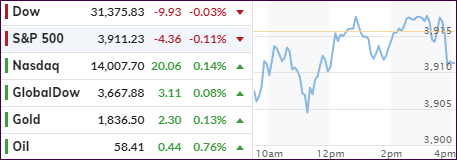
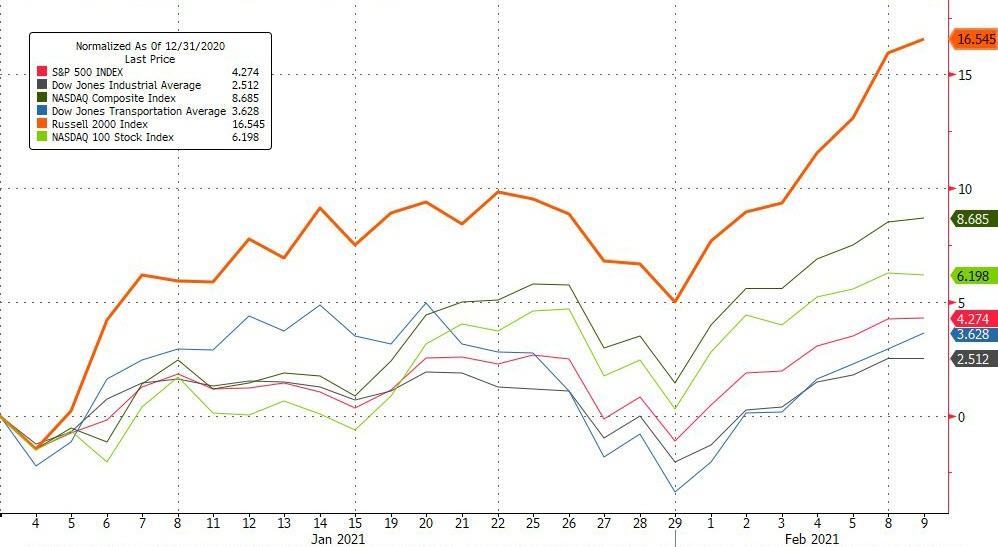
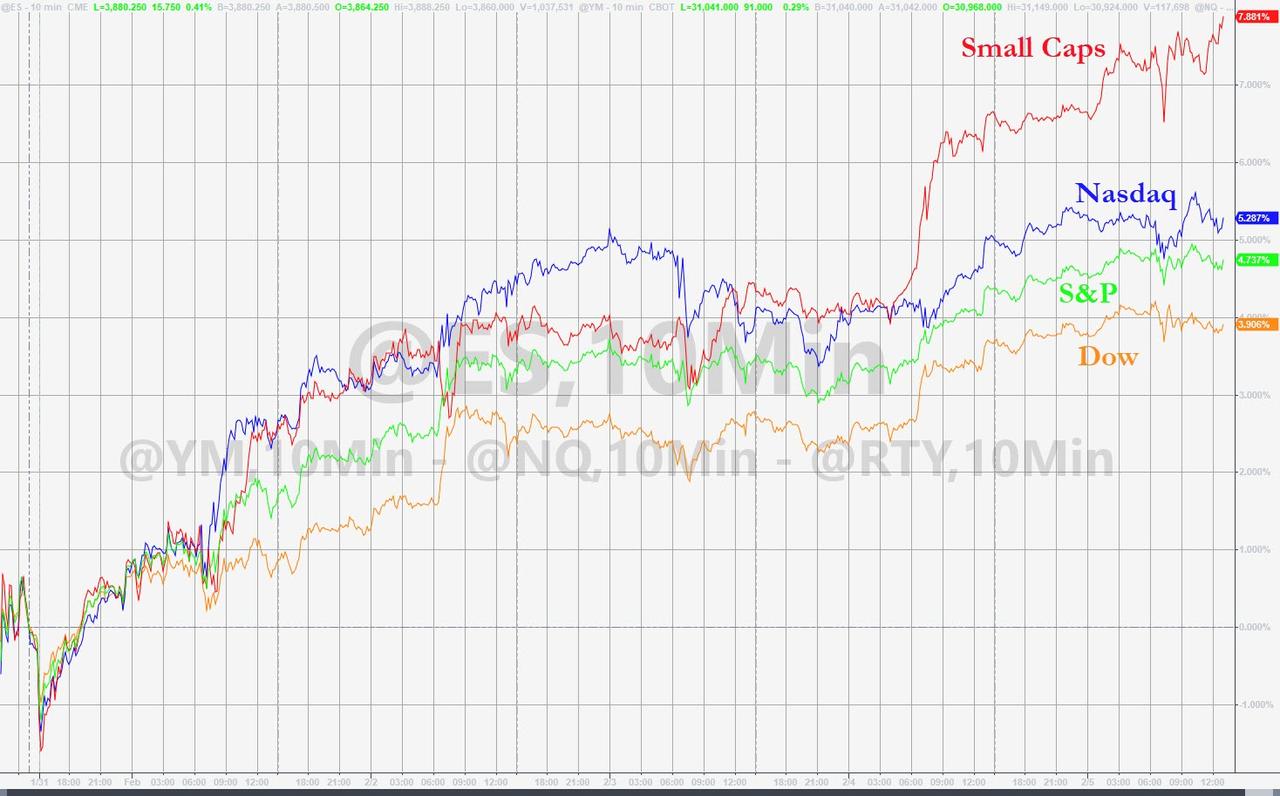
After the relentless march higher over the past 6 trading days, it was time for a pause. That is exactly what we saw today, as the major indexes dropped early on, recovered, and then hung around their respective unchanged lines. Only the Nasdaq was able to eke out a green close, albeit a tiny one, as the chart above shows.

Yet, despite this trip to nowhere, some of our holdings bucked the trend thereby turning this day into a positive one. Given its YTD history, you will not be surprised to hear that SmallCaps (IWO) ruled with another solid showing of +0.72%, which was closely followed by MidCaps (IWP) with +0.54%.

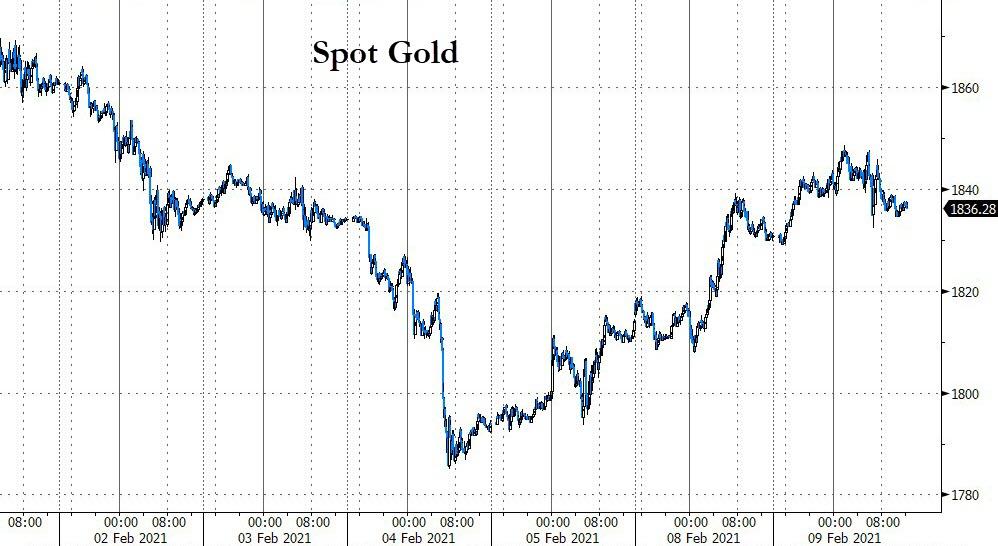
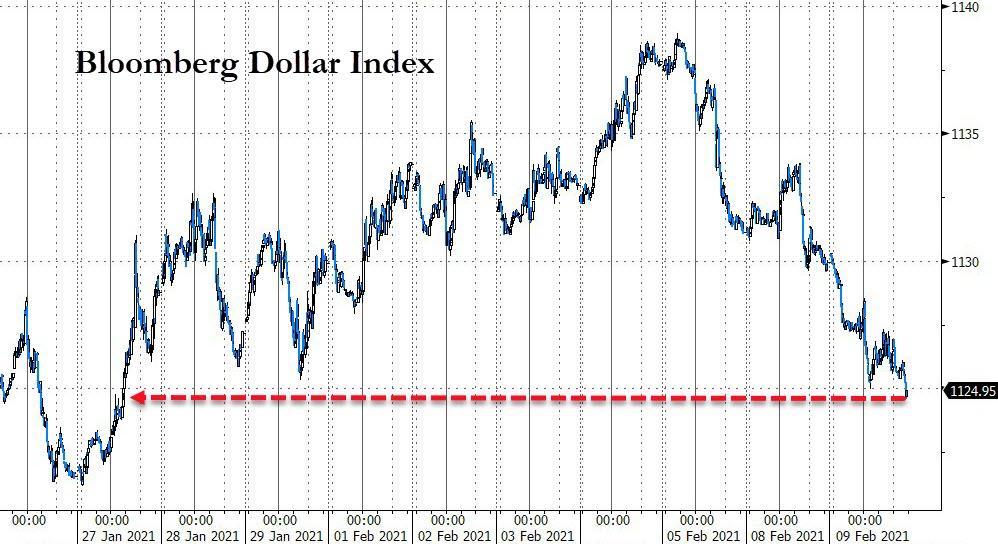
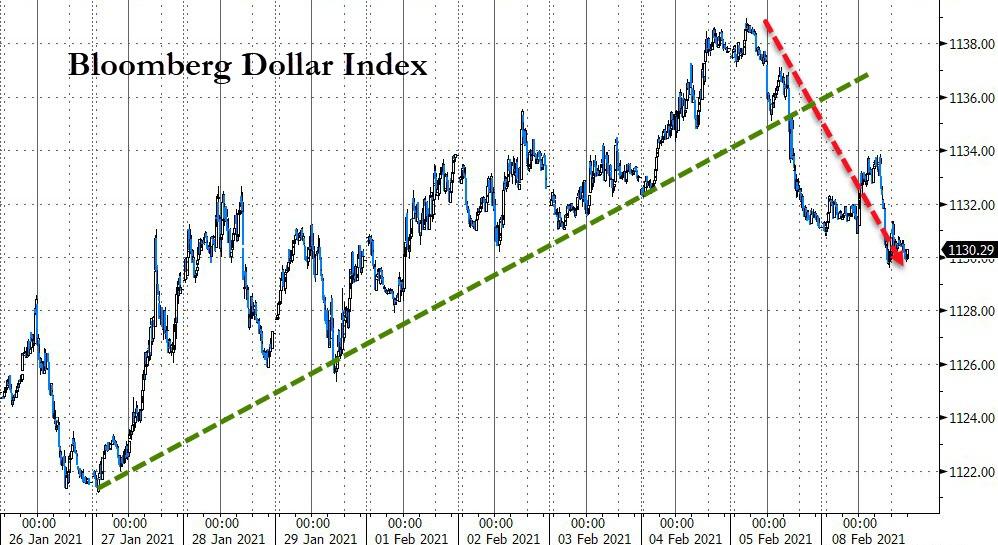
Even GLD managed a green close for the second day in a row by adding +0.34%, supported by a sliding US Dollar and lower bond yields.

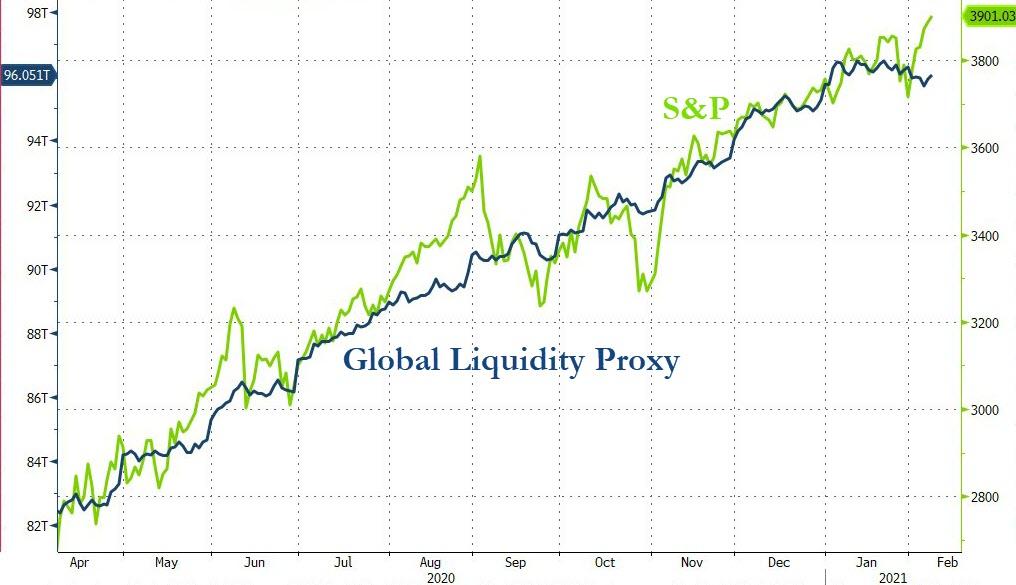
With market optimism continuing unabated, BofA Research had this to say:

“Among the pillars of this unprecedented bullish sentiment is the market’s pricing in of perfection on the policy front (maximal Fed accommodation, smooth fiscal passage of $1.9tn and more, and a steady vaccine rollout) while improvement from economic data may already be “as good as it gets”.

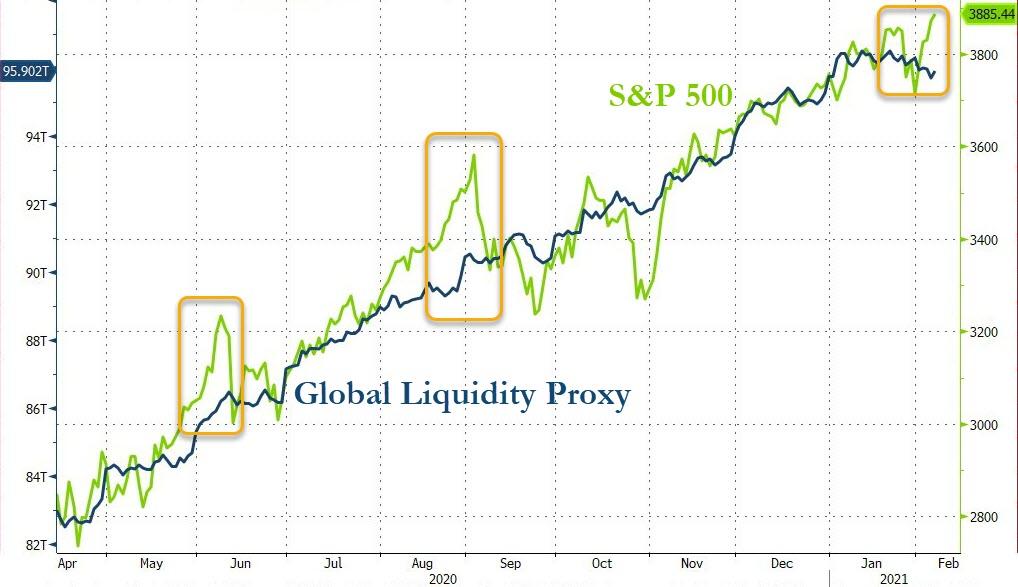
Then this word of caution and a suggestion:

Bank of America said a market correction could be on the horizon as the recent runup has shown signs of overheating, but it will be a buying opportunity for equity investors.

If all else fails, that’s how you cover both sides of the equation.

Read More

Ramping Into The Close

Ulli Market Commentary Contact

[Chart courtesy of MarketWatch.com]

  1. Moving the markets

While spending the day in the green, the major indexes vacillated but managed to find more upward momentum during the last hour of the session and ramped into the close.

The gains were solid with the Nasdaq leading the pack with +0.95%, yet it was outperformed by SmallCaps (IWO), showing again who the top dog is with an astonishing +2.38%.

A rare but not unexpected advance came from the precious metals sector, as Gold finally managed to put up a good number by adding +1.11%, thanks to in part of the US Dollar’s dive.

Today’s bullish mood came on the heels of last week’s outstanding showing with traders remaining optimistic about additional Covid stimulus and an ongoing nascent economic recovery.

The Dow and the S&P 500 scored record highs with both indexes now having risen for six days straight, which represents their longest streak since August. However, SmallCaps deserve most of the attention, as its benchmark has now surged some +15% in 2021.

Adding to economic hopes, strategist Tony Dwyer of Canaccord Genuity noted:

“While the economy is likely in a short-term stall as vaccinations roll through the population, it would take an epic unforeseen failure in the rollout of the various vaccines to prevent the domestic and economic engine from ramping greater than most expect.”

However, let’s not forget the main contributor to the relentless upswing in equities, namely the mind boggling trillions of dollars in liquidity sloshing into the markets, as ZH called it.

One analyst, Larry MacDonald, described that phenomenon like this:

“The combo of a near $1 trillion check and $120 billion monthly QE is the monetary equivalent of eating a banana split after downing an Italian hero sandwich. The market will be stuffed with reserves.”

Read More

ETFs On The Cutline – Updated Through 02/05/2021

Ulli ETFs on the Cutline Contact

Below, please find the latest High-Volume ETF Cutline report, which shows how far above or below their respective long-term trend lines (39-week SMA) my currently tracked ETFs are positioned.

This report covers the HV ETF Master List from Thursday’s StatSheet and includes 312 High Volume ETFs, defined as those with an average daily volume of more than $5 million, of which currently 264 (last week 268) are hovering in bullish territory. The yellow line separates those ETFs that are positioned above their trend line (%M/A) from those that have dropped below it.

Take a look:                                                                   

The HV ETF Master Cutline Report

In case you are not familiar with some of the terminology used in the reports, please read the Glossary of Terms. If you missed the original post about the Cutline approach, you can read it here.      

ETF Tracker Newsletter For February 5, 2021

Ulli ETF Tracker Contact

ETF Tracker StatSheet          

You can view the latest version here.

WHEN BAD NEWS IS GOOD NEWS

[Chart courtesy of MarketWatch.com]

  1. Moving the markets

The markets were back to interpreting bad news as good news for equities. This old meme was brought to the forefront again, as a dismal January payroll report sent the major surging at first with all of them closing in the green, despite some slippage late in the session.

Expectations were high that January would produce a solid job rebound, which did not happen. We saw the exact opposite, as a meager 105k expectation of news jobs created turned into the brutal reality of only 49k being produced.

When looking under the hood, as ZH did, that reality was even worse in that out of the 49k new jobs, 43k, or 88%, were created by governments and only 6k by private payrolls. Ouch. The only good news was that the unemployment rate tumbled to 6.3%.

To add insult to injury, the Labor Department also sharply revised down the numbers from December. Instead of having lost only 140k for that period, it turned out to be 227k!

If you are wondering why the markets did no sell off, but rallied instead, consider the simple assumption that this would likely increase further stimulus, which means more liquidity for the markets and therefor higher prices. Yes, that is all that matters, but some other factors come into play as well, as Adam Crisafulli of Vital Knowledge explained:

“The rally’s three pillars actually got stronger: Q4 earnings continue to dramatically exceed expectations, more stimulus is being poured into the economy, and the vaccination pace is accelerating.”

In the end, the major indexes produced their best weekly gains since November. The Dow added some +2%, while the S&P 500 and Nasdaq did far better with +4.6% and +5.6% respectively. However, SmallCaps took top billing with their remarkable 8% advance this week.

Read More

Weekly StatSheet For The ETF Tracker Newsletter – Updated Through 02/04/2021

Ulli ETF StatSheet Contact

ETF Data updated through Thursday, February 4, 2021

Methodology/Use of this StatSheet:

1. From the universe of over 1,800 ETFs, I have selected only those with a trading volume of over $5 million per day (HV ETFs), so that liquidity and a small bid/ask spread are assured.

2. Trend Tracking Indexes (TTIs)

Buy or Sell decisions for Domestic and International ETFs (section 1 and 2), are made based on the respective TTI and its position either above or below its long-term M/A (Moving Average). A crossing of the trend line from below accompanied by some staying power above constitutes a “Buy” signal. Conversely, a clear break below the line constitutes a “Sell” signal. Additionally, I use a 7.5% trailing stop loss on all positions in these categories to control downside risk.

3. All other investment arenas do not have a TTI and should be traded based on the position of the individual ETF relative to its own respective trend line (%M/A). That’s why those signals are referred to as a “Selective Buy.” In other words, if an ETF crosses its own trendline to the upside, a “Buy” signal is generated. Since these areas tend to be more volatile, I recommend a wider trailing sell stop of 7.5%-10% depending on your risk tolerance.

If you are unfamiliar with some of the terminology, please see Glossary of Terms and new subscriber information in section 9.     

1. DOMESTIC EQUITY ETFs: BUY — since 07/22/2020

Click on chart to enlarge

Our main directional indicator, the Domestic Trend Tracking Index (TTI-green line in the above chart) has now rallied above its long-term trend line (red) by +17.80% and remains in “BUY” mode as posted.

Read More

Regaining Upward Momentum

Ulli Market Commentary Contact

[Chart courtesy of MarketWatch.com]

  1. Moving the markets

With the benefit of hindsight, yesterday’s stagnant session turned out to be the springboard for today’s advances, during which all three major indexes scored solid gains of more than 1%. Despite last month’s stumble, the S&P 500 has come back with a vengeance and has now scored its 4th positive day in a row, while hitting a new record high in the process.

Despite the Nasdaq’s +1.23% gain, it only placed third in today’s race, after being outperformed by MidCaps (IWP) with +1.63% and SmallCaps (IWP) with an astounding +2.05%.

A better-than-expected report, though still horrific, for first-time unemployment insurance claims, showed a total of 779k new claims for the week, which was below the estimate of 830k.

Overall, the mood on Wall Street was optimistic, as the vaccine rollout, along with the easy monetary policy and more potential fiscal support, AKA loads of printing new money, will support earnings, which I turn will propel markets even higher.

“We believe that we are still in the early stages of a new bull market, transitioning from the ‘hope’ phase to a longer ‘growth’ phase as strong profit growth emerges,” Peter Oppenheimer, chief global equity strategist at Goldman Sachs, said in a note.

Still, on the stimulus front, the tug-of-war goes on with the Dems moving forward with Biden’s $1.9 trillion Covid-19 relief proposal, while the Republicans are leaning towards a more modest $618 billion package.

Can’t wait to see who the winner will be.

Read More