- Moving the markets
With the benefit of hindsight, yesterday’s stagnant session turned out to be the springboard for today’s advances, during which all three major indexes scored solid gains of more than 1%. Despite last month’s stumble, the S&P 500 has come back with a vengeance and has now scored its 4th positive day in a row, while hitting a new record high in the process.
Despite the Nasdaq’s +1.23% gain, it only placed third in today’s race, after being outperformed by MidCaps (IWP) with +1.63% and SmallCaps (IWP) with an astounding +2.05%.
A better-than-expected report, though still horrific, for first-time unemployment insurance claims, showed a total of 779k new claims for the week, which was below the estimate of 830k.
Overall, the mood on Wall Street was optimistic, as the vaccine rollout, along with the easy monetary policy and more potential fiscal support, AKA loads of printing new money, will support earnings, which I turn will propel markets even higher.
“We believe that we are still in the early stages of a new bull market, transitioning from the ‘hope’ phase to a longer ‘growth’ phase as strong profit growth emerges,” Peter Oppenheimer, chief global equity strategist at Goldman Sachs, said in a note.
Still, on the stimulus front, the tug-of-war goes on with the Dems moving forward with Biden’s $1.9 trillion Covid-19 relief proposal, while the Republicans are leaning towards a more modest $618 billion package.
Can’t wait to see who the winner will be.
2. ETFs in the Spotlight
In case you missed the announcement and description of this section, you can read it here again.
It features some of the 10 broadly diversified domestic and sector ETFs from my HighVolume list as posted every Saturday. Furthermore, they are screened for the lowest MaxDD% number meaning they have been showing better resistance to temporary sell offs than all others over the past year.
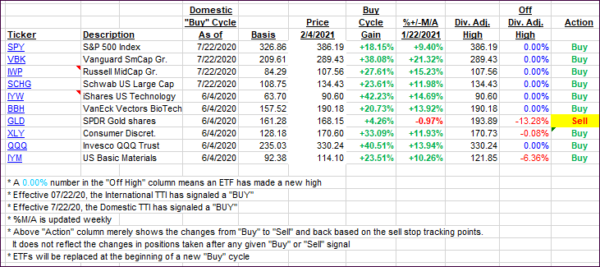
The below table simply demonstrates the magnitude with which these ETFs are fluctuating above or below their respective individual trend lines (%+/-M/A). A break below, represented by a negative number, shows weakness, while a break above, represented by a positive percentage, shows strength.
For hundreds of ETF choices, be sure to reference Thursday’s StatSheet.
For this current domestic “Buy” cycle, here’s how some our candidates have fared:

Click image to enlarge.
Again, the %+/-M/A column above shows the position of the various ETFs in relation to their respective long-term trend lines, while the trailing sell stops are being tracked in the “Off High” column. The “Action” column will signal a “Sell” once the -8% point has been taken out in the “Off High” column. For more volatile sector ETFs, the trigger point is -10%.
3. Trend Tracking Indexes (TTIs)
Our TTIs moved in sync with both heading deeper into bullish territory.
This is how we closed 2/04/2021:
Domestic TTI: +17.80% above its M/A (prior close +16.32%)—Buy signal effective 07/22/2020.
International TTI: +16.39% above its M/A (prior close +15.26%)—Buy signal effective 07/22/2020.
Disclosure: I am obliged to inform you that I, as well as my advisory clients, own some of the ETFs listed in the above table. Furthermore, they do not represent a specific investment recommendation for you, they merely show which ETFs from the universe I track are falling within the specified guidelines.
Contact Ulli