Below, please find the latest High-Volume ETF Cutline report, which shows how far above or below their respective long-term trend lines (39-week SMA) my currently tracked ETFs are positioned.
This report covers the HV ETF Master List from Thursday’s StatSheet and includes 312 High Volume ETFs, defined as those with an average daily volume of more than $5 million, of which currently 243 (last week 258) are hovering in bullish territory. The yellow line separates those ETFs that are positioned above their trend line (%M/A) from those that have dropped below it.
In case you are not familiar with some of the terminology used in the reports, please read the Glossary of Terms. If you missed the original post about the Cutline approach, you can read it here.
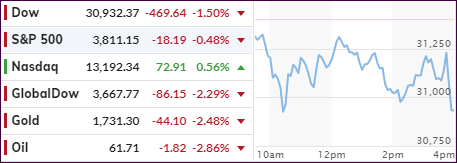
Despite a slightly positive opening, the markets dropped sharply thereafter but attempted to rebound throughout the session. It was only the Nasdaq, which after some heavy drubbing early in the week, managed a green close, while weakness prevailed in the Dow and S&P 500.
A couple of our ETFs had triggered their trailing sell stops yesterday. Today’s pullback gave the confirmation I was looking for and those two were liquidated. Since both were volatile, this sale provided the perfect excuse to turn unrealized gains into realized ones and allow me, should bullish momentum pick up next week, to rotate into areas better suited in the current environment. If, on the other hand, the bears continue to flex their muscles, we will have reduced our market risk and will be able to better withstand a southerly trend.
The Dow was riding the roller coaster all day, swung wildly, and closed near the session’s low point. Wall Street continued its struggle with rising bond yields, which at some point will punish equities.
Have we reached this moment in time already? It’s too early to tell, but it is definitely a possibility. I think the situation will become much clearer as we enter March.
For the month of February, we saw the Dow and S&P 500 gain 3.5% and 2.61% respectively, with the Nasdaq only adding a meager 1.9%, as the second half of the month was not kind to the tech sector.
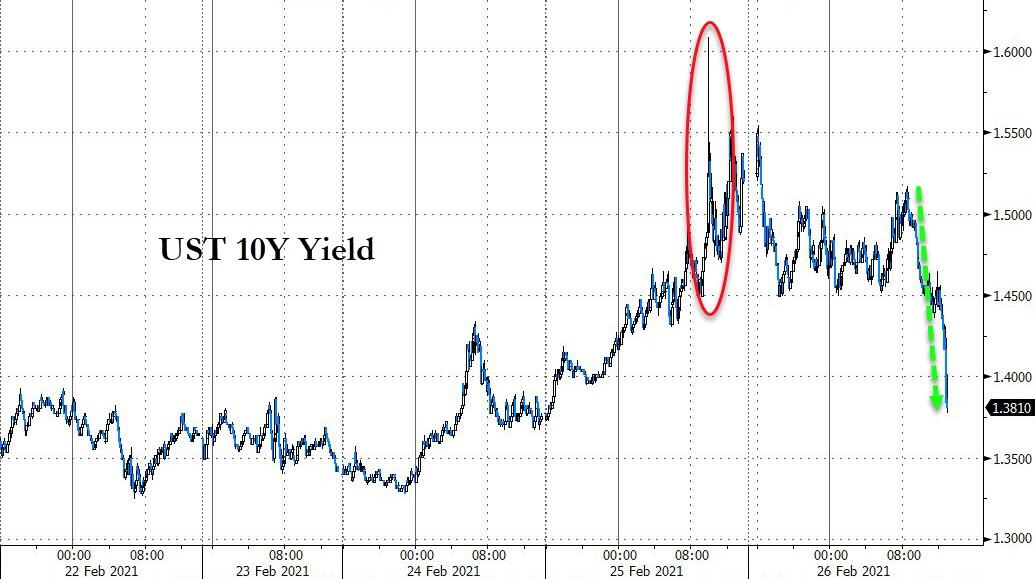
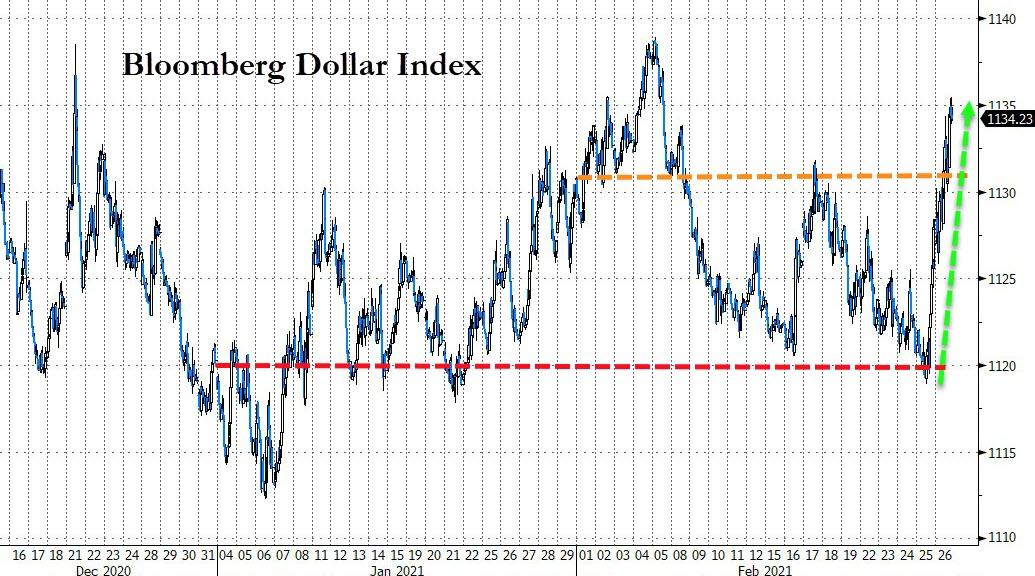
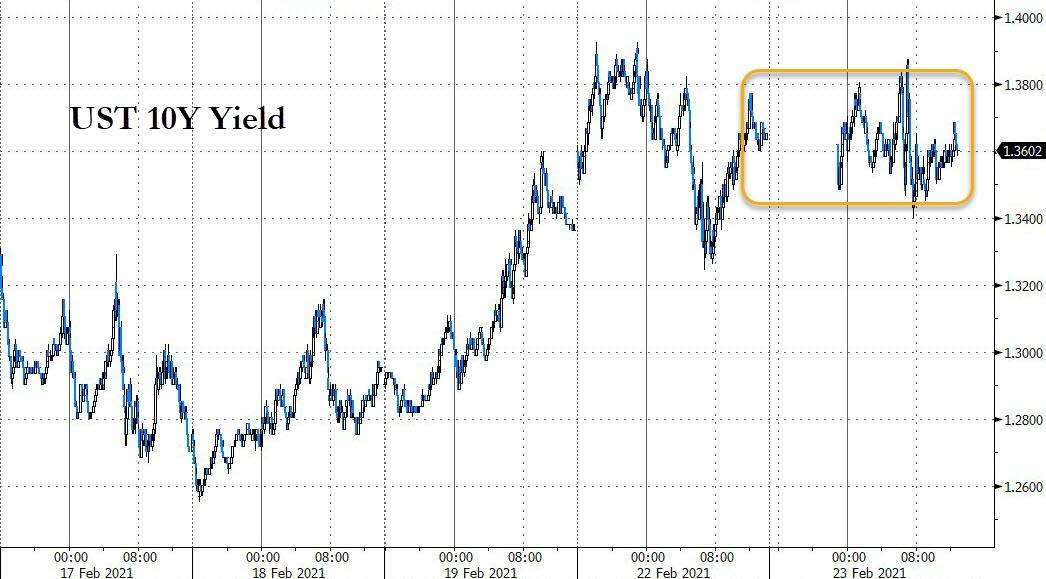
After having spiked to over 1.6% yesterday, bond yields calmed down a little with the 10-year retreating to the 1.42% area. The US Dollar index bounced off of yesterday’s low and, in combination with elevated bond yields, pushed gold down and below its $1,800 level—again.
Even though the indexes closed in the green for the month, most of the gains happened in the first half. Subsequently, bullish sentiment seems to have lessened over the past 10 days or so. This may be just a pause in an ongoing bull market, but it could also indicate a directional change.
Our trailing sell stops, once triggered and executed, will point the way to safety, should such a move become necessary.
ETF Data updated through Thursday, February 25, 2021
Methodology/Use of this StatSheet:
1. From the universe of over 1,800 ETFs, I have selected only those with a trading volume of over $5 million per day (HV ETFs), so that liquidity and a small bid/ask spread are assured.
2. Trend Tracking Indexes (TTIs)
Buy or Sell decisions for Domestic and International ETFs (section 1 and 2), are made based on the respective TTI and its position either above or below its long-term M/A (Moving Average). A crossing of the trend line from below accompanied by some staying power above constitutes a “Buy” signal. Conversely, a clear break below the line constitutes a “Sell” signal. Additionally, I use a 7.5% trailing stop loss on all positions in these categories to control downside risk.
3. All other investment arenas do not have a TTI and should be traded based on the position of the individual ETF relative to its own respective trend line (%M/A). That’s why those signals are referred to as a “Selective Buy.” In other words, if an ETF crosses its own trendline to the upside, a “Buy” signal is generated. Since these areas tend to be more volatile, I recommend a wider trailing sell stop of 7.5%-10% depending on your risk tolerance.
If you are unfamiliar with some of the terminology, please see Glossary of Termsand new subscriber information in section 9.
1. DOMESTIC EQUITY ETFs: BUY— since 07/22/2020
Click on chart to enlarge
Our main directional indicator, the Domestic Trend Tracking Index (TTI-green line in the above chart) has now rallied above its long-term trend line (red) by +17.39% and remains in “BUY” mode as posted.
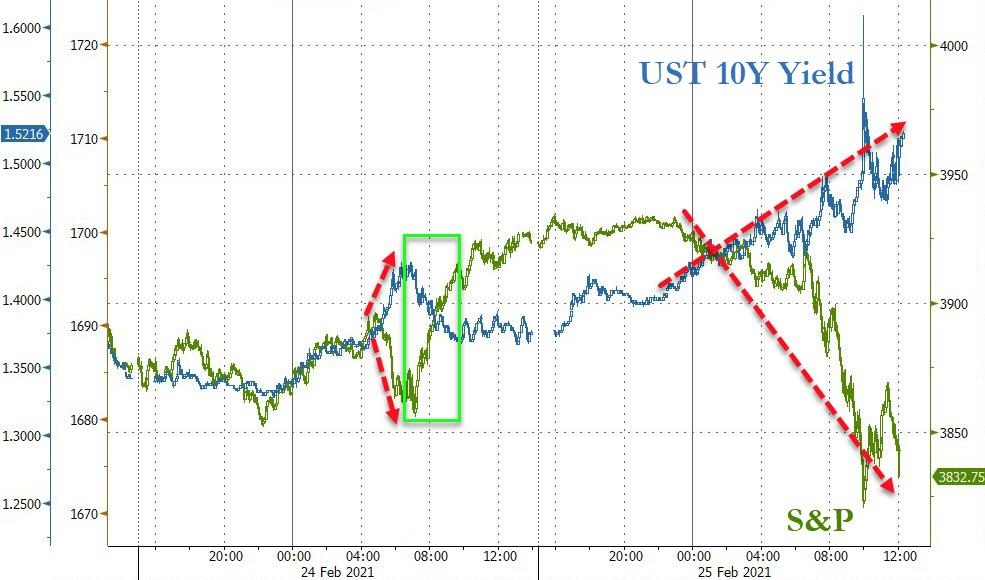
I have repeatedly pointed to rising bond yields as being the big equalizer that could affect equities negatively, and that’s what happened today. For the past 2 trading days, it was the Fed & Co. issuing well placed statements thereby assisting the major indexes to overcome early bearishness.
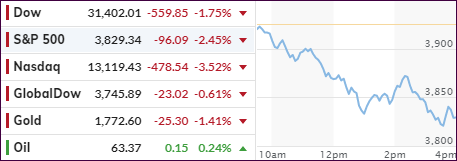
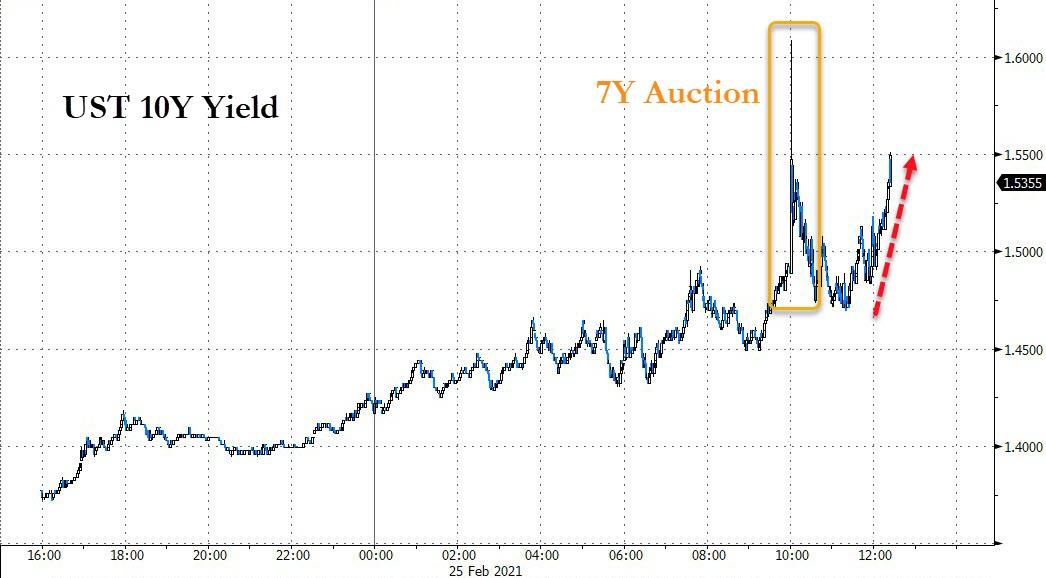
Where was the Fed head today? Nowhere to be heard is the answer, as bond yields continued their climb, thereby clobbering equities in the process. The 10-year soared above 1.6% in a sudden move, which some described as a “flash” spike. It settled at 1.523, up an astonishing 14 basis points.
Although some Fed mouthpieces tried to calm the nerves of traders, as ZH posted:
*FED’S BOSTIC SAYS “I AM NOT WORRIED” ABOUT MOVE IN YIELDS
*BOSTIC: FED DOESN’T NEED TO RESPOND TO YIELDS AT THIS POINT
*BOSTIC SAYS YIELDS STILL `VERY LOW’ FROM HISTORIC PERSPECTIVE
Even a mid-day rebound attempt in the major indexes had no chance of survival, and south we went. The Nasdaq got spanked the most and dropped -3.52% but was “outperformed” to the downside by the top gainer of the year, namely SmallCaps (IWO), which skidded -4.17%.
In the end, especially the bond/equity portfolios had their worst day since March 2020 due to bond yields rising and equities falling, causing bonds, which usually move opposite of equities, create even more pain for these types of portfolios. Case in point is the widely held 20-year bond ETF TLT, which got clobbered by -1.63%.
In other words, there was no offset to mitigate the fall of equities.
Not helping matters were hedge fund liquidations to cover margin calls in stocks they had re-shorted, and which were squeezed higher, thereby forcing fund managers to liquidate quality assets (tech sector) indiscriminately. Ouch!
Higher yields plus a rallying US Dollar kept Gold in check with the precious metal losing its $1,800 level again.
We are getting close to some of our trailing sell stops hitting their trigger points, and once that happens, they will be liquidated in accordance with our trading rules.
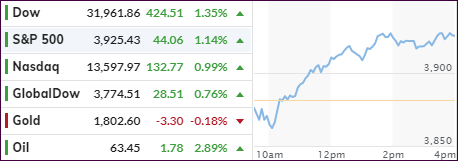
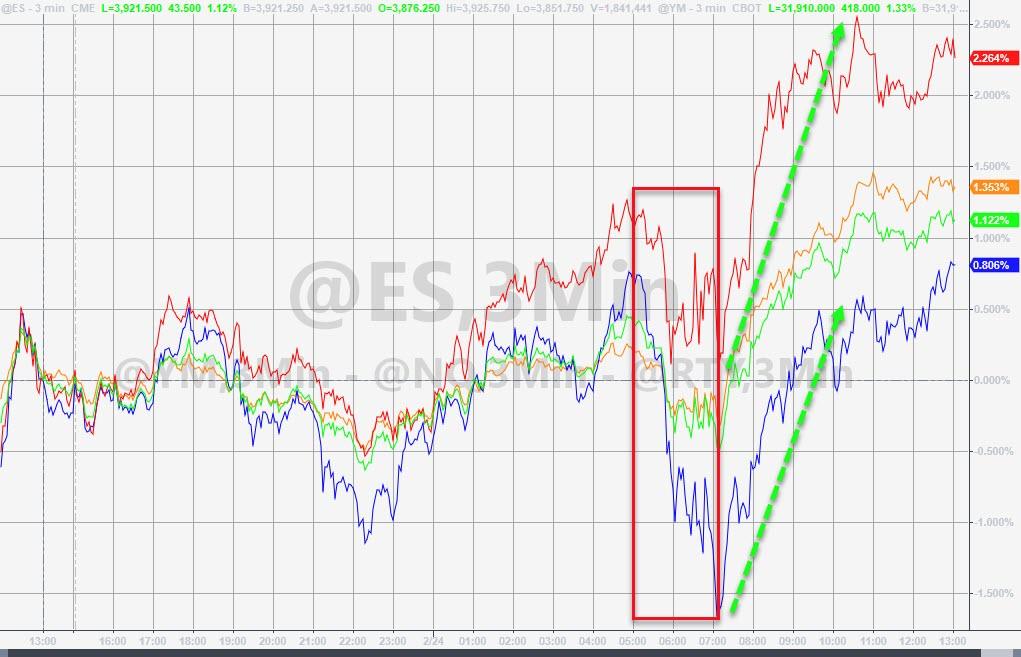
An early market dump received an unexpected assist, which turned into a big intraday comeback. Unlike yesterday, when Fed head Powell uttered some soothing remarks to pull equities out of a deep hole, today, the torch was passed.
It was none other than Fed Gov Lael Brainard who took center stage first and voiced this dovish comment:
“The economy remains far from our goals in terms of both employment and inflation, and it will take some time to achieve substantial further progress.”
This was followed by Powell’s semi-annual testimony, which was market friendly and contained no surprises, after which stocks and bonds went on a rampage.
Yes, that was all it took for the markets to change direction and shift into high gear with all 3 major indexes soaring, led by the Dow. Even the Nasdaq and SmallCaps (IWO), which have struggled as of late, catapulted higher by +0.99% and +2.10%.
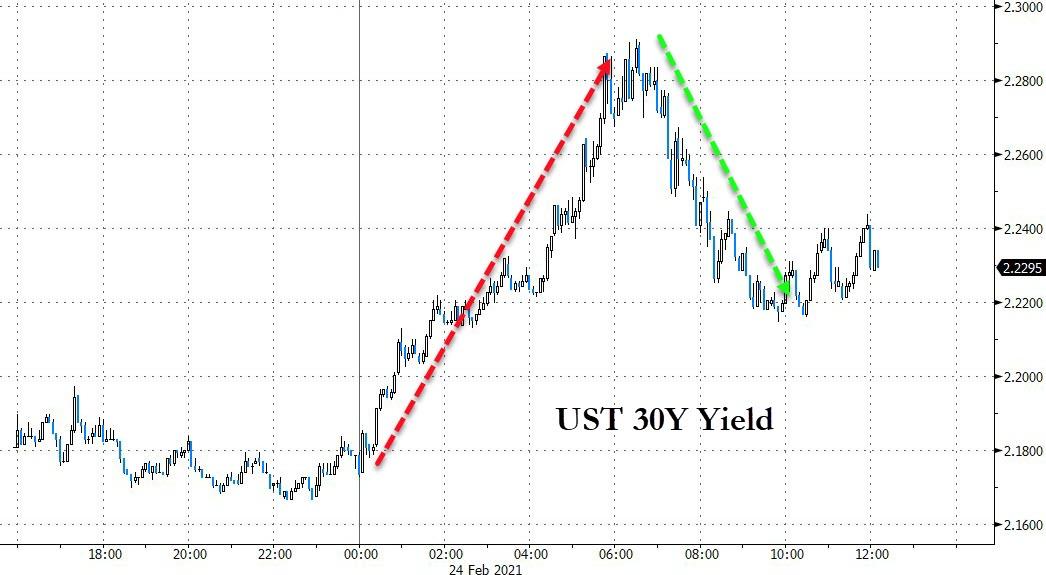
Rising bond yields also shifted in reverse with the 30-year dropping 5 basis points from intraday highs while the 10-year performed similar magic. For sure, had it not been for the “rescue operations” by the above Fed Gov/Powell team, we might have seen an ugly sell off.
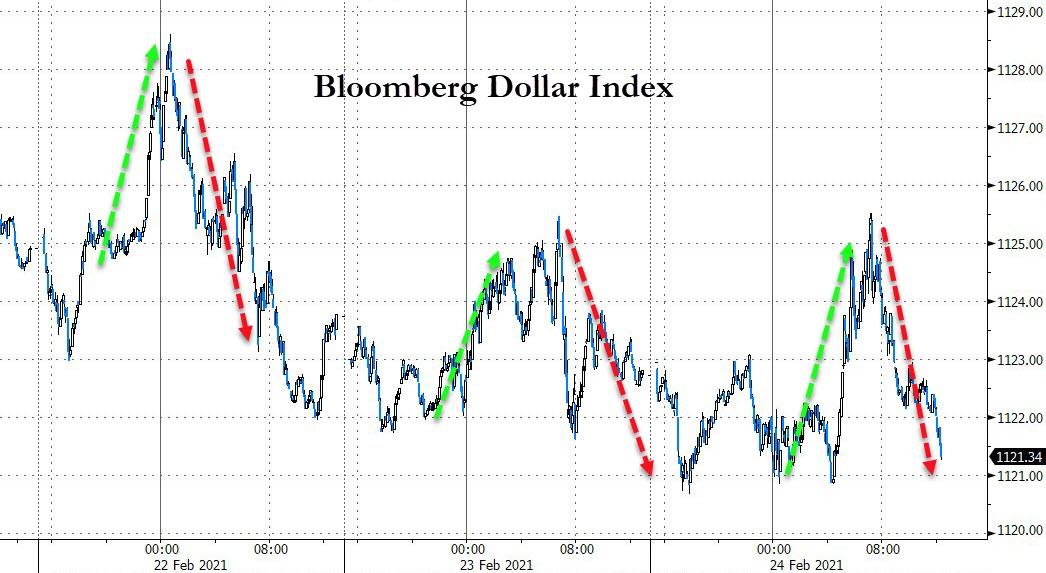
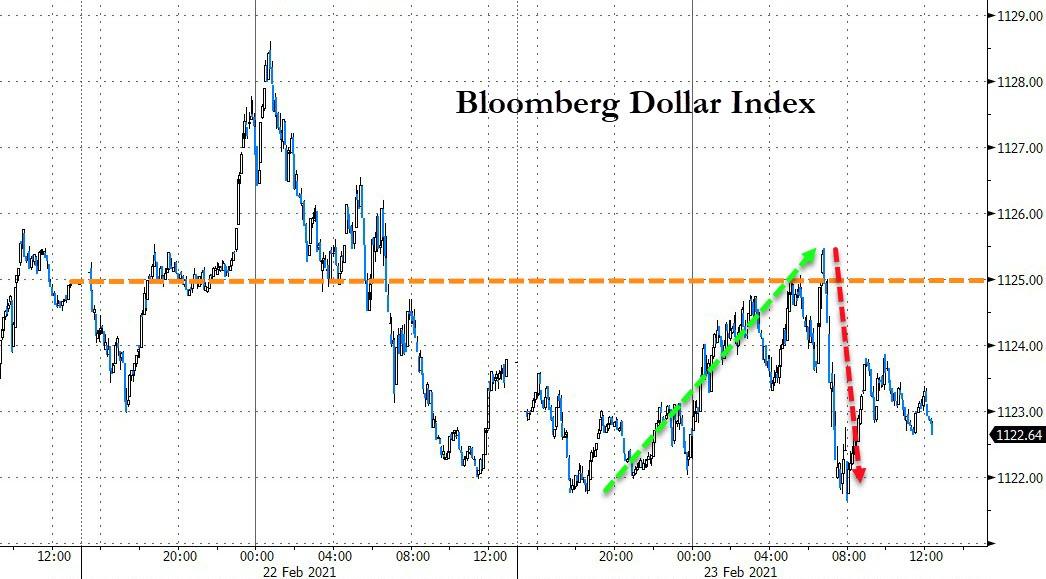
The US Dollar could not make up its mind and simply roundtripped, thereby pushing Gold around, however, the precious metal did not gain anything yet managed to hang on to its $1,800 level.
This day leaves me pondering “who will save the markets tomorrow?”
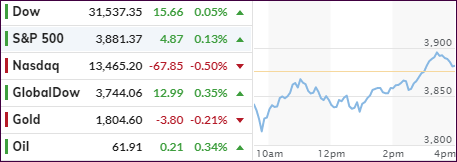
For the past few trading sessions, it seems like I am saying the same thing every day: A positive tone in overnight trading followed by a slam down at the opening. Today was no exception, but the major indexes managed a nice comeback with only the Nasdaq remaining down by -0.50% at the close, which was a great revival considering the lows of -2.5%.
While the Dow and S&P 500 crawled back into the green, it was only by a tiny margin, but we saw green, nonetheless. The Dow recovered from an early 360-point loss, which is quite remarkable.
SmallCaps (Russell 2000) dropped another 0.9% today, but they remain the top performer for this year with +7.6%.
Supporting the comeback were soothing words by Fed head Powell, as CNBC reported:
The intraday turnaround came after Powell said in his testimony to Congress that inflation is still “soft”, and the economic outlook is still “highly uncertain,” easing fears of a policy change by the central bank.
“The economy is a long way from our employment and inflation goals, and it is likely to take some time for substantial further progress to be achieved.”
With inflation fears having risen recently, causing surging bond yields, worries that more economic relief could force the Central Bank to raise borrowing costs, were somewhat alleviated after Powell’s speech.
The US Dollar tumbled, Gold barely held on to the $1,800 level and 10-year bond yields went sideways.
All in all, today was a recovery day. We’ll have to wait and see if that upward momentum can carry over into the end of the month.


