
- Moving the markets
Despite an initial jump after the Fed’s dovish FOMC statement, during which Fed head Powell hinted that “substantial further progress” would be necessary before any type of tapering, hiking, or tightening would occur, markets slumped. He was referring to stronger job numbers and advances towards maximum employment. Strangely enough, the Fed did not appear to be worried about soaring inflation. Go figure…
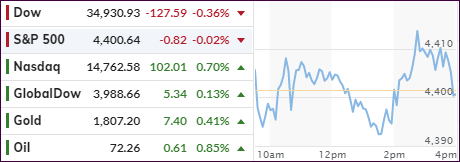
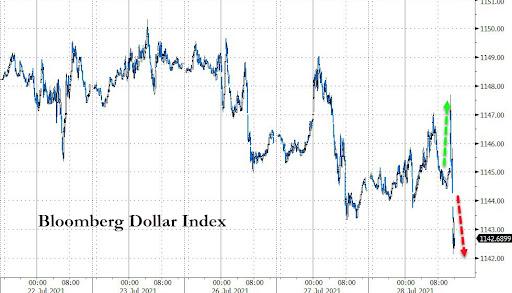
The markets ripped while the US dollar dipped after the announcement, but apparently the bullish impact proved to be ephemeral, with the major indexes giving up their gains and ending just about unchanged. The exception was the Nasdaq, which held on to its advances.
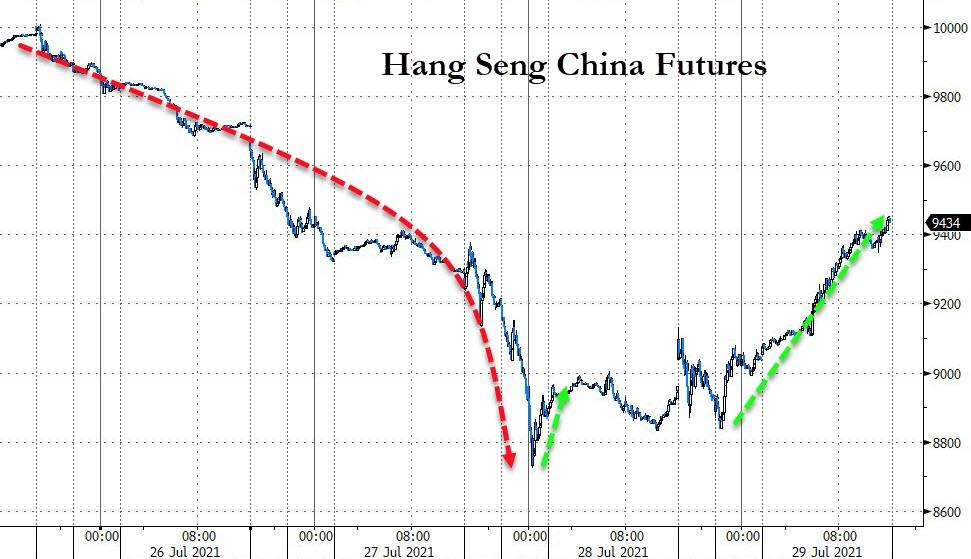
The tech assist came from Alphabet, which posted good quarterly results with especially its advertising revenue jumping 69%. Also helping the tech sector was a rebound in the Chinese markets after 3 days of relentless pounding.
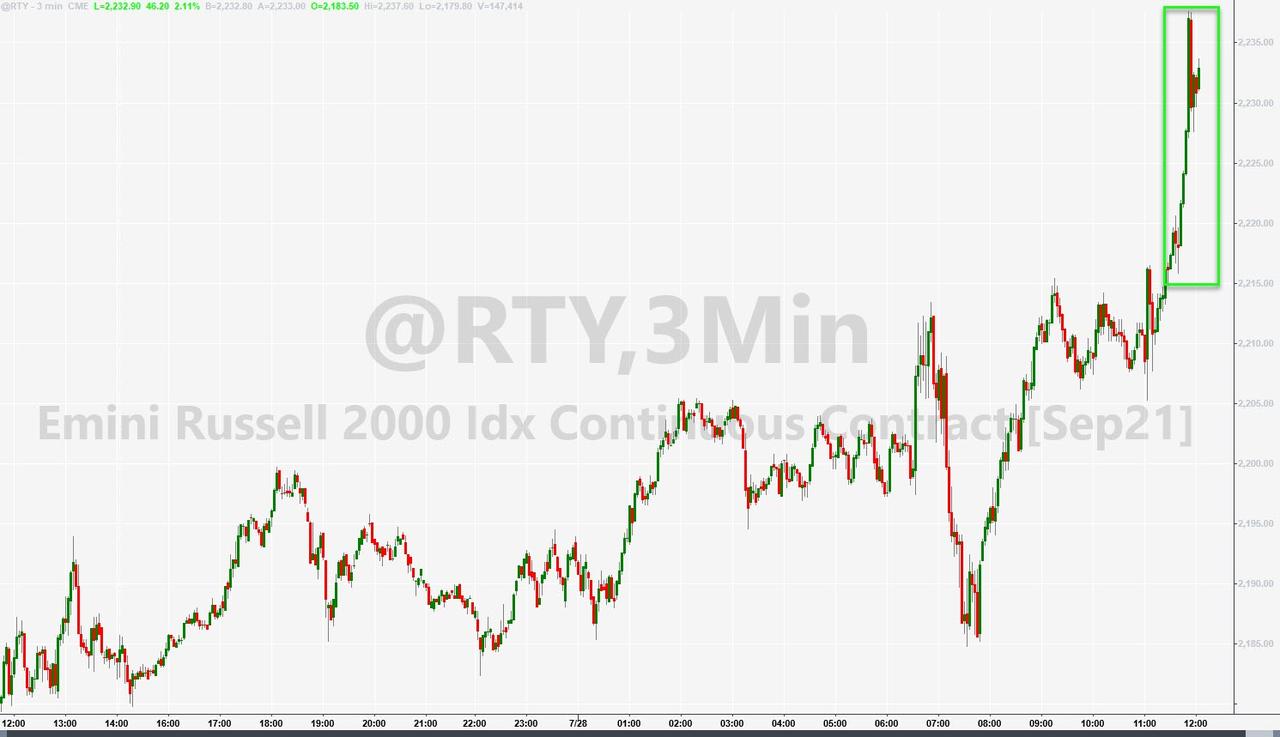
A short squeeze aided traders as well, but in the end only a select few managed to post green numbers. Small Caps (VBK) took the lead with a 1.42% gain, while “value” just about broke even.
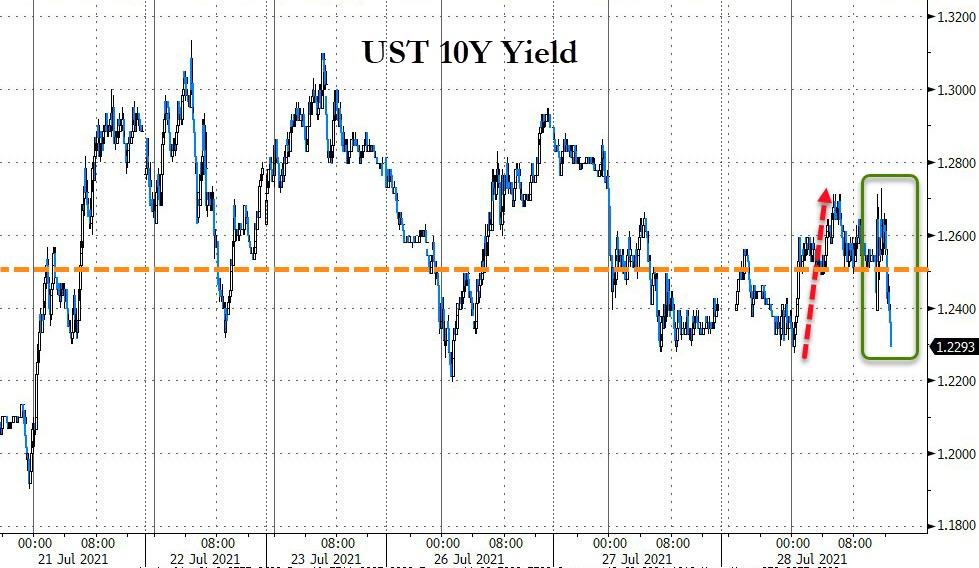
Bond yields popped and dropped with the 10-year ending the session unchanged, when the Fed’s early hawkish interpretation turning into a dovish one thereby sending bonds on another roller coaster ride.
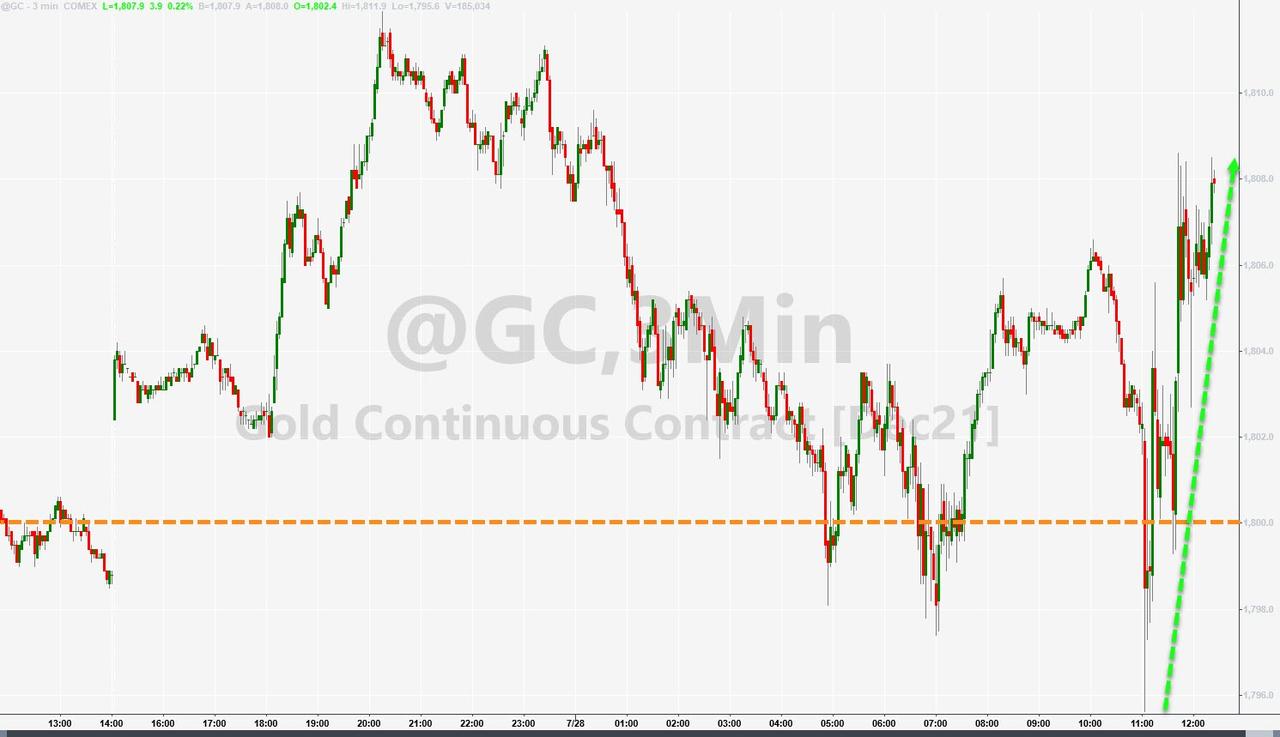
Finally, the collapsing US Dollar, and a sideways trending bond market, pushed Gold higher and back above its $1,800 level via a 0.50% gain for the GLD ETF.
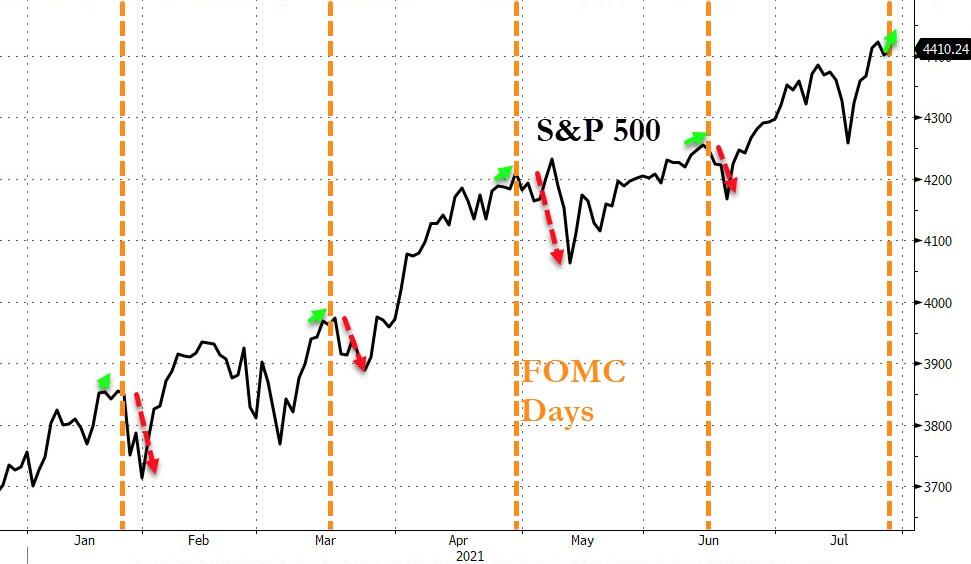
And, if Bloomberg’s post-FOMC pump pattern, as presented by Zero Hedge, remains true, we are in for a correction followed by another run higher, as this chart demonstrates. Unless, of course, seasonal weakness sets in.
2. ETFs in the Spotlight
In case you missed the announcement and description of this section, you can read it here again.
It features some of the 10 broadly diversified domestic and sector ETFs from my HighVolume list as posted every Saturday. Furthermore, they are screened for the lowest MaxDD% number meaning they have been showing better resistance to temporary sell offs than all others over the past year.
The below table simply demonstrates the magnitude with which these ETFs are fluctuating above or below their respective individual trend lines (%+/-M/A). A break below, represented by a negative number, shows weakness, while a break above, represented by a positive percentage, shows strength.
For hundreds of ETF choices, be sure to reference Thursday’s StatSheet.
For this current domestic “Buy” cycle, here’s how some our candidates have fared:
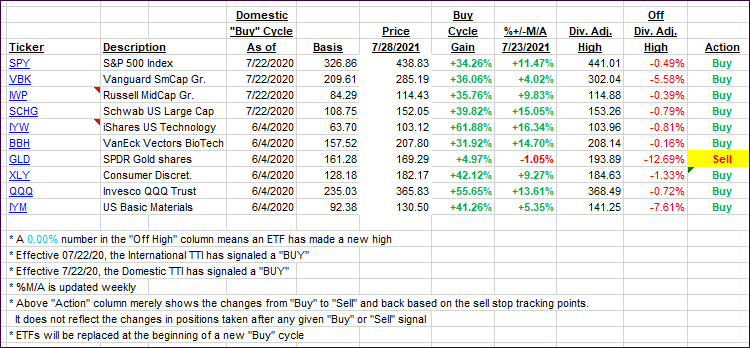
Click image to enlarge.
Again, the %+/-M/A column above shows the position of the various ETFs in relation to their respective long-term trend lines, while the trailing sell stops are being tracked in the “Off High” column. The “Action” column will signal a “Sell” once the -8% point has been taken out in the “Off High” column. For more volatile sector ETFs, the trigger point is -10%.
3. Trend Tracking Indexes (TTIs)
Our TTIs changed only inconsequentially.
This is how we closed 07/28/2021:
Domestic TTI: +10.73% above its M/A (prior close +10.68%)—Buy signal effective 07/22/2020.
International TTI: +7.07% above its M/A (prior close +6.91%)—Buy signals effective 07/22/2020.
Disclosure: I am obliged to inform you that I, as well as my advisory clients, own some of the ETFs listed in the above table. Furthermore, they do not represent a specific investment
recommendation for you, they merely show which ETFs from the universe I track are falling within the specified guidelines.
All linked charts above are courtesy of Bloomberg via ZeroHedge.
Contact Ulli