Purging And Surging

Ulli Market Commentary Contact

[Chart courtesy of MarketWatch.com]

  1. Moving the markets

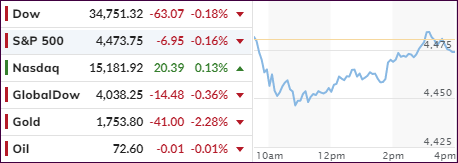
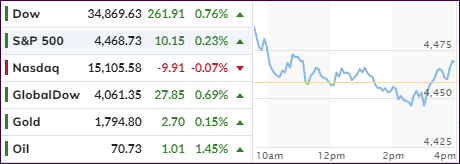
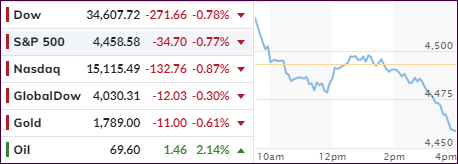
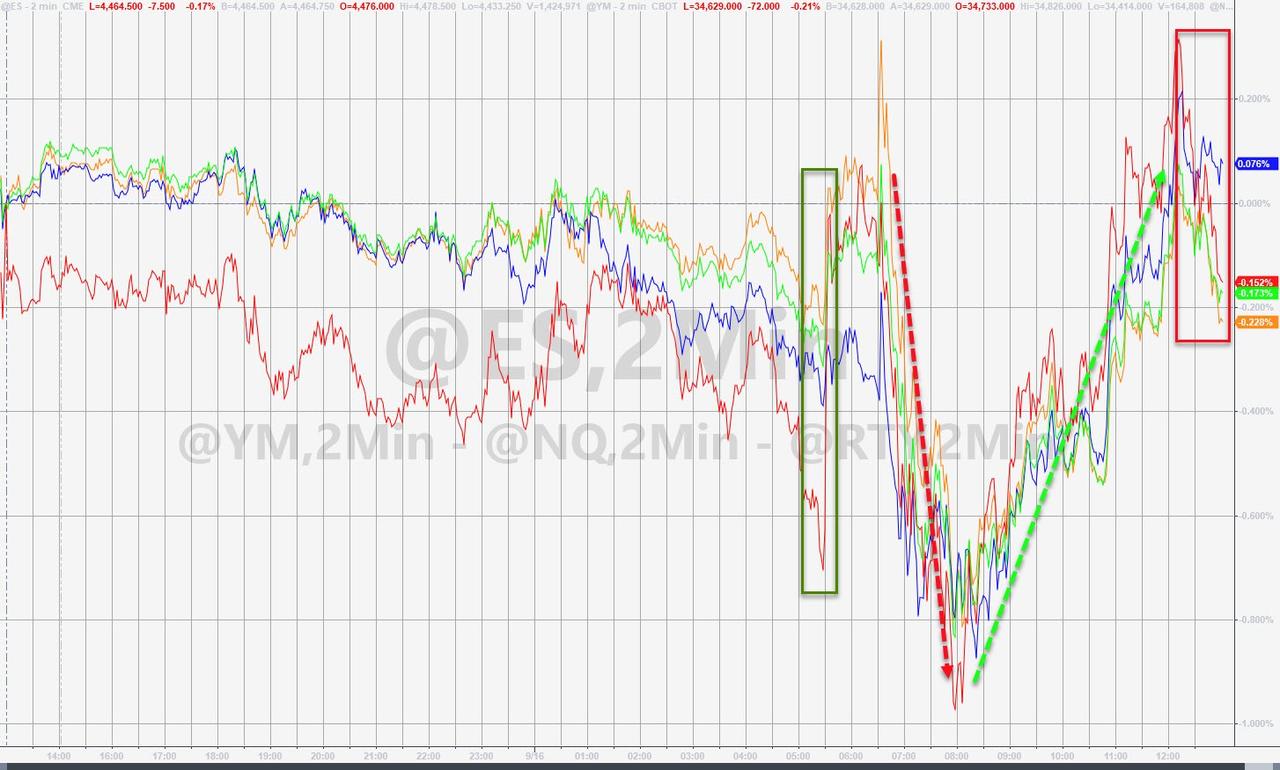
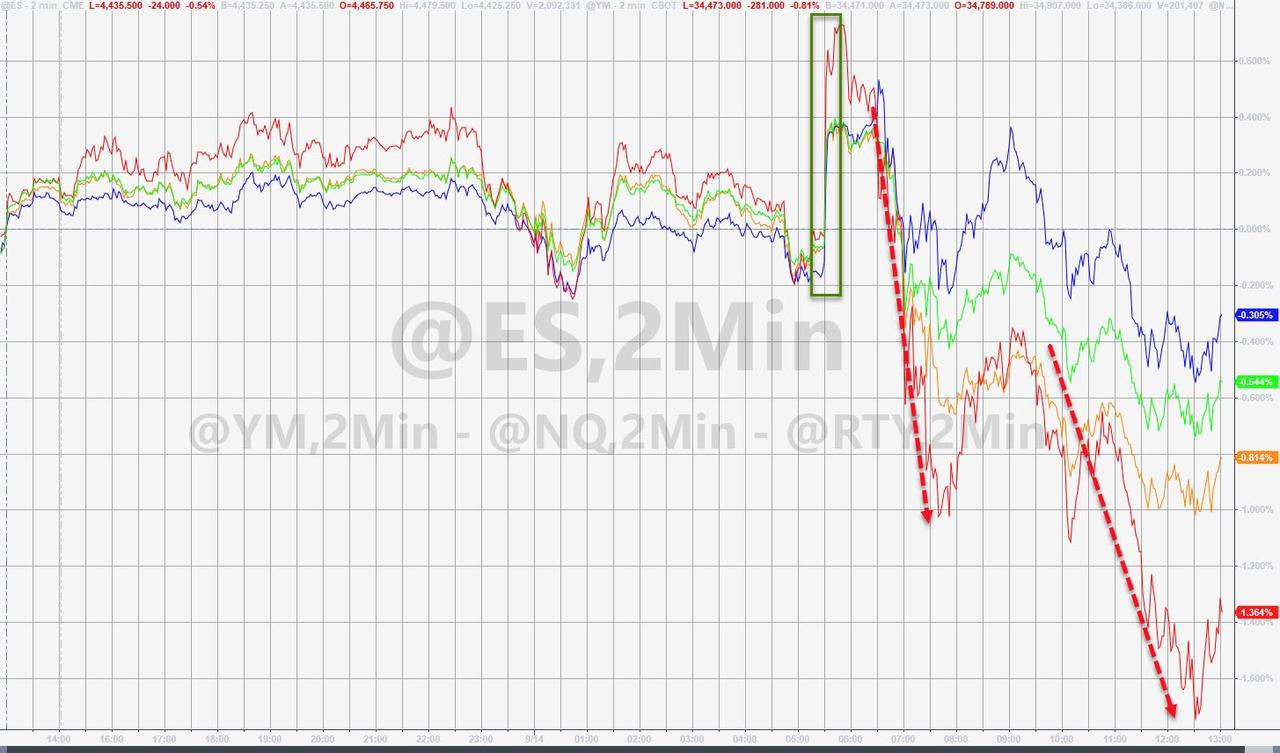
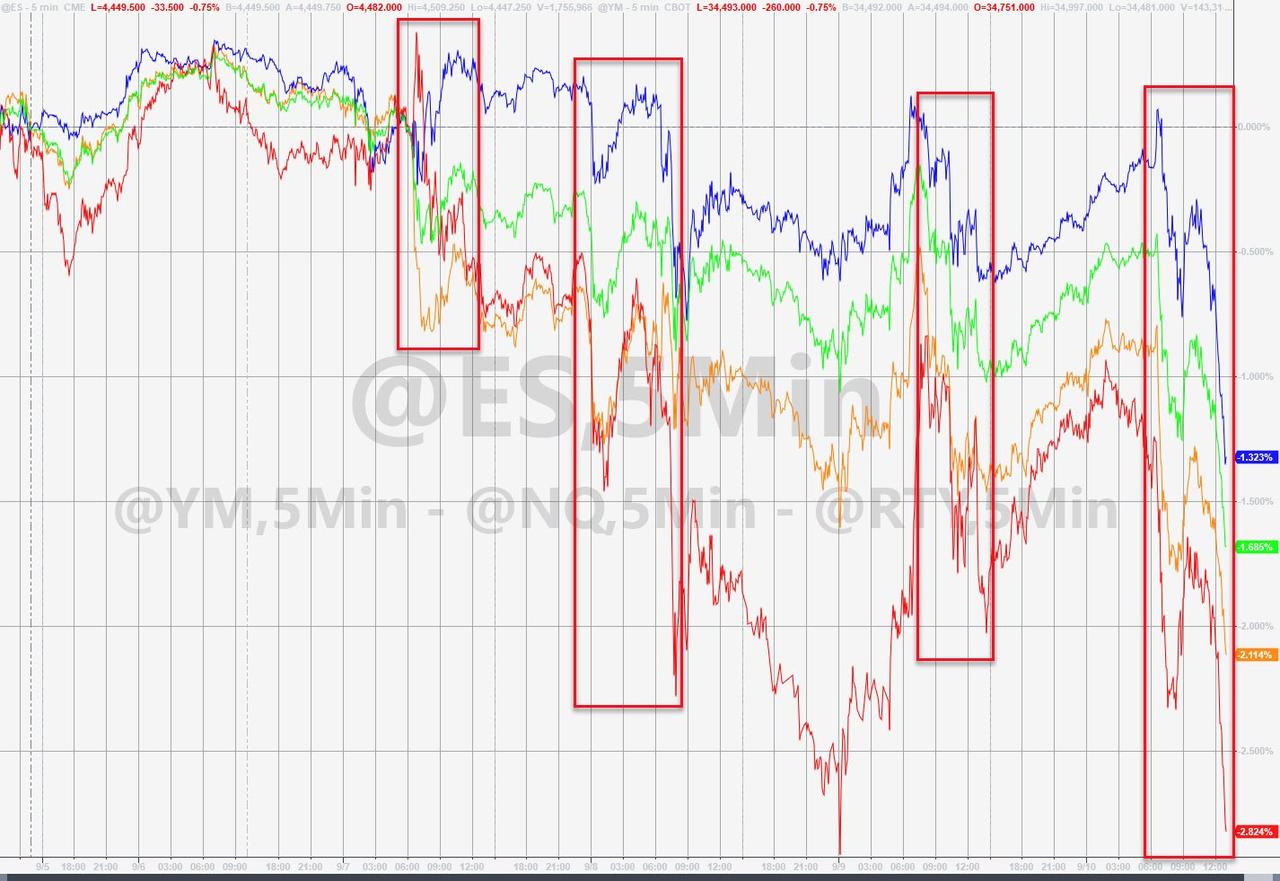
An early purge in the markets was met with a subsequent surge, which propelled the major indexes back to their respective unchanged lines, but only the Nasdaq managed to score a green close.

Retail sales surprised by rising 0.7% MoM, which was exactly the opposite of expectation of a 0.8% MoM drop. Helping this enormous “beat” was a revision of the initial July estimate from a gain to a decline, which makes the validity of this current number questionable.

Meanwhile, the latest weekly unemployment insurance data revealed that 332k first-time claims were filed, a slightly worse number than the 320k expected.

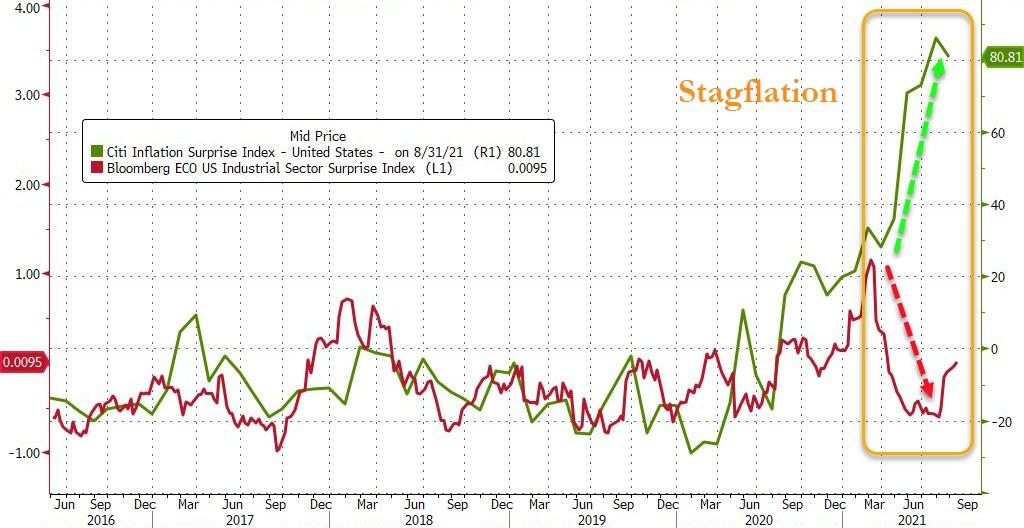
Still, uncertainty about a host of issues affect the markets, which one analyst described like this:

The stress factors facing the market have not materially changed, including the Delta variant, earnings headwinds from supply chain and labor challenges, fiscal and monetary tailwind shifting to headwinds and bubbling concerns around China.

Dip buyers could not resist and got today’s rebound started assisted by another short squeeze, the combination of which wiped out most of the early losses.  

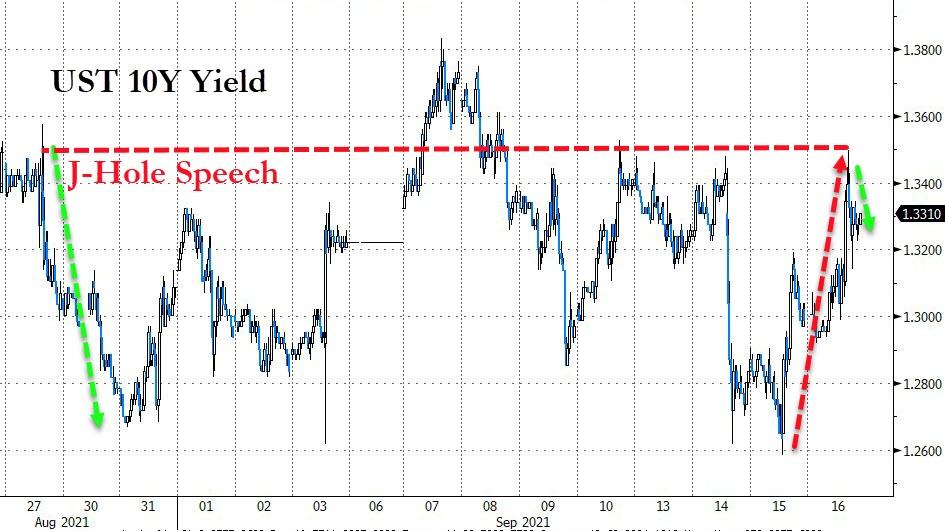
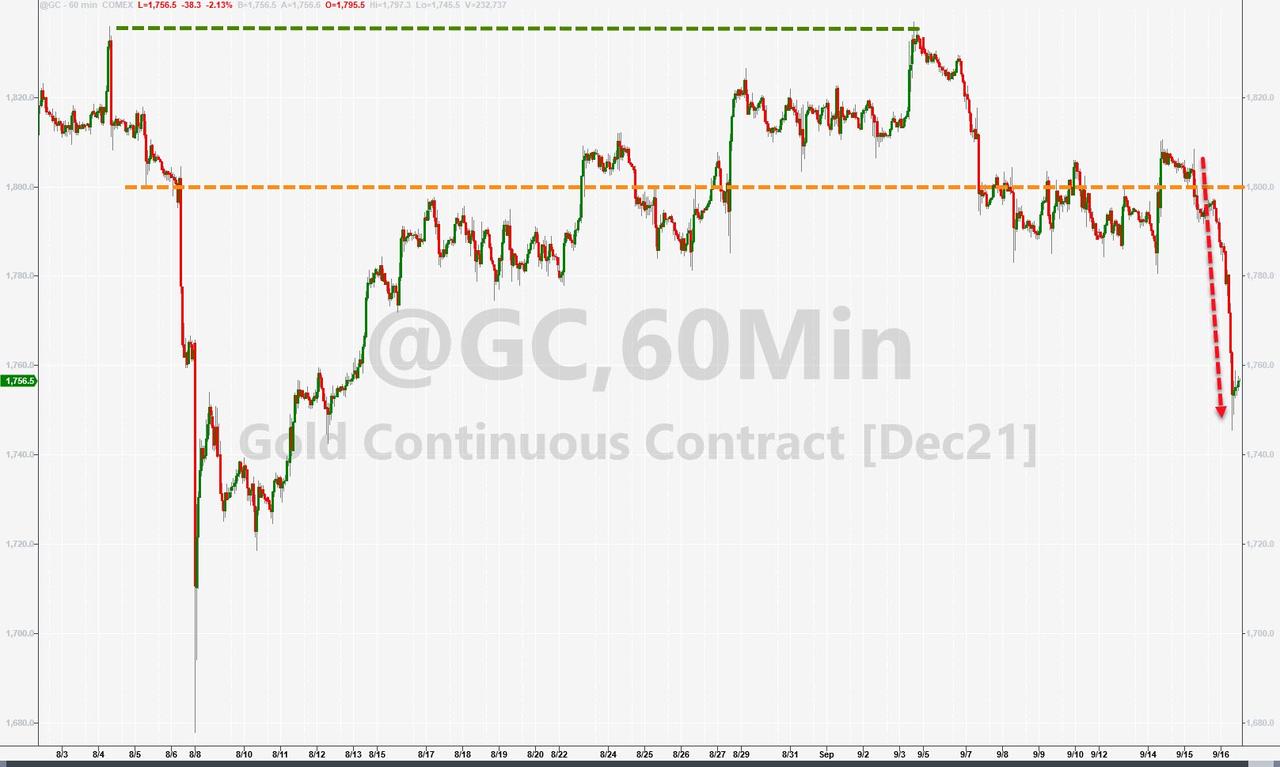
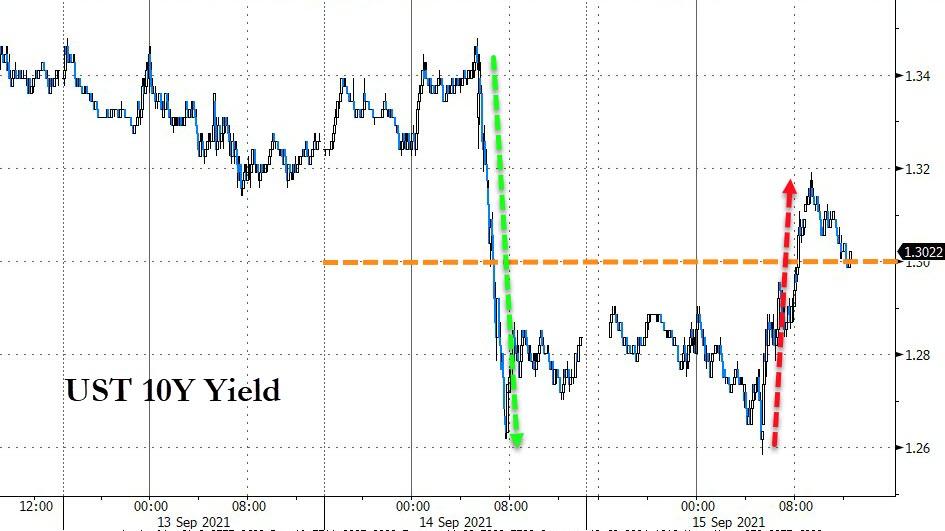
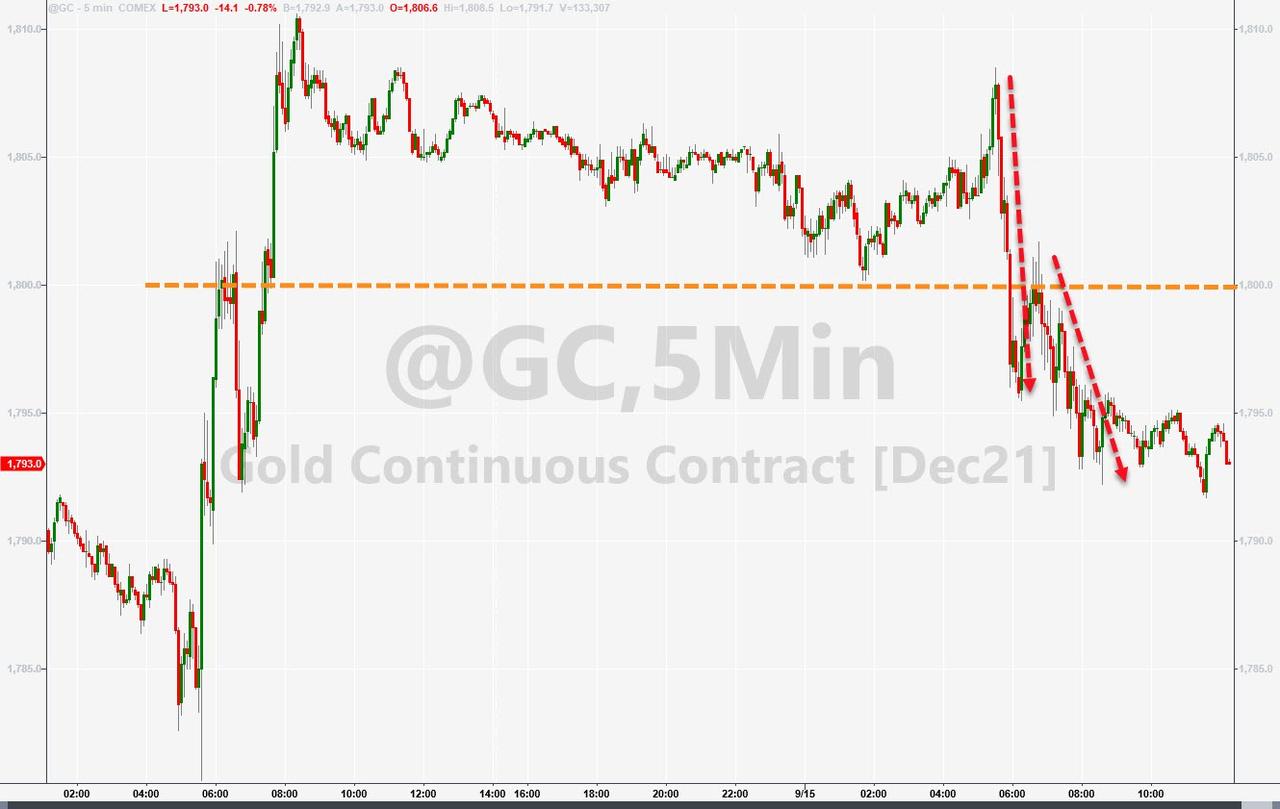
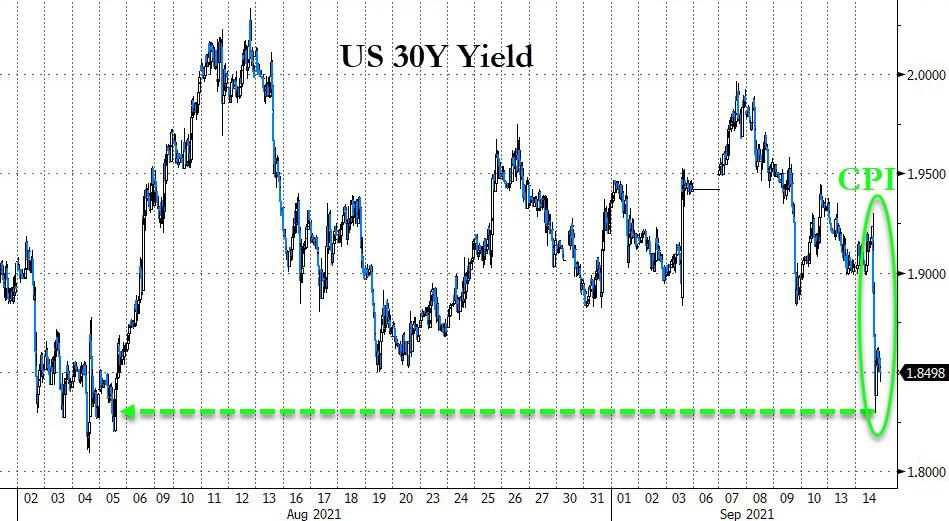
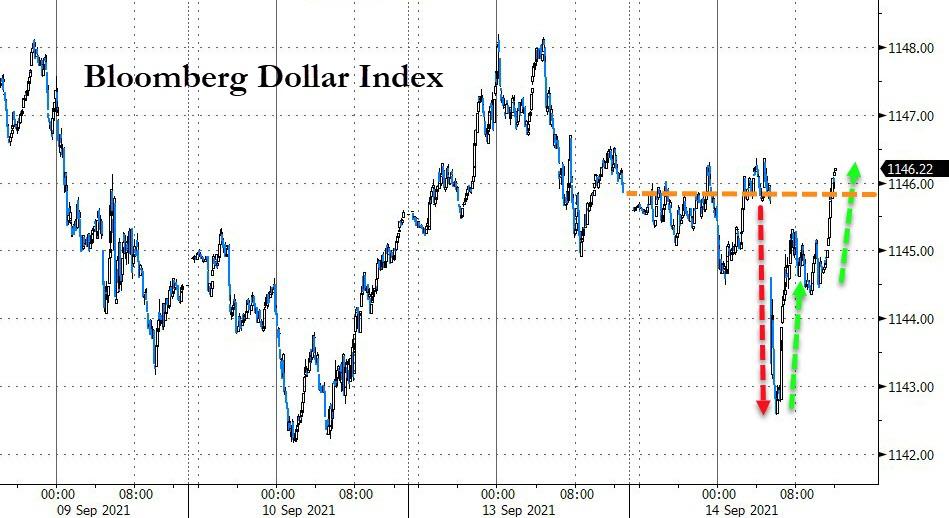
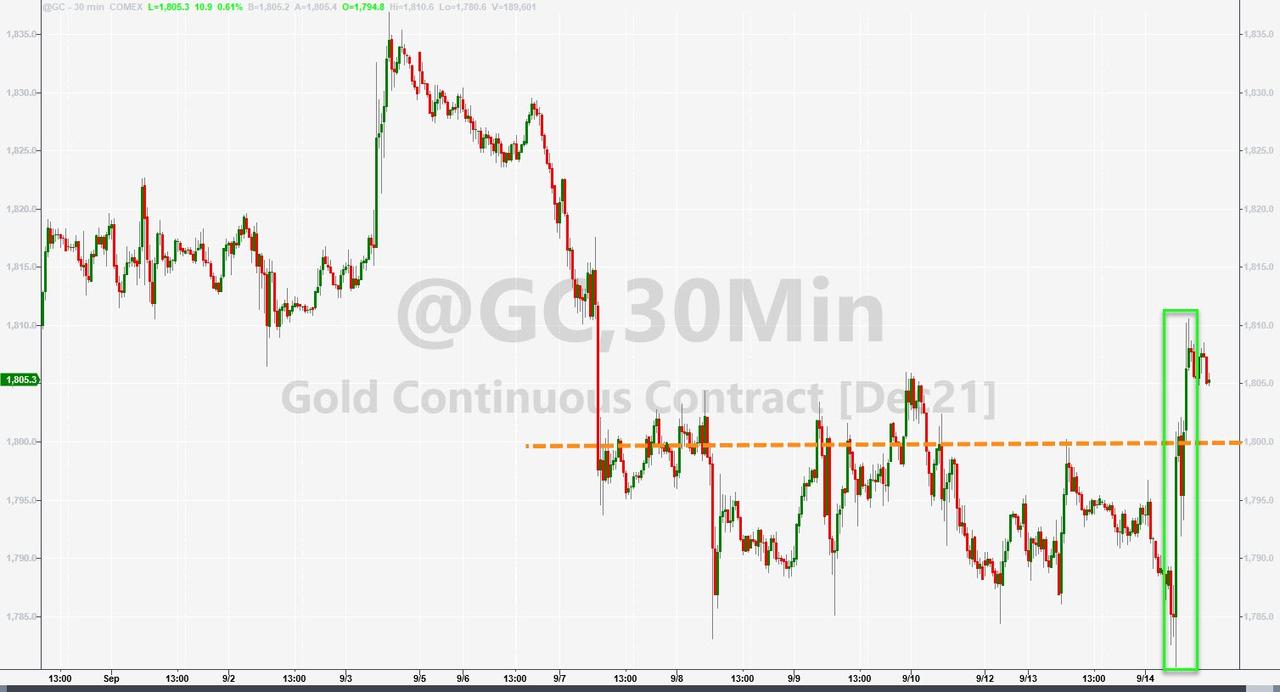
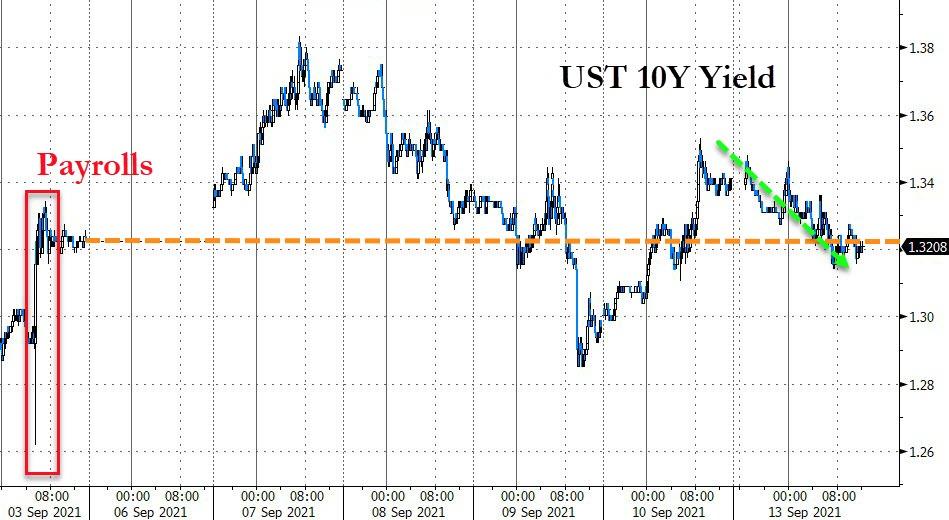
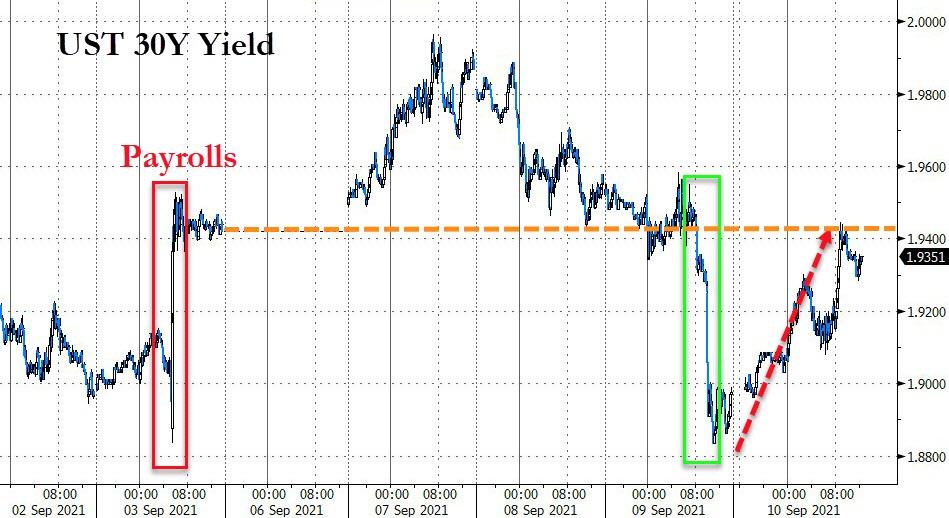
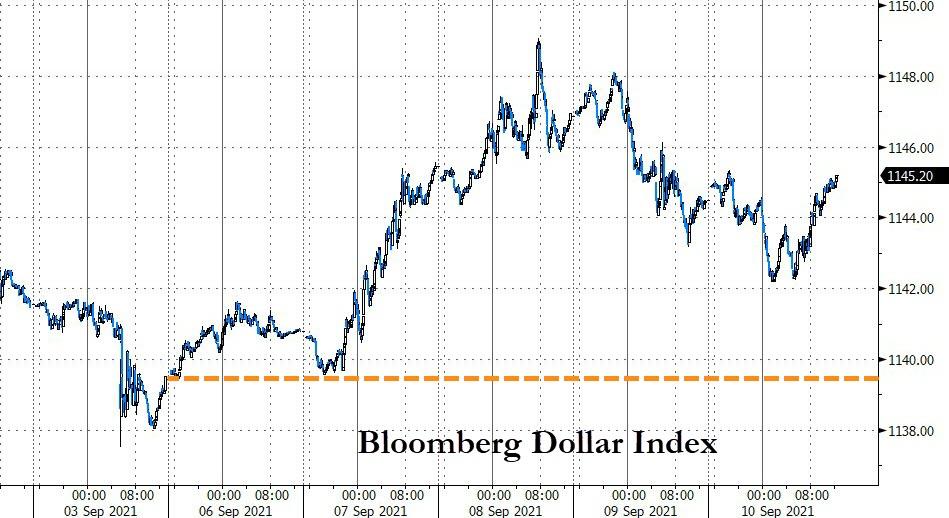
The US Dollar Index spiked, as did Bond yields with the 10-year reaching the 1.33% level. As a result, as we’ve seen many times before, this double punch sent Gold reeling and back below its $1,800 level.  

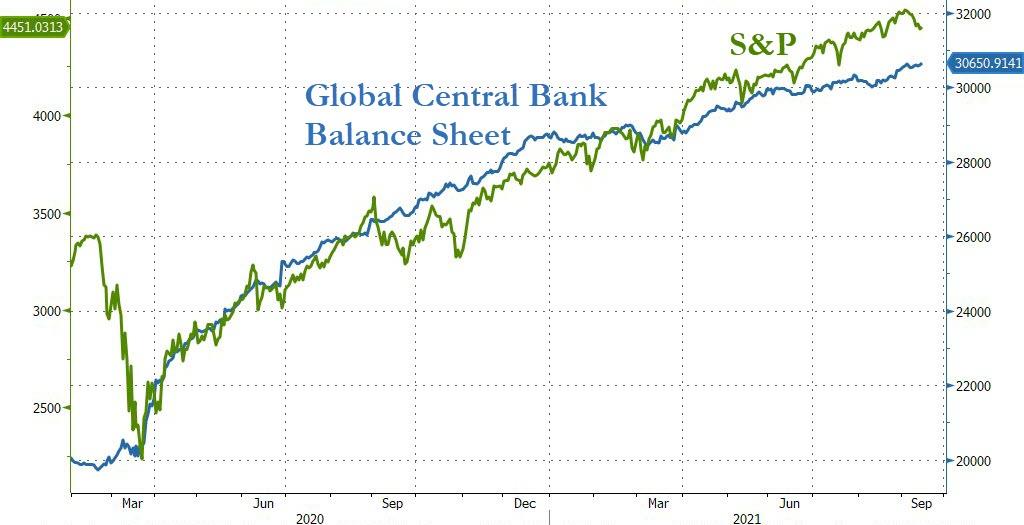
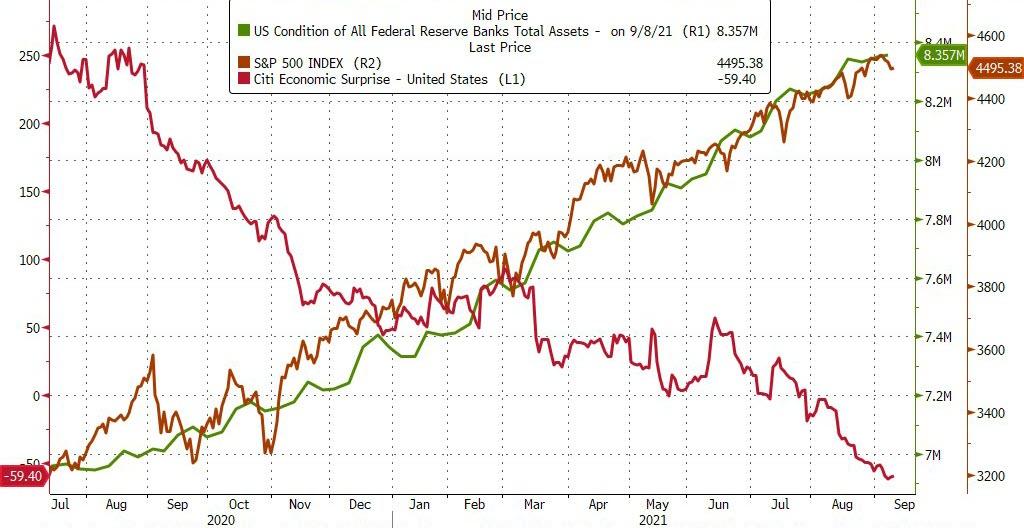
As Bloomberg shows in this chart, the S&P 500 seems to have gotten ahead of reality, namely the Fed’s balance sheet expansion, so a pullback would be in order. It could happen tomorrow during quadruple witching hour, when a huge number of options will expire, which is an event that can wreak havoc with the markets.

As a reminder, I will be out tomorrow, so there will be no market commentary. My regular posting schedule will resume on Monday.  

Continue reading…

2. ETFs in the Spotlight

In case you missed the announcement and description of this section, you can read it here again.

It features some of the 10 broadly diversified domestic and sector ETFs from my HighVolume list as posted every Saturday. Furthermore, they are screened for the lowest MaxDD% number meaning they have been showing better resistance to temporary sell offs than all others over the past year.

The below table simply demonstrates the magnitude with which these ETFs are fluctuating above or below their respective individual trend lines (%+/-M/A). A break below, represented by a negative number, shows weakness, while a break above, represented by a positive percentage, shows strength.

For hundreds of ETF choices, be sure to reference Thursday’s StatSheet.

For this current domestic “Buy” cycle, here’s how some our candidates have fared:

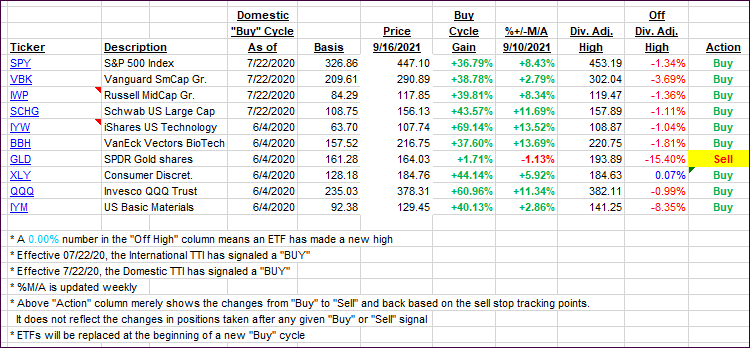
Click image to enlarge.

Again, the %+/-M/A column above shows the position of the various ETFs in relation to their respective long-term trend lines, while the trailing sell stops are being tracked in the “Off High” column. The “Action” column will signal a “Sell” once the -8% point has been taken out in the “Off High” column. For more volatile sector ETFs, the trigger point is -10%.

3. Trend Tracking Indexes (TTIs)

Our TTIs pulled back a tad, as the major indexes dug themselves out of an early hole.

This is how we closed 09/16/2021:

Domestic TTI: +7.45% above its M/A (prior close +7.65%)—Buy signal effective 07/22/2020.

International TTI: +4.52% above its M/A (prior close +4.89%)—Buy signals effective 07/22/2020.

Disclosure: I am obliged to inform you that I, as well as my advisory clients, own some of the ETFs listed in the above table. Furthermore, they do not represent a specific investment recommendation for you, they merely show which ETFs from the universe I track are falling within the specified guidelines.

All linked charts above are courtesy of Bloomberg via ZeroHedge.

Conquering The September Doldrums

Ulli Market Commentary Contact

[Chart courtesy of MarketWatch.com]

  1. Moving the markets

Despite a shaky start, the major indexes found support and managed to overcome the September doldrums, at least for this day. Bullish momentum surfaced with equities accelerating to the upside during the afternoon session, and all three indices closed the day with solid gains.

While the battle between Small Caps (VBK) and Value (RPV) continued unabated, both gained, but the latter outperformed the former by a 2:1 ratio. Helping to stabilize bullish sentiment early on was the Empire manufacturing index, which not only accelerated in August but also beat 18 consensus estimates.

Anxiety about the upcoming Debt ceiling discussions, were moved to the front burner again, yet did not hamper equities but pulled the US Dollar lower, while pushing bond yields higher with the 10-year closing at the 1.3% level.

This combination did not work well for Gold, which slipped and lost its $1,800 level again.

In the end, as Bloomberg charted here, inflation remains with us, with the Industrial Sector Surprise Index limping lower, which translates into the dreaded “S” word, namely Stagflation. Hmm, as Zero Hedge put it, that could be the Fed’s worst nightmare scenario.

Read More

Another Rally Bites The Dust

Ulli Market Commentary Contact

[Chart courtesy of MarketWatch.com]

  1. Moving the markets

Except for yesterday, we have seen the pattern of an early bump getting pounded in the afternoon during all last week. While Monday instilled some confidence in traders’ minds that the bullish meme is still alive, that mantra was smashed today with the major indexes spending most of the session below their respective unchanged lines.

Even a better-than-expected inflation report could not stop the bears from taking over and sending the indexes to another red close. Despite the downward trend during 6 out of the last 7 sessions, the losses were moderate and certainly not out of line given the relentless march higher during this year.

The CPI came in slightly below expectations at 0.3% MoM vs. 0.4% MoM expected and printed at 5.3% YoY, which was in line with forecasts. Still, this is a significant jump, despite one analyst calling it “continued easing in the inflation piece without deterioration in the economic outlook.”  We’ll revisit that wishful thought next month.

There was no place to hide, as “red” was the dominant color of the session, with the Dow and Small Caps having their worst day since mid-July, as ZeroHedge posted, but “value,” as represented by RPG, had its own issues by giving back just about all of yesterday’s gains.

Bond yields plummeted with the 30-year heading to 6-week lows. The US Dollar index swan dived, reversed, and recovered all its early losses. Every bit of this uncertainty proved to be a boon for gold, with the precious metal not only gaining 0.68% but also climbing back above its $1,800 level.

With Friday’s quadruple witching hour (options expirations) on deck, it looks like volatility will be with us for a while.

Read More

Maintaining Equilibrium

Ulli Market Commentary Contact

[Chart courtesy of MarketWatch.com]

  1. Moving the markets

For a change, an early rally maintained its momentum throughout the session, despite a temporary mid-day pullback, with two of the three major indexes finally eking out a gain, following five days of losses. The Nasdaq trailed and closed slightly in the red, after dancing around its unchanged line all day.

Small Caps dipped but “value” ripped, with RPV gaining a solid +1.56% after nibbling at its trailing sell stop last Friday.

Still, today’s bounce back was subdued and a far cry from convincing traders that the bullish theme is back on. After all, we are in the middle of one of the historically most volatile months, during which anything is possible. The S&P 500 was saved only by late-session bidding, which pulled the index out of the red.

Spraying to all fields:

Bond yields dropped, as nervousness over the upcoming debt ceiling debacle moved front and center.

The US Dollar bounced without clear direction but managed to hang on to modest gains.

Gold popped and dropped but ended slightly higher yet still short of recapturing its $1,800 level.

Inflation is here to stay, despite jawboning to the contrary, as the Commodity Spot Index rallied to a 10-year high.  

This week’s posting schedule will be slightly different due to me being out of town on Friday. You can see the latest update here.

Read More

ETFs On The Cutline – Updated Through 09/10/2021

Ulli ETFs on the Cutline Contact

Below, please find the latest High-Volume ETF Cutline report, which shows how far above or below their respective long-term trend lines (39-week SMA) my currently tracked ETFs are positioned.

This report covers the HV ETF Master List from Thursday’s StatSheet and includes 312 High Volume ETFs, defined as those with an average daily volume of more than $5 million, of which currently 249 (last week 264) are hovering in bullish territory. The yellow line separates those ETFs that are positioned above their trend line (%M/A) from those that have dropped below it.

Take a look:                                                                   

The HV ETF Master Cutline Report

In case you are not familiar with some of the terminology used in the reports, please read the Glossary of Terms. If you missed the original post about the Cutline approach, you can read it here.      

ETF Tracker Newsletter For September 10, 2021

Ulli ETF Tracker Contact

ETF Tracker StatSheet          

You can view the latest version here.

PUKING INTO THE WEEKEND

[Chart courtesy of MarketWatch.com]

  1. Moving the markets

Another opening bounce in the markets turned out to be fake with the major indexes hitting the skids and not only diving into the weekend but also closing at the lows of the session with breadth worsening.

This marks the 5th day in a row of losses although, for this Holiday shortened week, the S&P 500 dipped only 1.67%, which is modest given the strong advances we have seen. Nevertheless, it’s the index’s worst week since about the middle of June.


Added ZeroHedge:

Every dip that was bought this week was met with more selling… that is NOT what the doctor ordered!! Everything looked great overnight but the cash equity open saw the selling begin and barely stop and the close was really ugly…

Apple didn’t help matters with the stock sliding some 3% due to a ruling that the tech giant no longer can force developers to use in app purchasing, which means, simply stated, they must give up some of their monopoly position.

What really hurt the markets and took a huge bite out of the Fed’s credibility stating that inflation is transitory, was the August Producer Price Index (PPI), which reflects a more realistic state of inflationary forces. The PPI showed wholesale costs for businesses rising 8.3% per annum, which was the biggest advance since 2010. For the month, the index raced ahead by 0.7%.

Bond yields rose, the US Dollar rallied, and Gold again was pulled below its $1,800 level. There was no place to hide with “SmallCaps” and “Value” all showing red numbers.

The question now remains whether there is more downside to come, and if so, will it be enough to trigger our trailing sell stops and subsequently our Trend Tracking Indexes (TTIs)?

No one has that answer, and we will have to wait and see how things play out, but this chart by Bloomberg indicates the ever-widening alligator gap, which eventually will snap shut.

Read More