
- Moving the markets
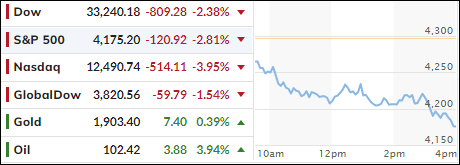
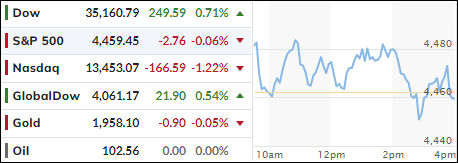
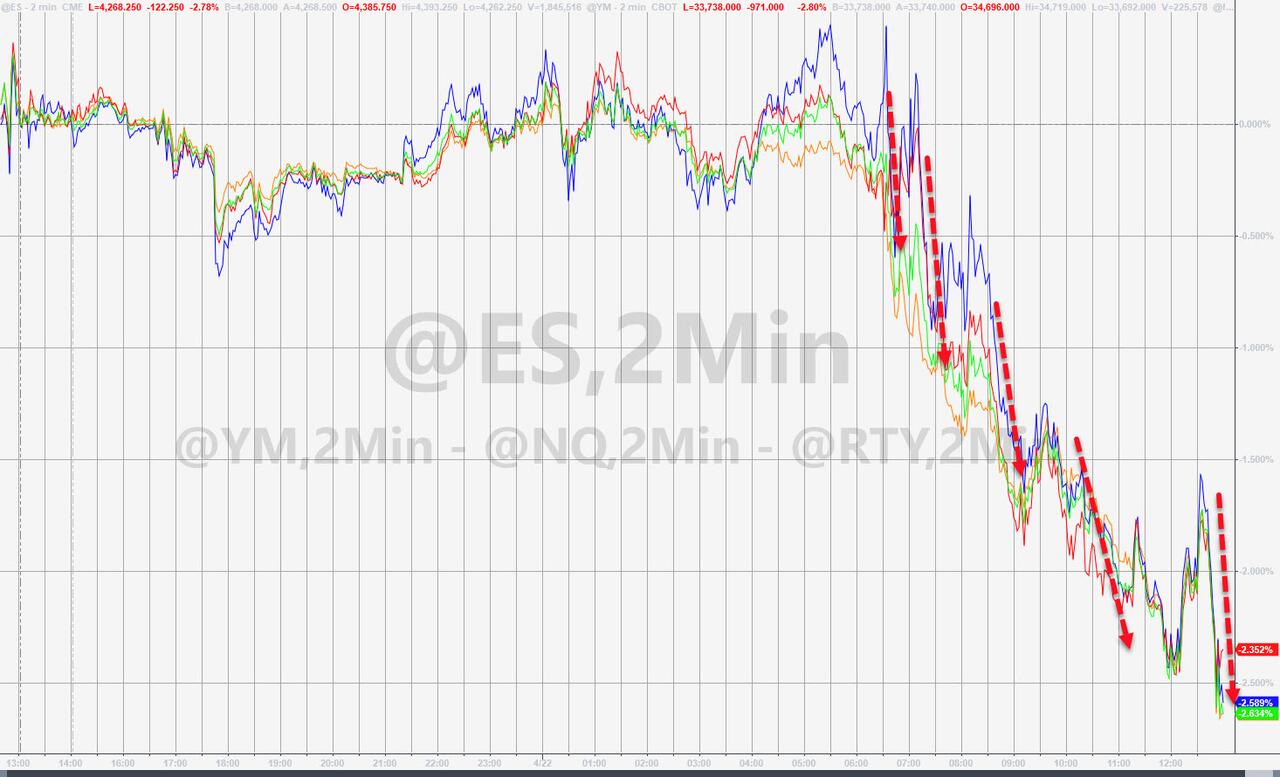
The Nasdaq sustained its recent weakness and plunged some 4% in part due to increasing anxiety ahead of the quarterly earnings reports from the big players like Microsoft and Alphabet (Google) due out this afternoon. The recent Netflix blow-up is still on every trader’s mind.
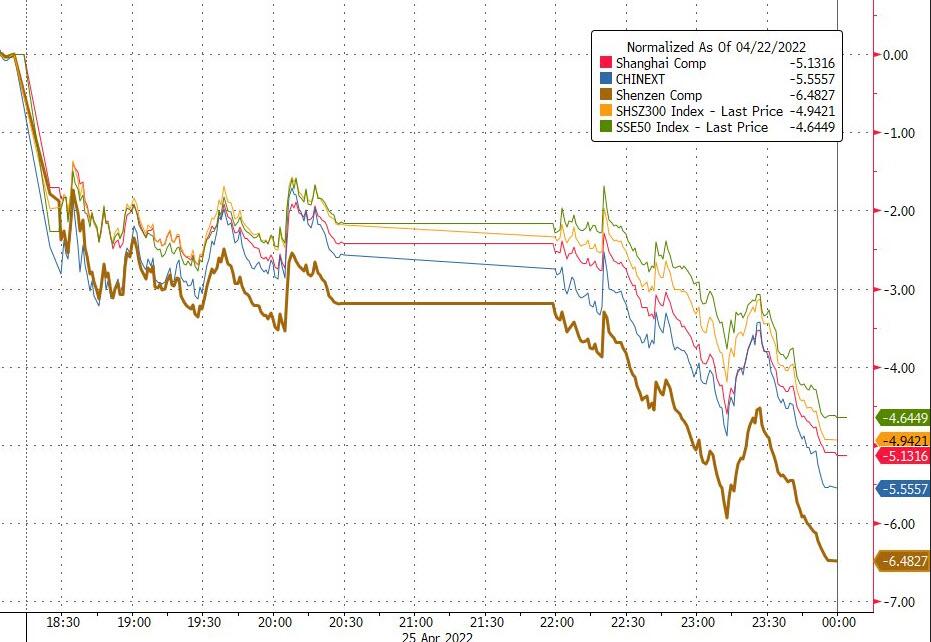
However, today’s weakness was also assisted by the usual fears, namely the global economy as whole, the Covid surge in China, the war in Ukraine, increasing inflation numbers in the U.S., and the seemingly never-ending supply chain issues.
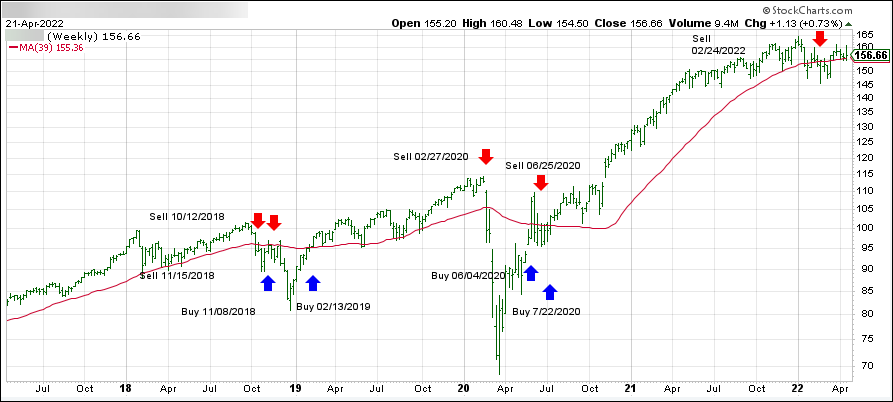
So far, April has not been kind to domestic equities with the S&P 500 having lost -7.8%, the Nasdaq being down -12.2%, while the Dow fared the best with only a -4.2% drop. This pretty much confirms the bearish position of my Domestic TTI (since 2/24/22), now below its trend line by -3.90%, to either be totally out of domestic equities or only have limited exposure.
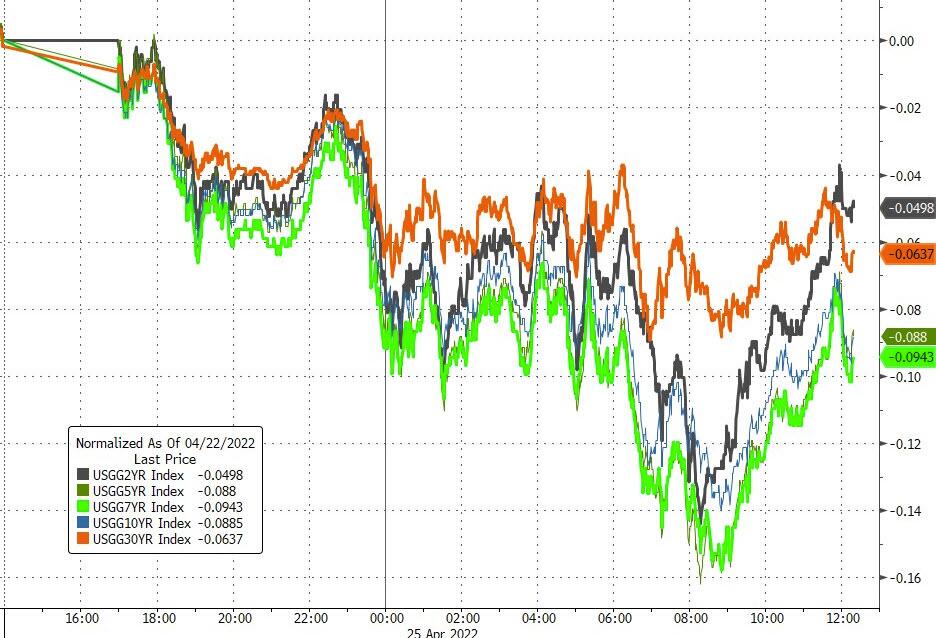
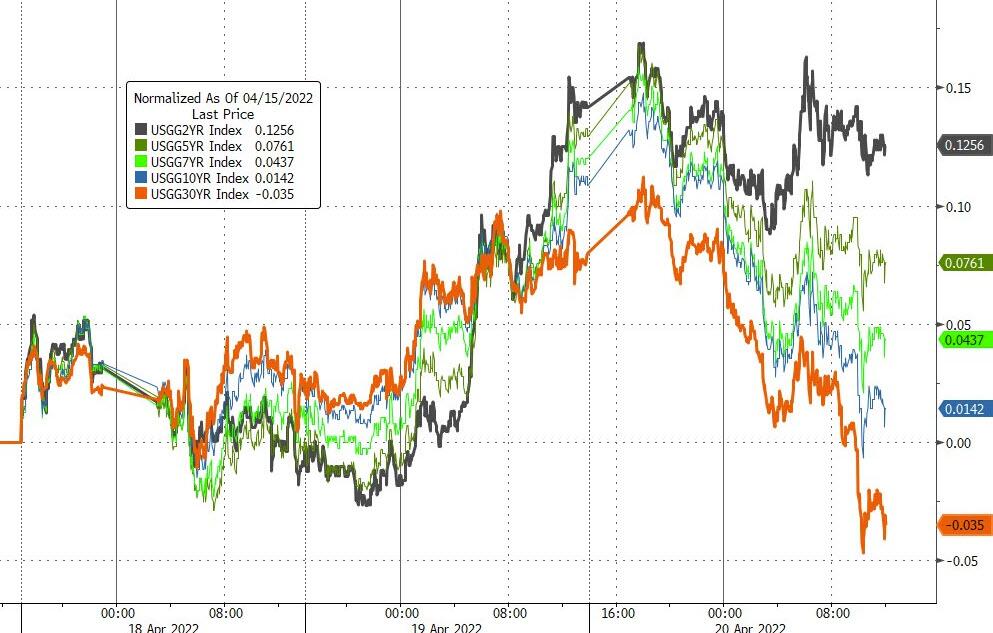
And if you thought bonds would have helped to offset some these losses, you would have been wrong, because the widely held 20-year T-Bond ETF TLT lost -7.3% month to date. Ouch! As I posted before, in this high interest rate environment, bonds are no longer a “safe” haven.
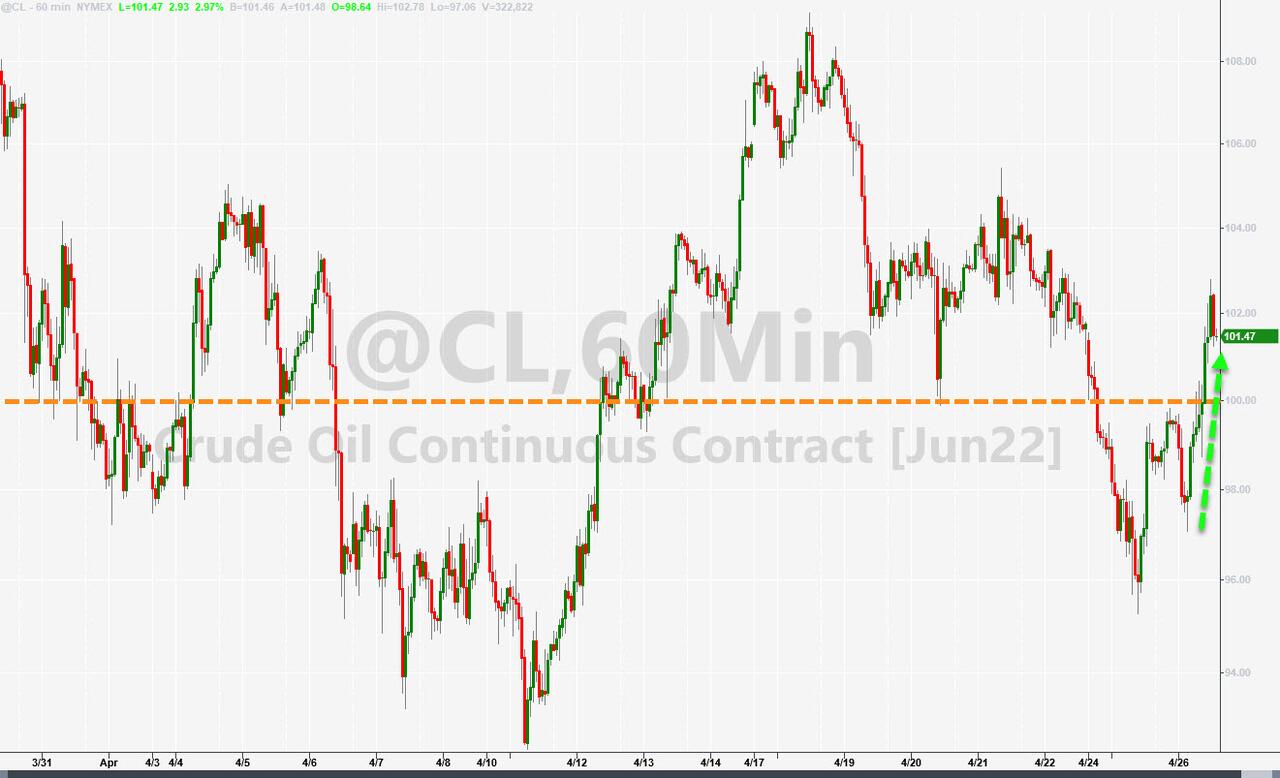
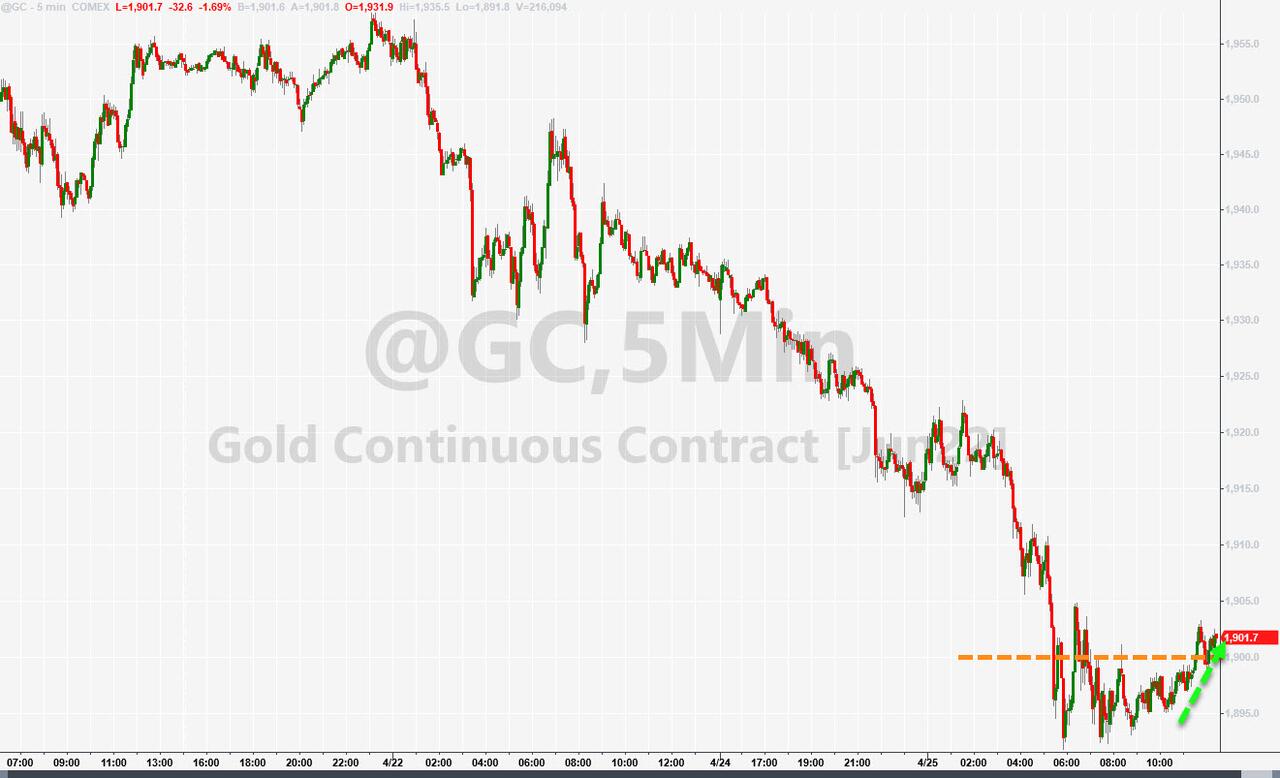
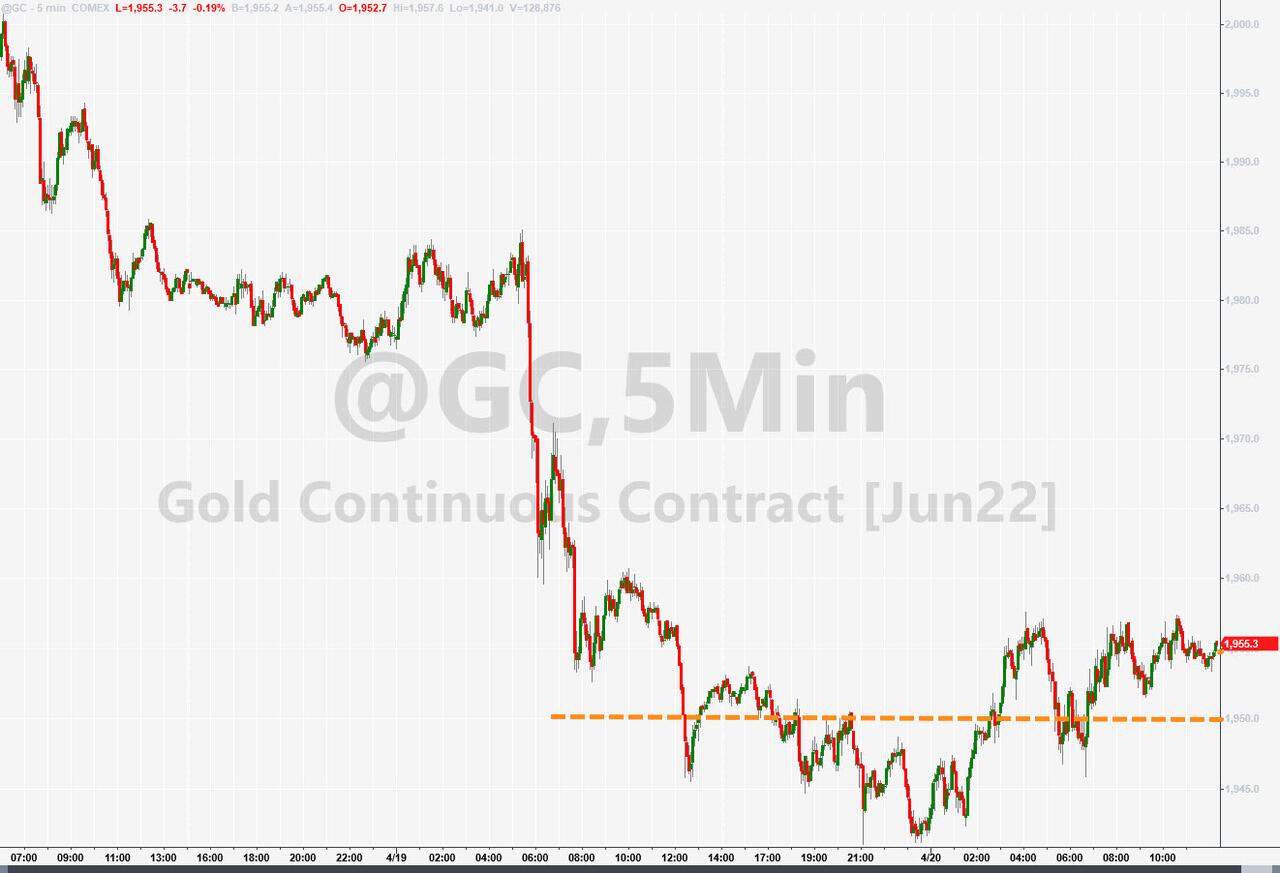
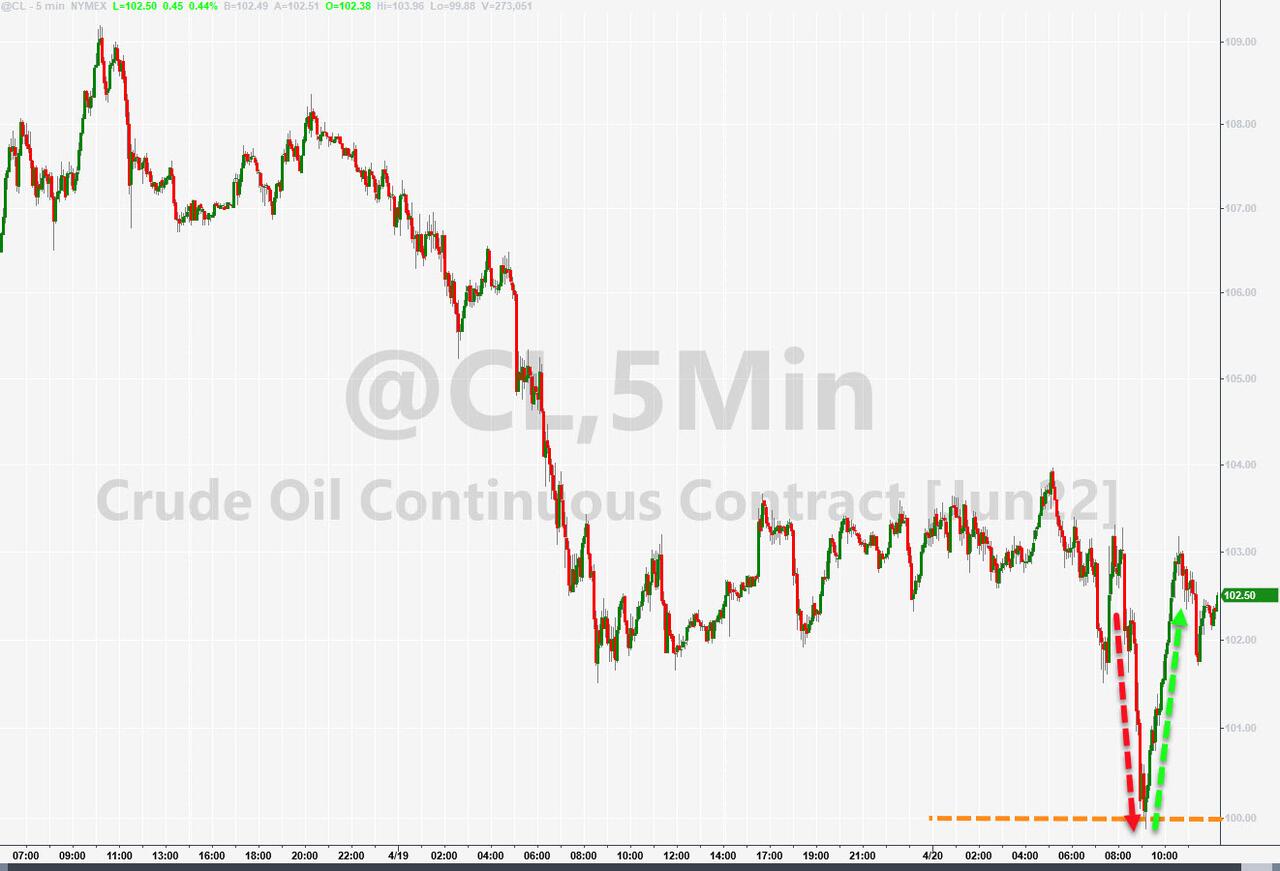
In the end, there were not many places to hide. Energy bounced back nicely but ended the session unchanged. Commodities showed signs of life with DBC adding +1.37%, and gold managed to rebound but only by a meager +0.45%.
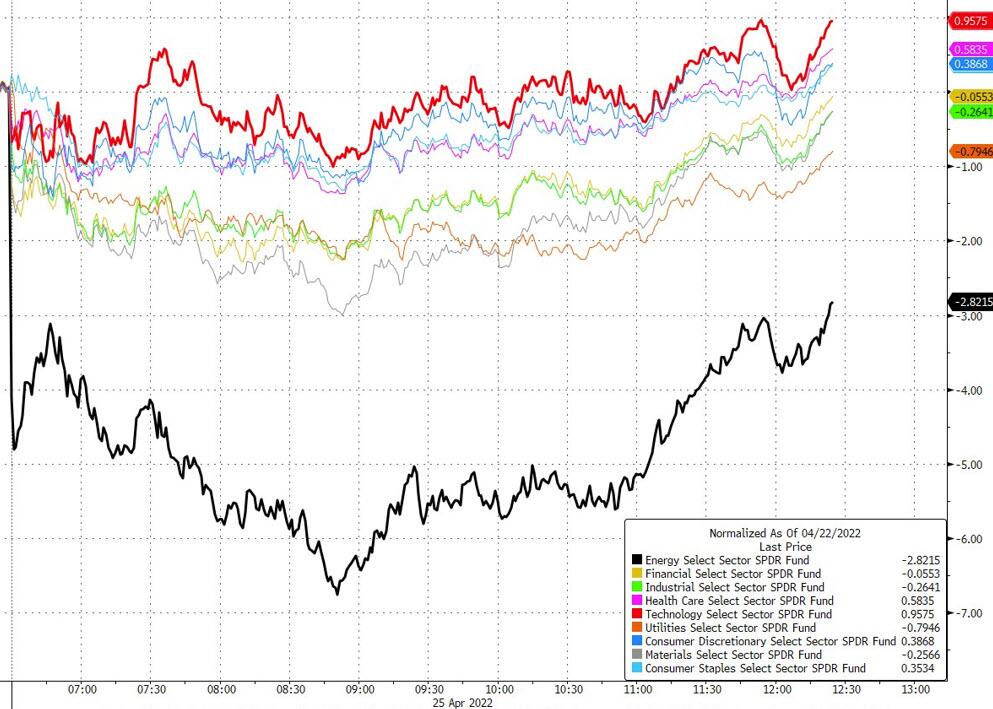
When the entire equity spectrum is down considerably, owning some sector ETFs with small gains will substantially mitigate the negative effects of the domestic equity arena.
Read More