
- Moving the markets
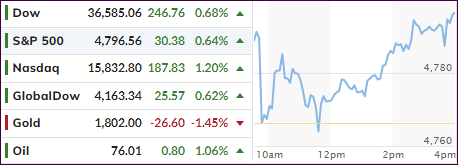
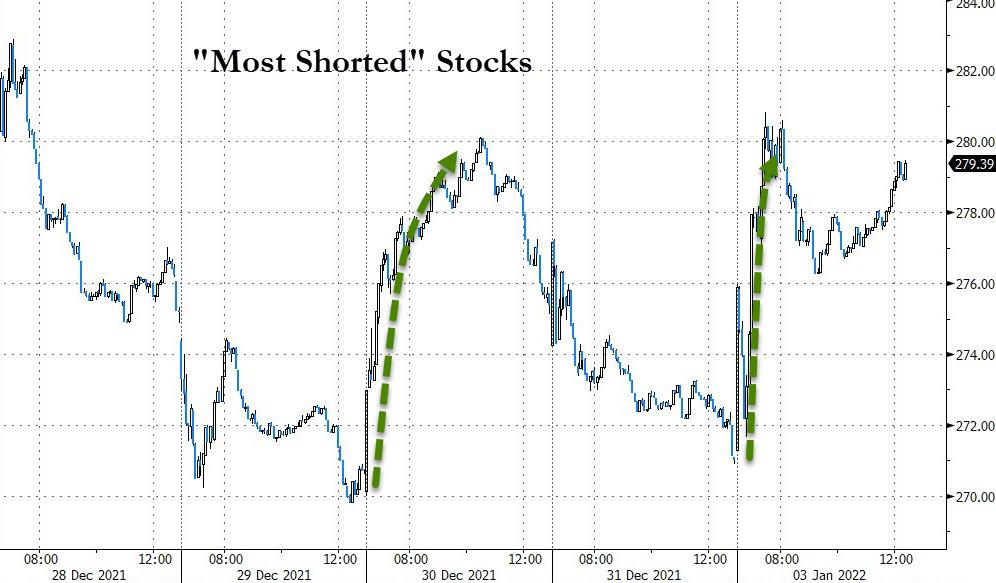
We’re still in the last two days of the peculiar Santa Claus rally, with the major indexes overcoming early weakness and then welcoming the new year with a rally, as the Dow scored another record close. None of this would have been possible without the usual short squeeze, which helped the bullish cause.
The value ETF RPV won the battle against the growth ETF RPG with a gain of 1.27% thereby continuing its domination from last year.
Traders are now betting on the idea that the economy is strong enough to overcome the latest surge in Covid cases, which pushed Apple into nosebleed territory by becoming the first company ever with a $3 trillion market cap. Not wanting to be left behind was Tesla, which stormed ahead by an amazing 13.5%.
Furthermore, optimism currently prevails that that both, the economy and corporate profits, are providing the necessary assistance to justify the ever-rising equity prices. That is until Fed policy changes and stronger anti-inflationary measures will have to be implemented.
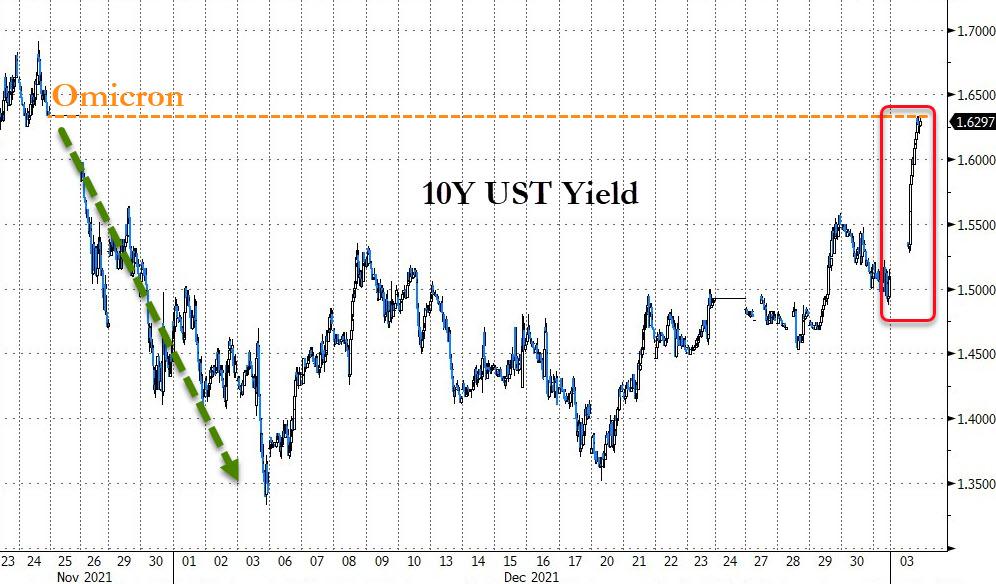
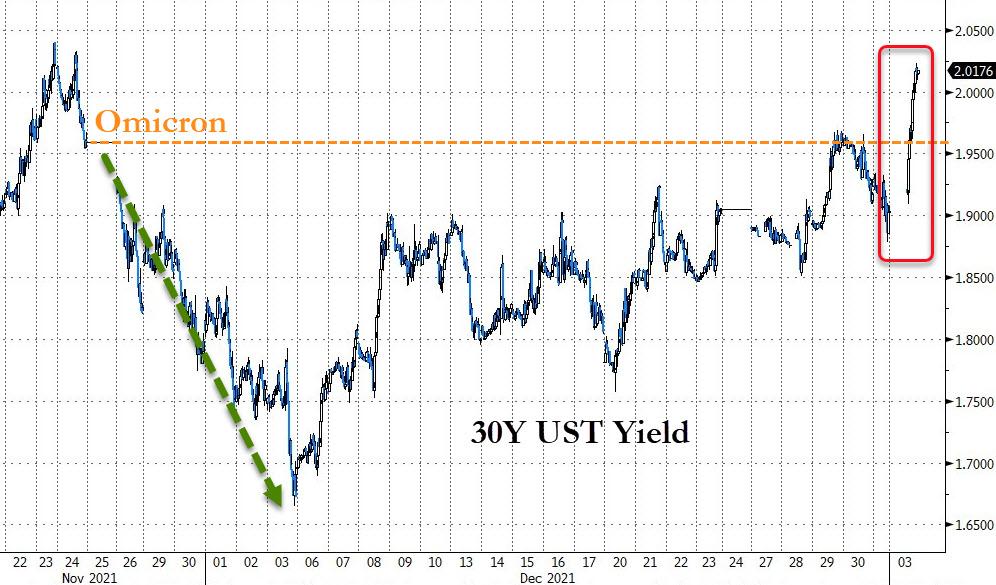
Bonds got clobbered as yields surged with the 10-year jumping above the 1.60% level, while the 30-year spiked above 2% and way above the Omicron level. With interest rates on the move, the US Dollar joined the party by rising sharply.
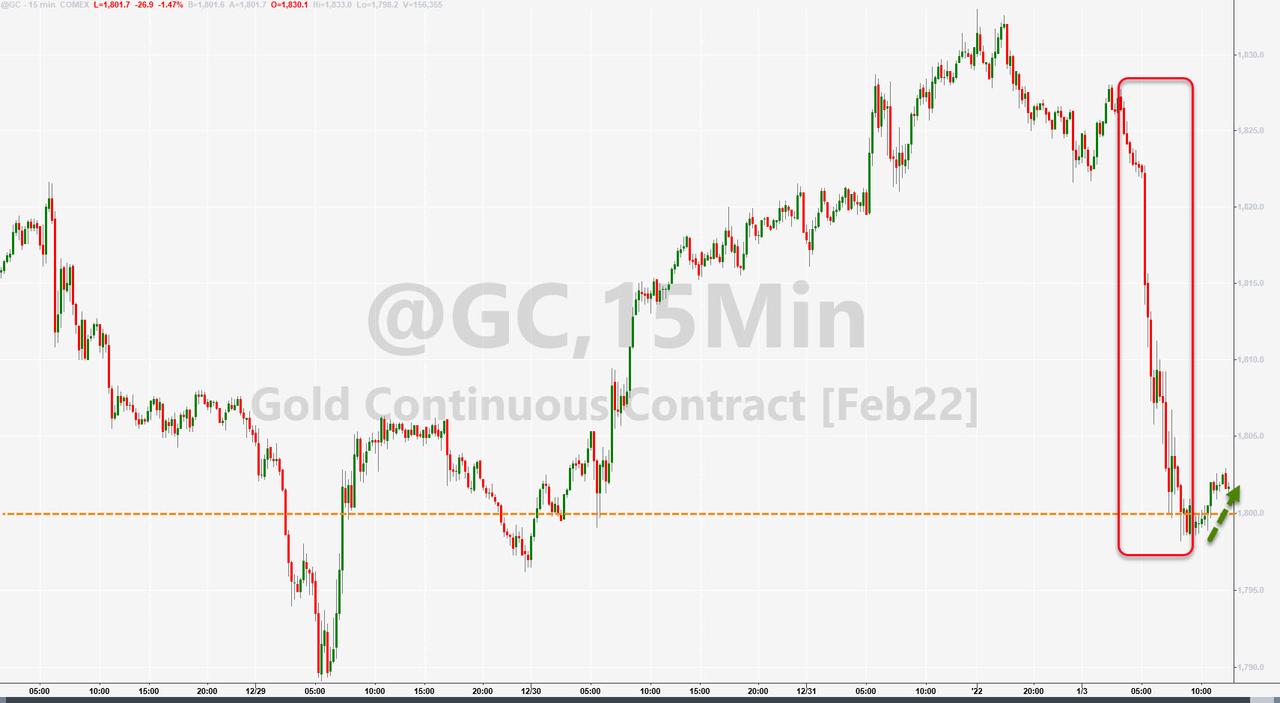
And, as is usually the case, this combination of rising yields and US Dollar delivered a punch to gold, which dropped 1.45% but successfully defended its $1,800 level.
2. ETFs in the Spotlight
In case you missed the announcement and description of this section, you can read it here again.
It features some of the 10 broadly diversified domestic and sector ETFs from my HighVolume list as posted every Saturday. Furthermore, they are screened for the lowest MaxDD% number meaning they have been showing better resistance to temporary sell offs than all others over the past year.
The below table simply demonstrates the magnitude with which these ETFs are fluctuating above or below their respective individual trend lines (%+/-M/A). A break below, represented by a negative number, shows weakness, while a break above, represented by a positive percentage, shows strength.
For hundreds of ETF choices, be sure to reference Thursday’s StatSheet.
For this current domestic “Buy” cycle, here’s how some of our candidates have fared:
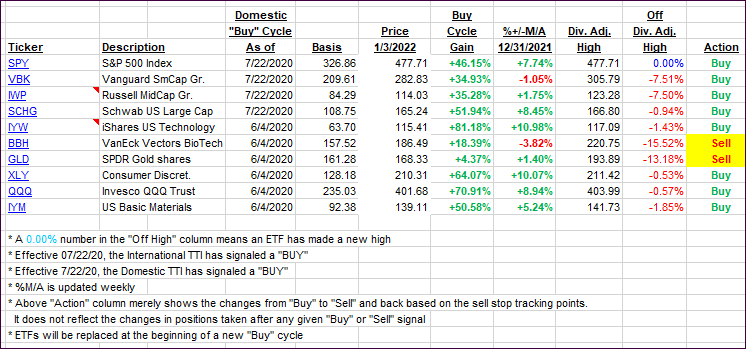
Click image to enlarge.
Again, the %+/-M/A column above shows the position of the various ETFs in relation to their respective long-term trend lines, while the trailing sell stops are being tracked in the “Off High” column. The “Action” column will signal a “Sell” once the -12% point has been taken out in the “Off High” column, which has replaced the prior -8%/-10% numbers.
3. Trend Tracking Indexes (TTIs)
Our TTIs edged up a tad with the International displaying more strength.
This is how we closed 01/03/2022:
Domestic TTI: +6.52% above its M/A (prior close +6.47%)—Buy signal effective 07/22/2020.
International TTI: +3.36% above its M/A (prior close 2.72%)—Buy signal effective 07/22/2020.
Disclosure: I am obliged to inform you that I, as well as my advisory clients, own some of the ETFs listed in the above table. Furthermore, they do not represent a specific investment recommendation for you, they merely show which ETFs from the universe I track are falling within the specified guidelines.
All linked charts above are courtesy of Bloomberg via ZeroHedge.
Contact Ulli