
ETF Tracker StatSheet
You can view the latest version here.
LOSING STEAM
- Moving the markets
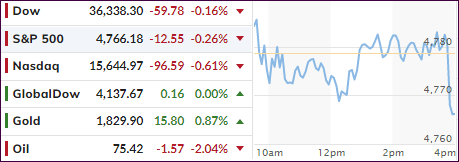
The last couple of trading days were marked by low volume and some lack of buying interest, which caused the major indexes to glide into the end of 2021.
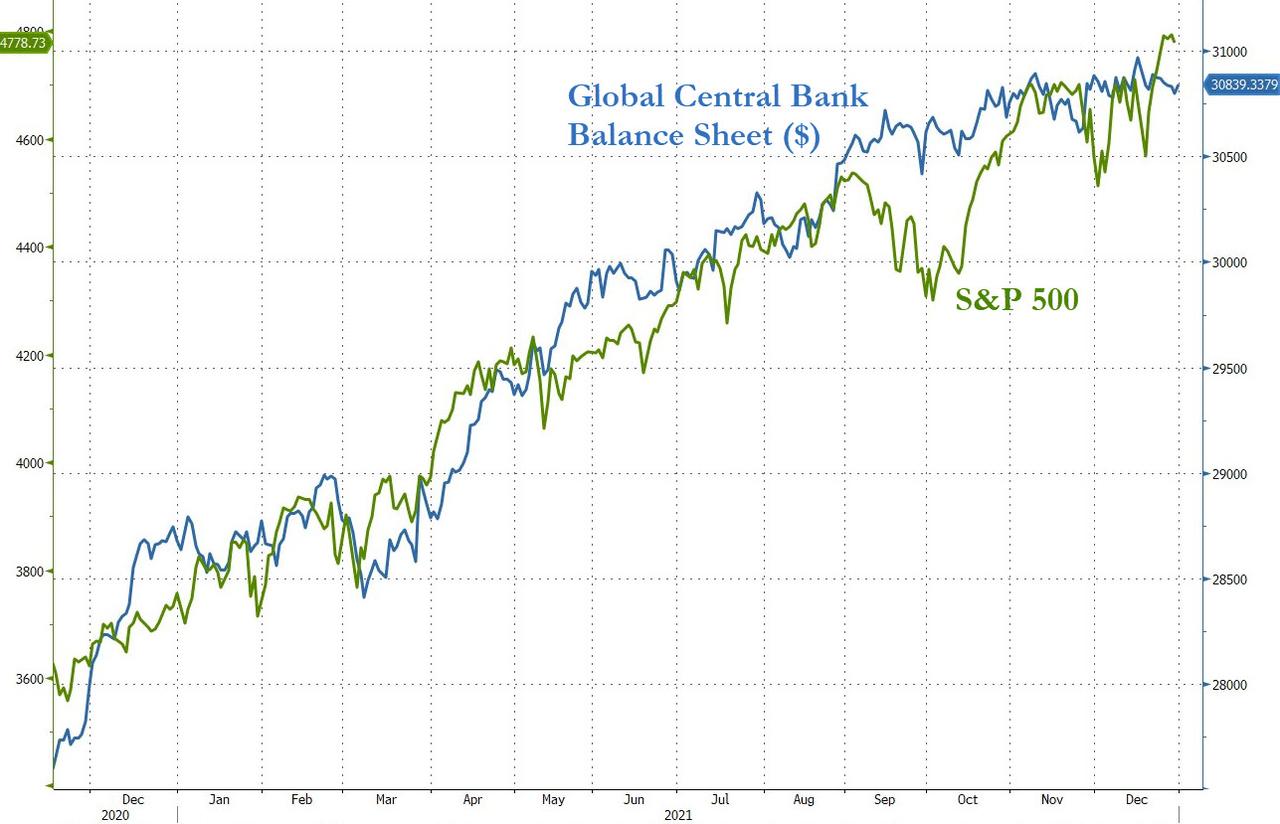
Still, the markets closed out a very bullish year thanks only to the largesse of the Fed and its supportive dovish policies, without which we would not have seen some of the double digit the gains that materialized.
Yes, words like “highly accommodative fiscal and monetary policies” best describe the assist the Central Banks gave as the global economies attempted to recover from the 2020 Covid lockdowns. Corporate earnings also helped with FactSet estimating the YoY earnings growth rate for 2021 to be 45.1%, its highest annual growth since the company began tracking the metric in 2008.
Looking under the hood, the advances were not always broad based with some index’s performance being supported by only a handful of stocks. Some ETFs, like value and growth, rode a wild roller coaster causing our sell stops to kick in and exit those positions.
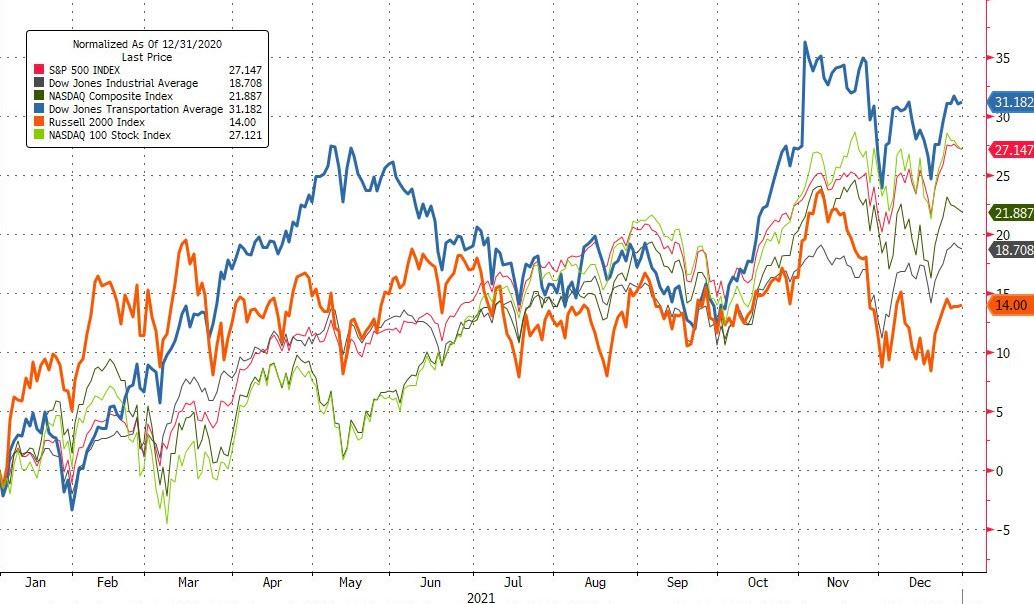
As ZeroHedge pointed out, the Dow and S&P 500 managed to close around 1-2% higher since the Omicron’s unleashing. The Nasdaq faded in the red today, and SmallCaps are down almost 4% since the new variant headlines hit, as this chart demonstrates.
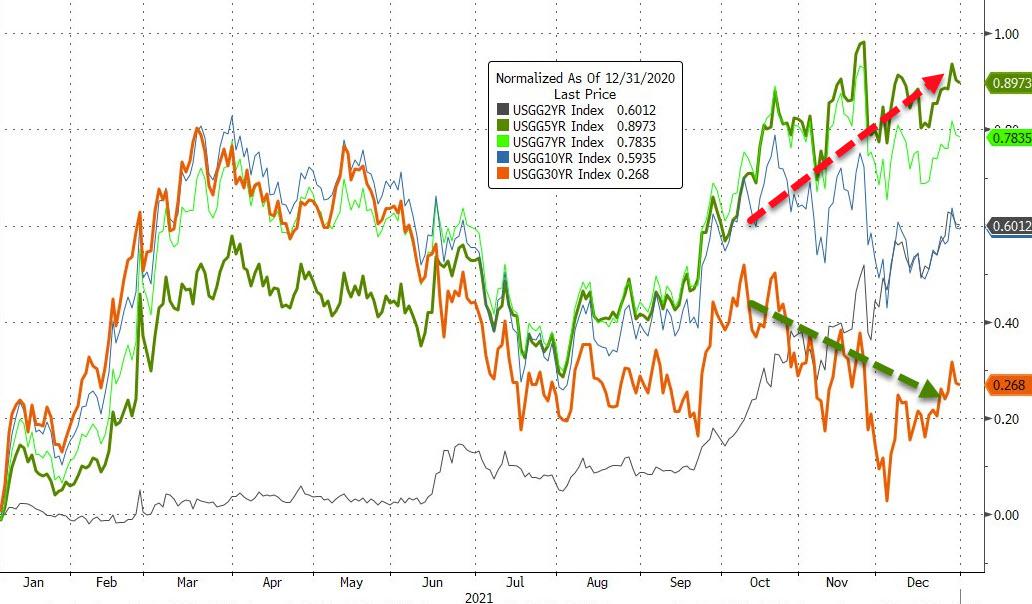
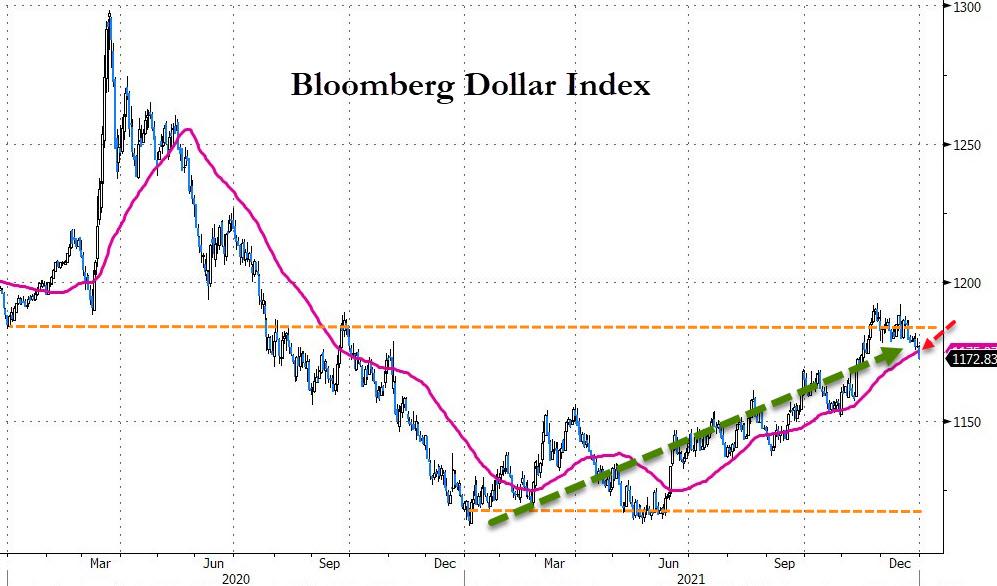
Bond yields were higher on the year with long-term issues rallying while the short term ones slipped in the last quarter. The US Dollar index ended higher but faded into the close.
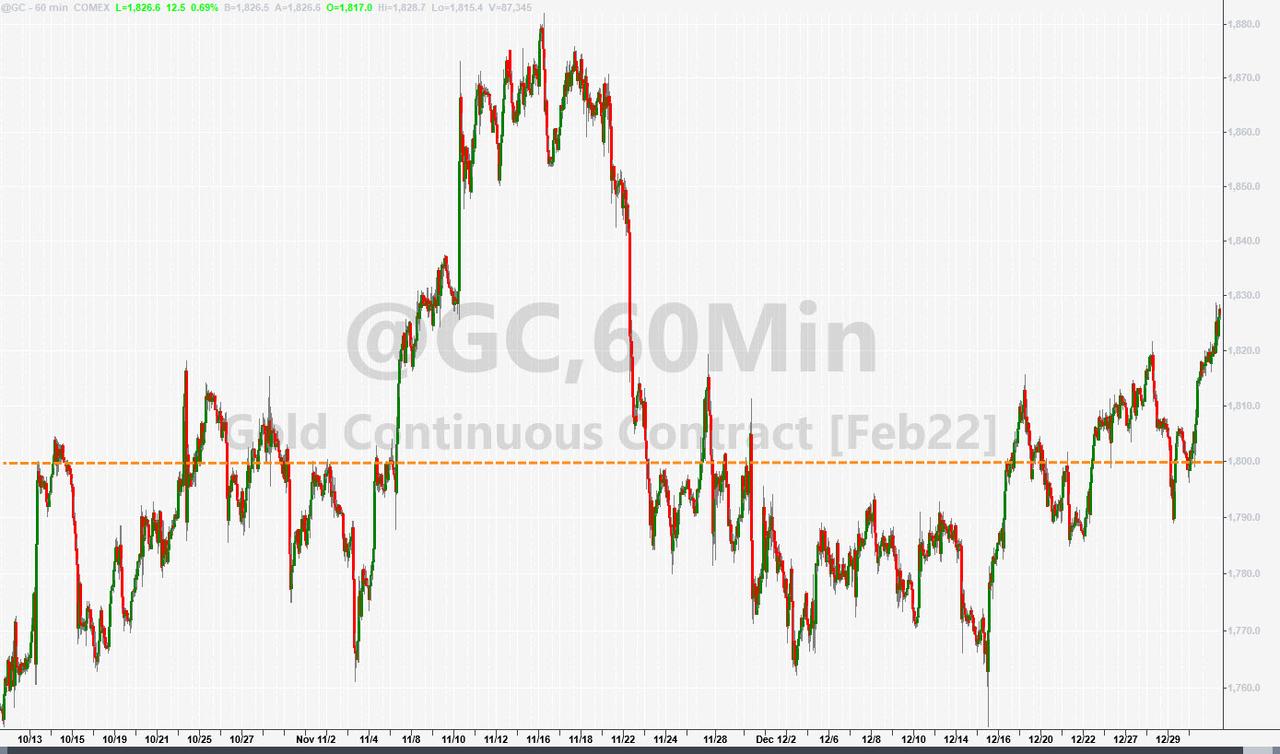
Despite surging inflation, gold disappointed by not keeping up, but at least it managed to recover its $1,800 level.
Looking ahead, we can expect more difficult market conditions in 2022, as the Fed tapers its easy monetary policy and will likely address the now not so “transitory” inflation story via higher interest rates.
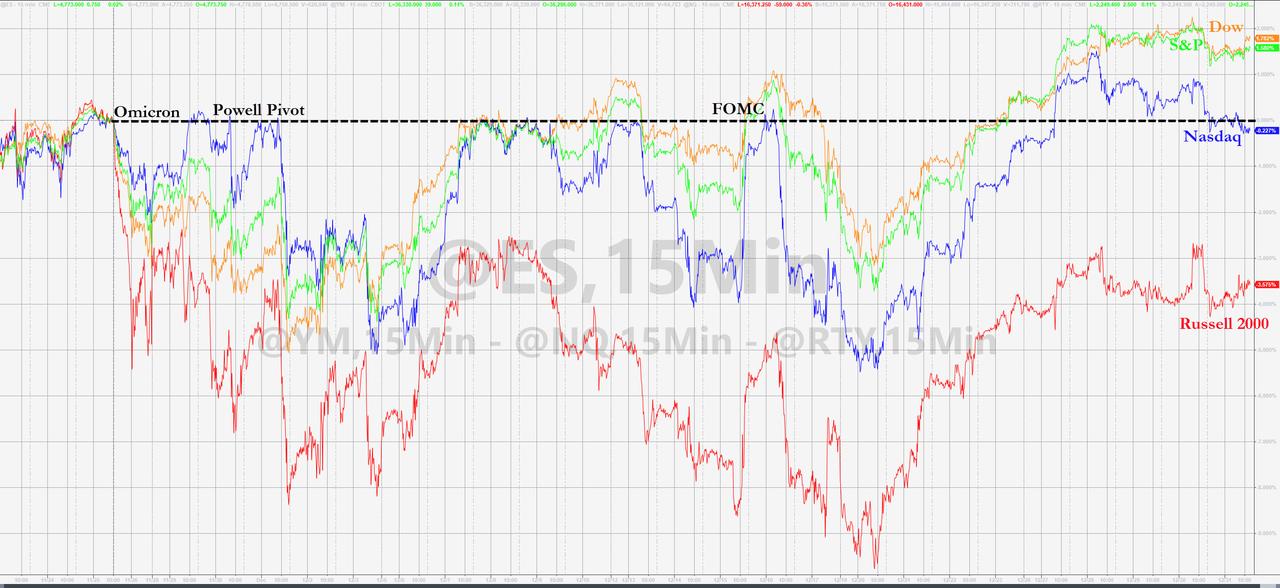
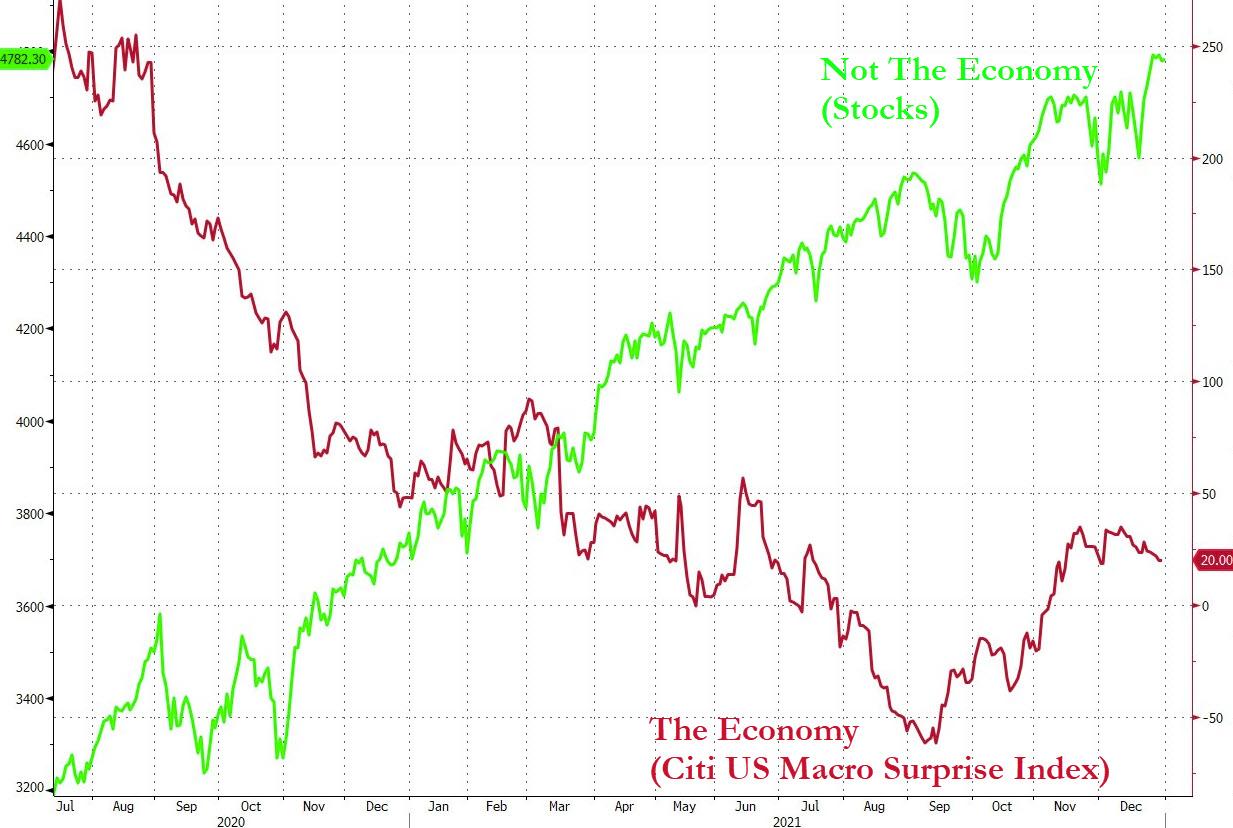
This chart always makes a lot of sense to me by simply showing stock market direction vs. the real economy, both of which should be in sync but are nowhere near it.
Happy New Year!
2. ETFs in the Spotlight
In case you missed the announcement and description of this section, you can read it here again.
It features some of the 10 broadly diversified domestic and sector ETFs from my HighVolume list as posted every Saturday. Furthermore, they are screened for the lowest MaxDD% number meaning they have been showing better resistance to temporary sell offs than all others over the past year.
The below table simply demonstrates the magnitude with which these ETFs are fluctuating above or below their respective individual trend lines (%+/-M/A). A break below, represented by a negative number, shows weakness, while a break above, represented by a positive percentage, shows strength.
For hundreds of ETF choices, be sure to reference Thursday’s StatSheet.
For this current domestic “Buy” cycle, here’s how some of our candidates have fared:
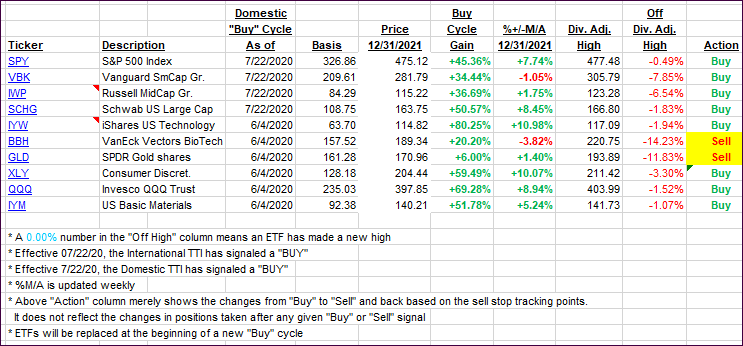
Click image to enlarge.
Again, the %+/-M/A column above shows the position of the various ETFs in relation to their respective long-term trend lines, while the trailing sell stops are being tracked in the “Off High” column. The “Action” column will signal a “Sell” once the -8% point has been taken out in the “Off High” column. For more volatile sector ETFs, the trigger point is -10%.
3. Trend Tracking Indexes (TTIs)
Our TTIs pulled back a tiny bit, as the major indexes slipped during the past two trading days of 2021.
This is how we closed 12/31/2021:
Domestic TTI: +6.47% above its M/A (prior close +6.84%)—Buy signal effective 07/22/2020.
International TTI: +2.72% above its M/A (prior close 3.09%)—Buy signal effective 07/22/2020.
Disclosure: I am obliged to inform you that I, as well as my advisory clients, own some of the ETFs listed in the above table. Furthermore, they do not represent a specific investment recommendation for you, they merely show which ETFs from the universe I track are falling within the specified guidelines.
All linked charts above are courtesy of Bloomberg via ZeroHedge.
———————————————————-
WOULD YOU LIKE TO HAVE YOUR INVESTMENTS PROFESSIONALLY MANAGED?
Do you have the time to follow our investment plans yourself? If you are a busy professional who would like to have his portfolio managed using our methodology, please contact me directly or get more details here.
Contact Ulli