
- Moving the markets
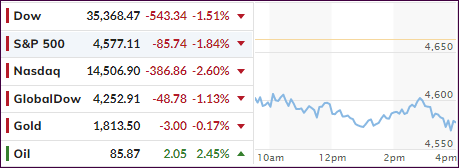
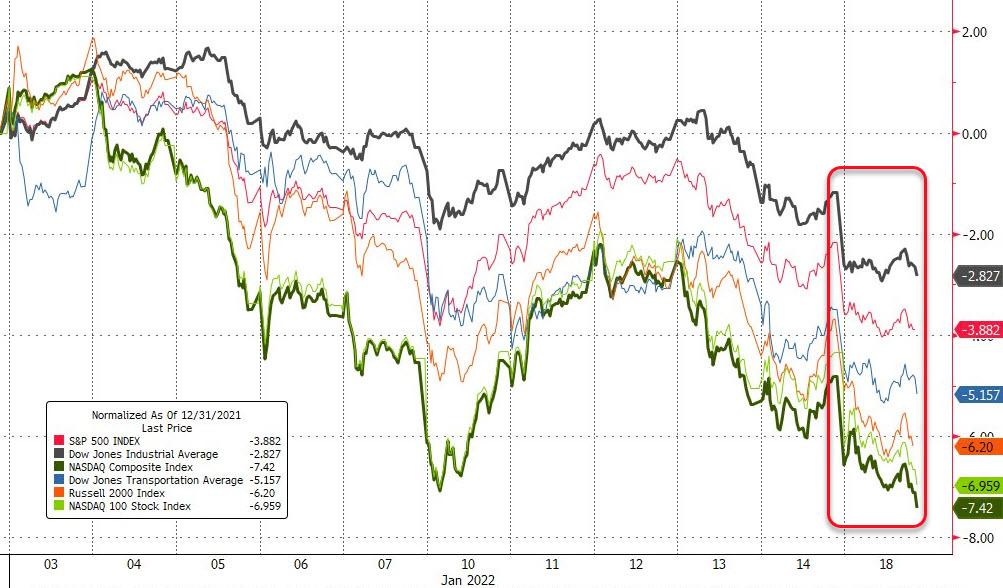
As we’ve witnessed for most of this year, surging bond yields have been the culprit to not only keep equities in check but also pull them off their lofty levels. Such was the case again today when the session got off to a bad start with the Dow dumping some 500 points right after the opening. The markets are having their worst start to a year since 2016, as ZH pointed out.
Adding to the sour mood was Goldman Sachs’ disappointing earnings report due in part to a 23% surge in operating expenses, which spanked their shares at the tune of -7%.
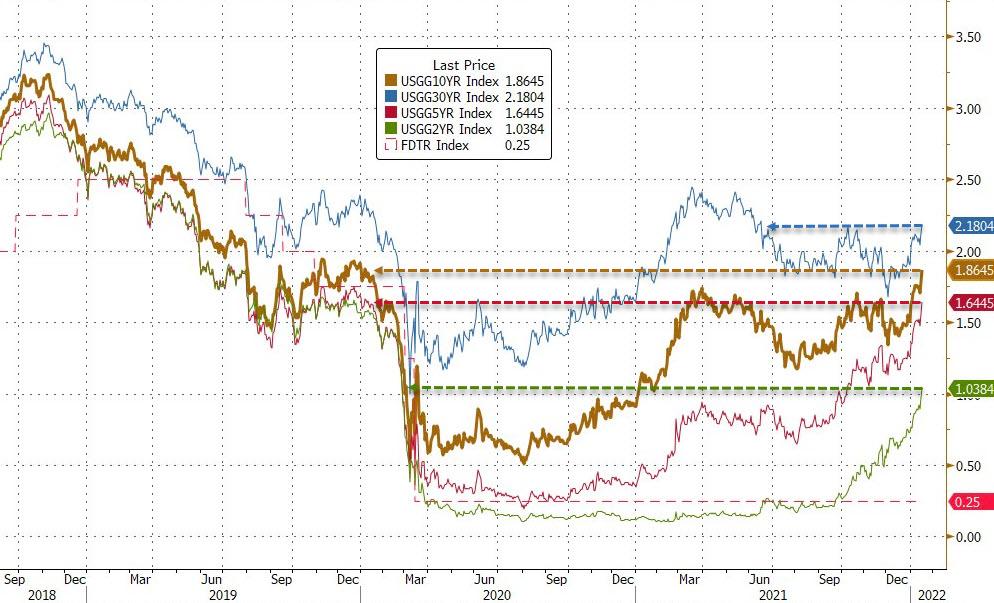
In bond land, the closely watched 2-year yield pierced the 1% level for the first time in almost 2 years. It has proven to be a reliable measure as to where the Fed will set short-term borrowing rates. Not to be left behind, the 10-year followed suit by touching its 1.86% level, also its highest since January 2020.
What that means is that the bond market is pricing in the announced aggressive policy tightening by the Fed, as well as their hawkish guidance. So far, they have not done anything other than spook the markets, and it remains to be seen whether they will follow through or simply leave traders and computer algos to deal with nothing but anticipation.
In terms of earning season, MarketWatch summed it up like this:
Overall, 33 S&P 500 companies have reported calendar fourth-quarter earnings thus far, according to Refinitiv. Of those companies, nearly 70% posted bottom-line results that beat analyst expectations.
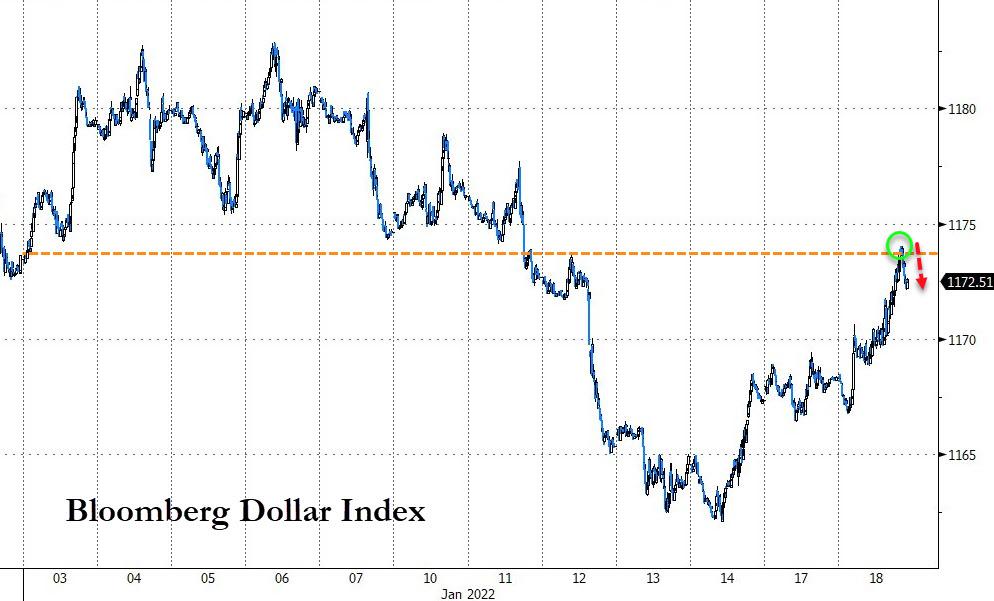
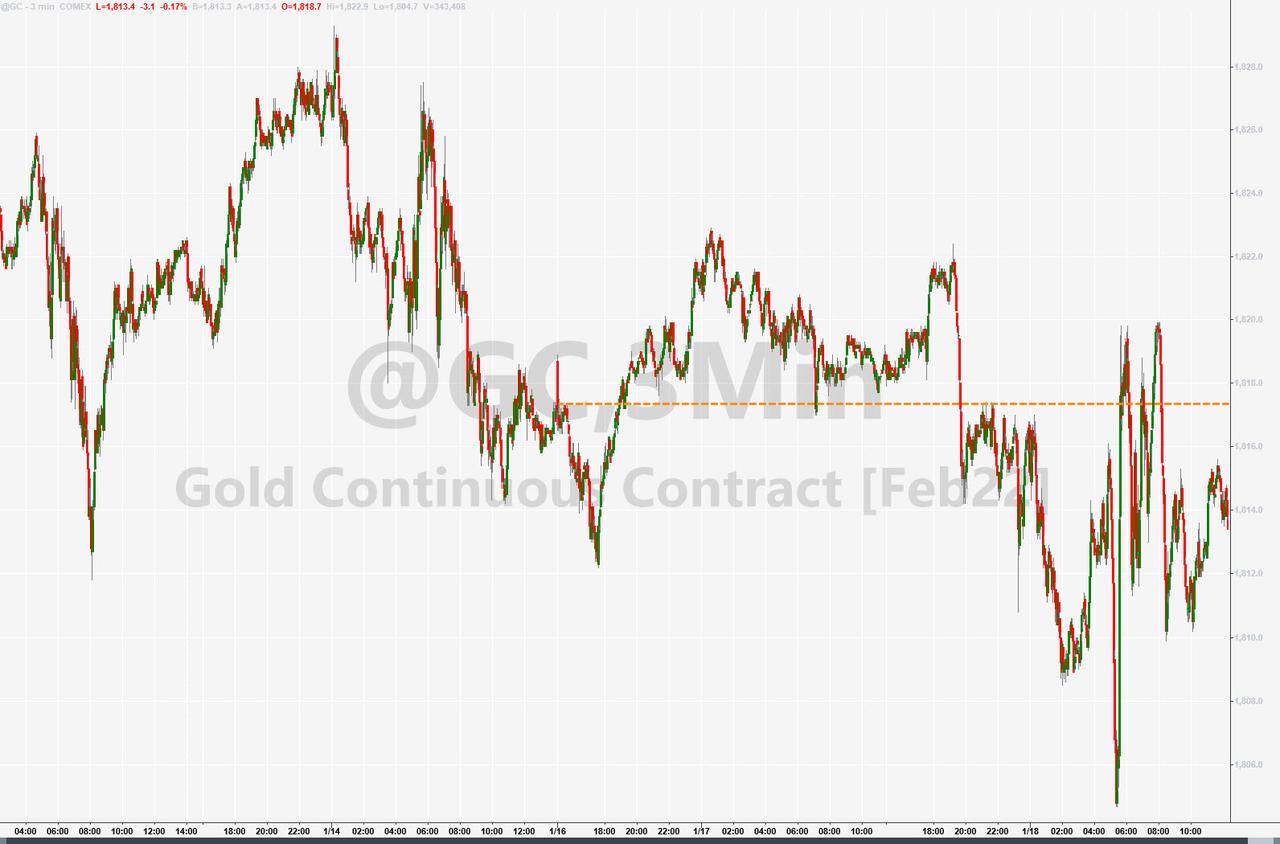
The US Dollar extended recent gains but pulled back into the close, while gold chopped around and only ended slightly lower.
While our TTIs (section 3) remain on the bullish side of their respective trend lines, one of our holdings has broken clearly through its trailing sell stop and will be sold, unless a rebound materializes tomorrow.
There was no place to hide during today’s drop, and it looks like further bond yield spikes could deflate this equity bubble even more and eventually send us to the safety of the sidelines.
2. ETFs in the Spotlight
In case you missed the announcement and description of this section, you can read it here again.
It features some of the 10 broadly diversified domestic and sector ETFs from my HighVolume list as posted every Saturday. Furthermore, they are screened for the lowest MaxDD% number meaning they have been showing better resistance to temporary sell offs than all others over the past year.
The below table simply demonstrates the magnitude with which these ETFs are fluctuating above or below their respective individual trend lines (%+/-M/A). A break below, represented by a negative number, shows weakness, while a break above, represented by a positive percentage, shows strength.
For hundreds of ETF choices, be sure to reference Thursday’s StatSheet.
For this current domestic “Buy” cycle, here’s how some of our candidates have fared:
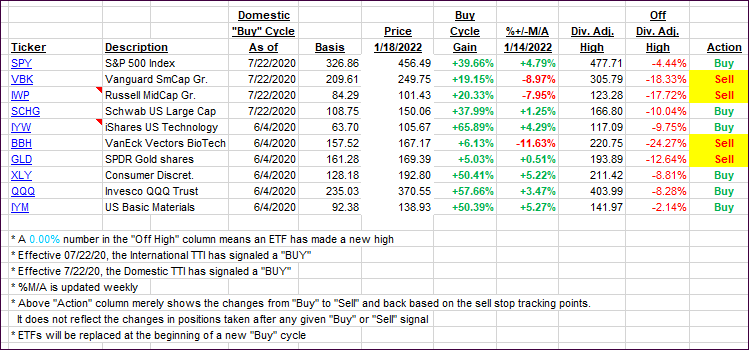
Click image to enlarge.
Again, the %+/-M/A column above shows the position of the various ETFs in relation to their respective long-term trend lines, while the trailing sell stops are being tracked in the “Off High” column. The “Action” column will signal a “Sell” once the -12% point has been taken out in the “Off High” column, which has replaced the prior -8% to -10% limits.
3. Trend Tracking Indexes (TTIs)
Our TTIs dumped and headed sharply lower but for the time being remain above their respective trend lines. The Domestic one is clearly showing more weakness than its international cousin.
This is how we closed 01/18/2022:
Domestic TTI: +3.39% above its M/A (prior close +5.07%)—Buy signal effective 07/22/2020.
International TTI: +5.11% above its M/A (prior close 6.13%)—Buy signal effective 07/22/2020.
Disclosure: I am obliged to inform you that I, as well as my advisory clients, own some of the ETFs listed in the above table. Furthermore, they do not represent a specific investment recommendation for you, they merely show which ETFs from the universe I track are falling within the specified guidelines.
All linked charts above are courtesy of Bloomberg via ZeroHedge.
Contact Ulli