
- Moving the markets
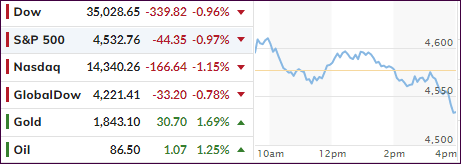
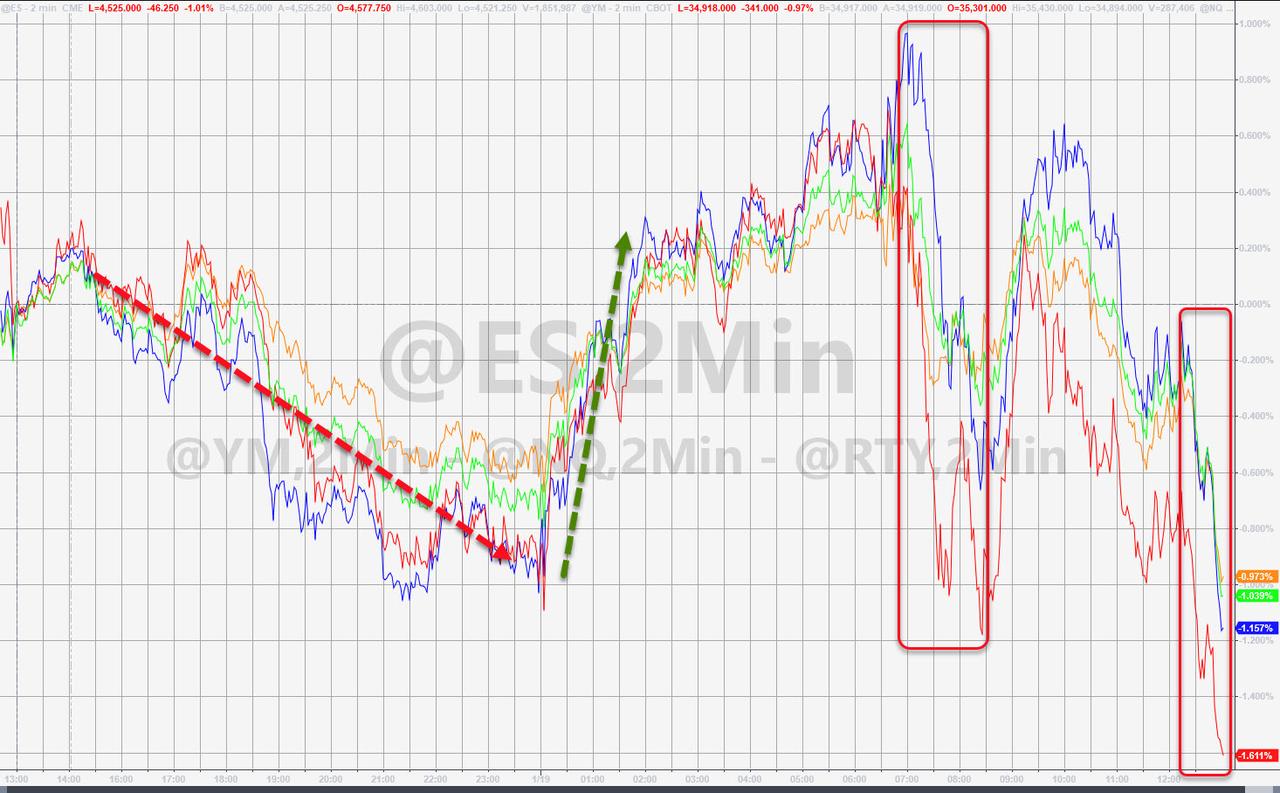
A solid early bounce in the major indexes hit the skids, found upward impetus for a second time but then lost momentum with all three major indexes doing their best imitation of a swan dive by closing at the lows of the day.
It turned into another disappointing day for the dip buyers, as the midday pullback proved to have not enough support to justify taking new positions therefore handing the bears their second win in a row.
With today’s loss, the Nasdaq has now slipped into correction territory, which means a drop of 10% from its record high scored in November. As I posted yesterday, I ended up liquidating one or our positions, which had lately produced nothing but aimless meandering with a bent towards bearishness.
MarketWatch accurately described the current state of the market this way:
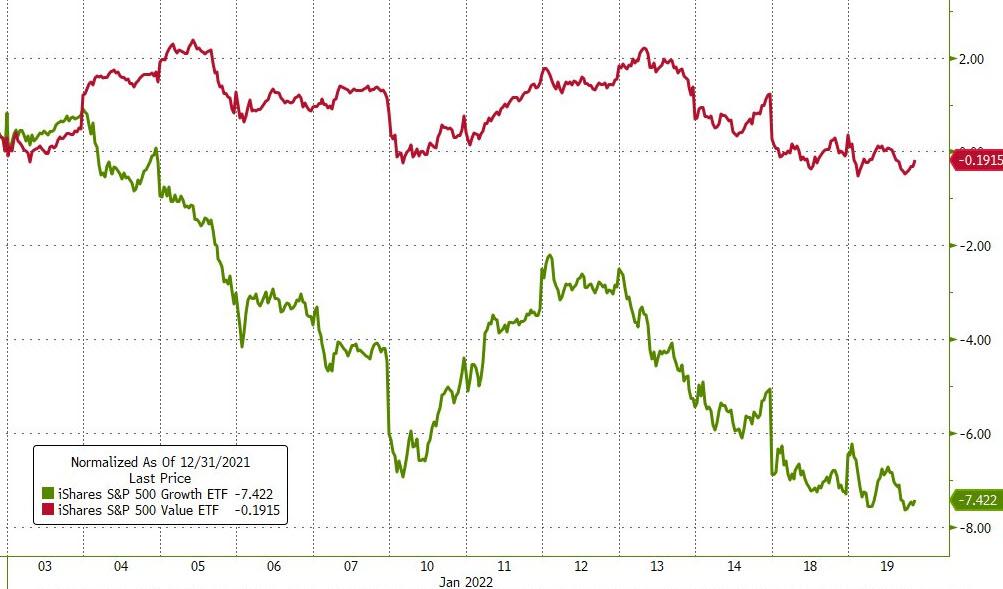
Nasdaq’s pullback from its November high has been led by growth stocks whose valuations ballooned during the pandemic. Shares of Peloton are off more than 80% from their highs. Zoom Video has shed more than 70%. Moderna, DocuSign and PayPal are all down more than 40% from their highs.
This is not surprising, as higher bond yields and generally tighter financial conditions always lead to weakness in those sectors which have superbly benefited by the Fed’s largesse over the past decade. So, it came as no surprise that “value” outperformed “growth.”
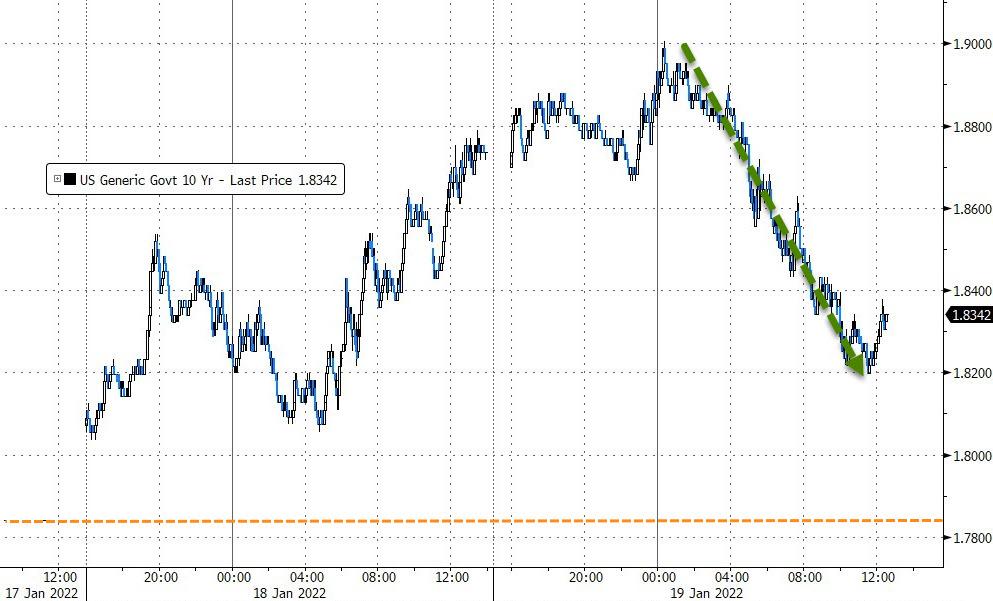
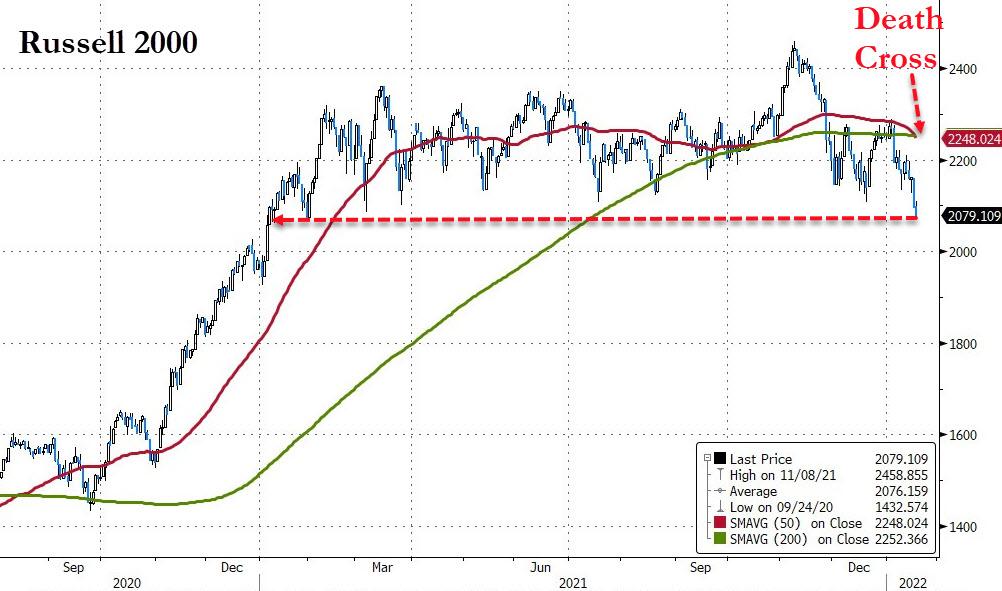
Bond yields ended the session slightly lower but not before the 10-year touched the 1.90% level, which turned out to be the reversal moment for equities, and down we went. SmallCaps were hit hard and suffered a Death Cross (50-day M/A below 200-day M/A).
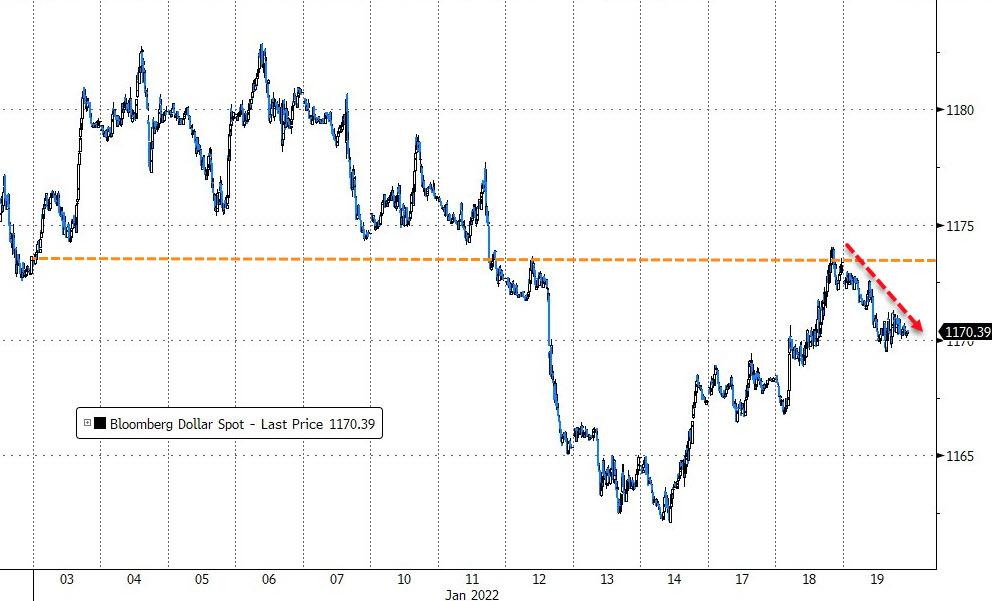
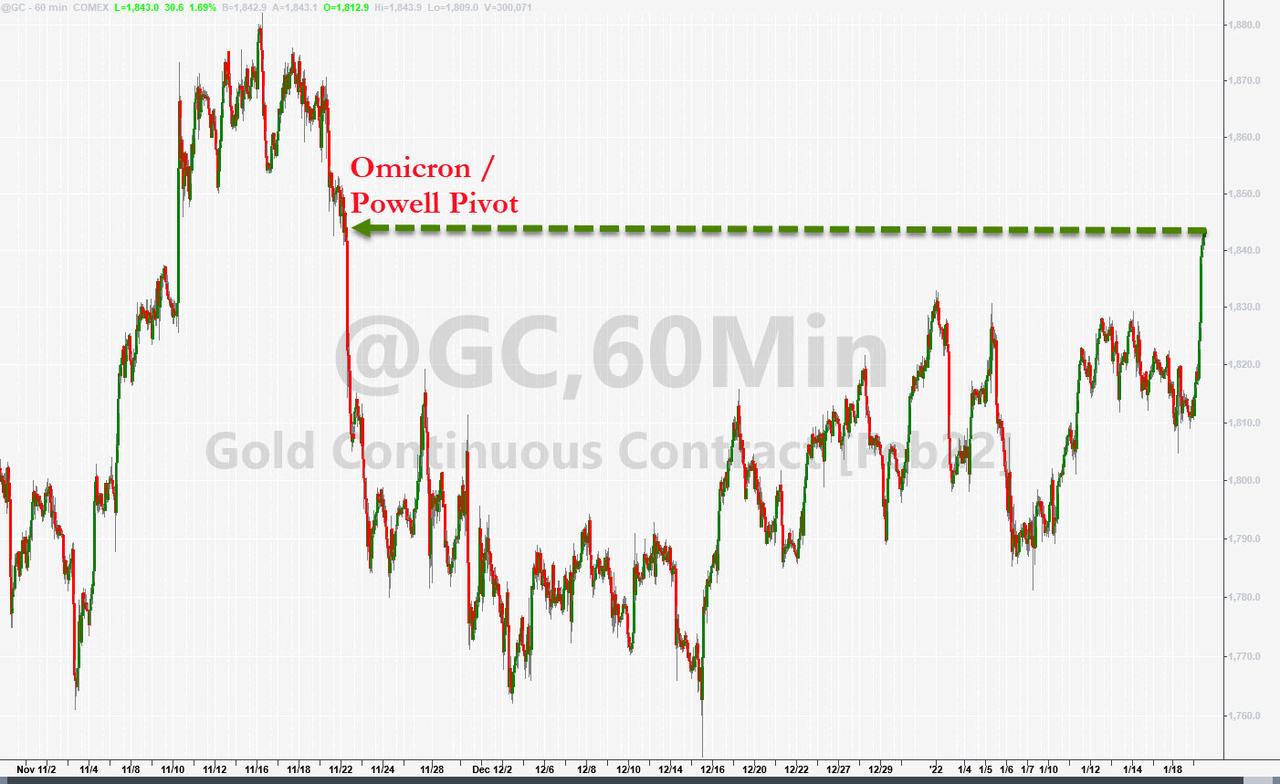
The US Dollar bounced off its YTD unchanged line and closed lower. The shining star of the day was gold, which added +1.6% and reclaimed its $1,840 level.
2. ETFs in the Spotlight
In case you missed the announcement and description of this section, you can read it here again.
It features some of the 10 broadly diversified domestic and sector ETFs from my HighVolume list as posted every Saturday. Furthermore, they are screened for the lowest MaxDD% number meaning they have been showing better resistance to temporary sell offs than all others over the past year.
The below table simply demonstrates the magnitude with which these ETFs are fluctuating above or below their respective individual trend lines (%+/-M/A). A break below, represented by a negative number, shows weakness, while a break above, represented by a positive percentage, shows strength.
For hundreds of ETF choices, be sure to reference Thursday’s StatSheet.
For this current domestic “Buy” cycle, here’s how some of our candidates have fared:
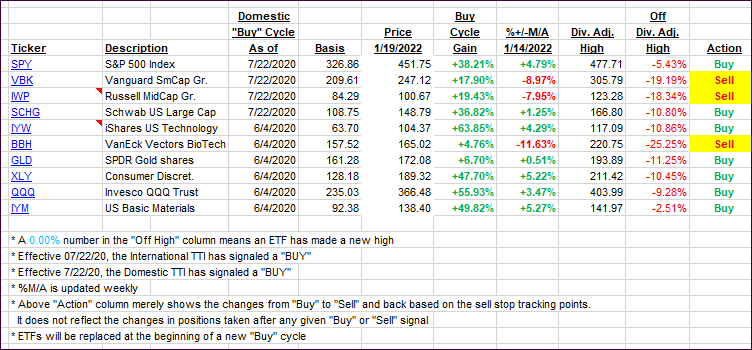
Click image to enlarge.
Again, the %+/-M/A column above shows the position of the various ETFs in relation to their respective long-term trend lines, while the trailing sell stops are being tracked in the “Off High” column. The “Action” column will signal a “Sell” once the -12% point has been taken out in the “Off High” column, which has replaced the prior -8% to -10% limits.
3. Trend Tracking Indexes (TTIs)
Our TTIs again retreated sharply with the bearish crowd being clearly in charge.
This is how we closed 01/19/2022:
Domestic TTI: +2.32% above its M/A (prior close +3.39%)—Buy signal effective 07/22/2020.
International TTI: +4.33% above its M/A (prior close 5.11%)—Buy signal effective 07/22/2020.
Disclosure: I am obliged to inform you that I, as well as my advisory clients, own some of the ETFs listed in the above table. Furthermore, they do not represent a specific investment recommendation for you, they merely show which ETFs from the universe I track are falling within the specified guidelines.
All linked charts above are courtesy of Bloomberg via ZeroHedge.
Contact Ulli