
- Moving the markets
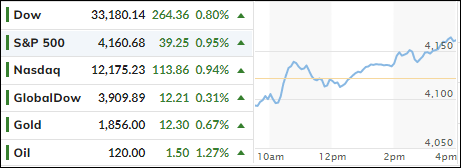
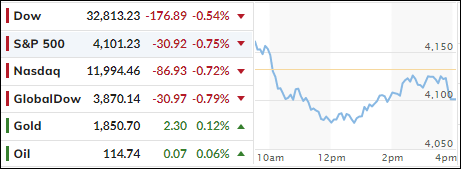
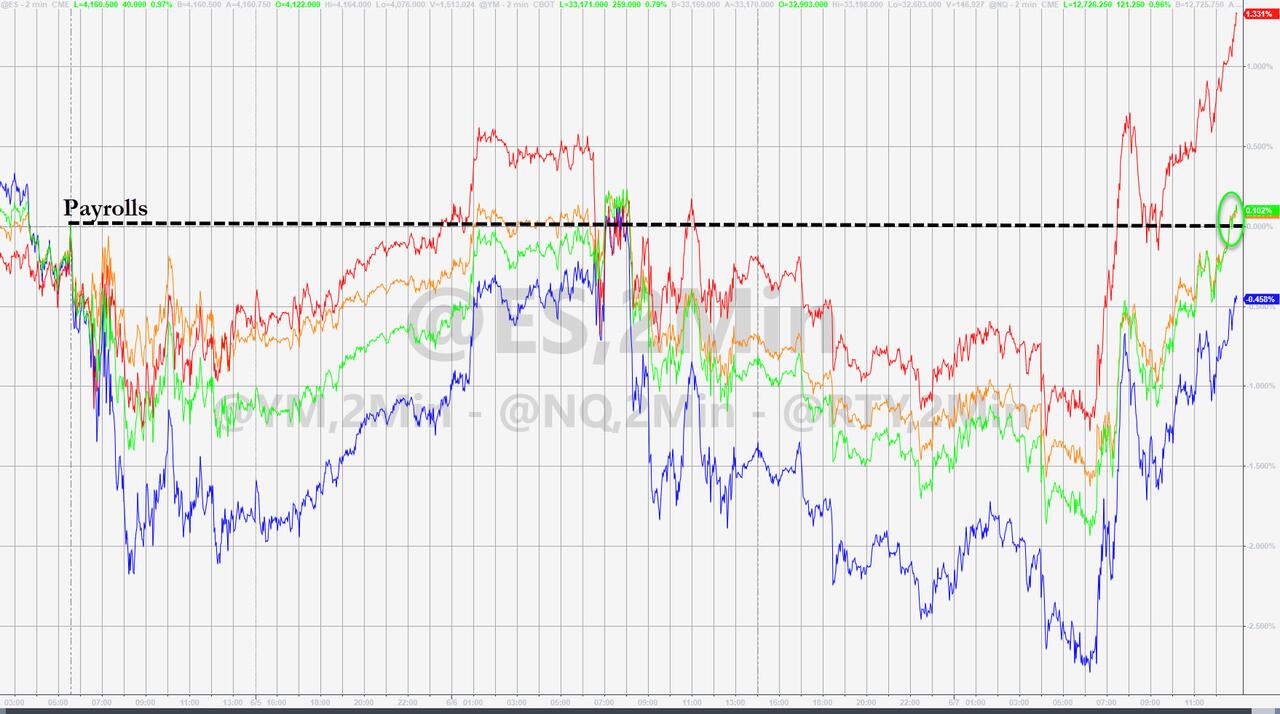
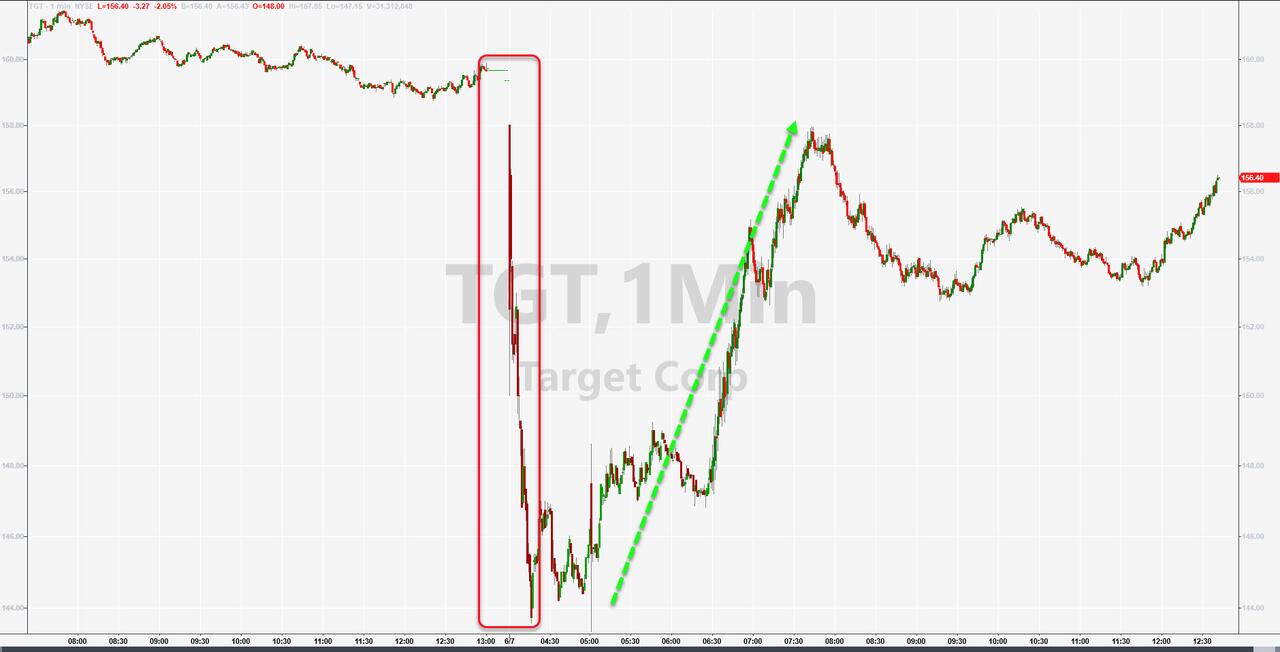
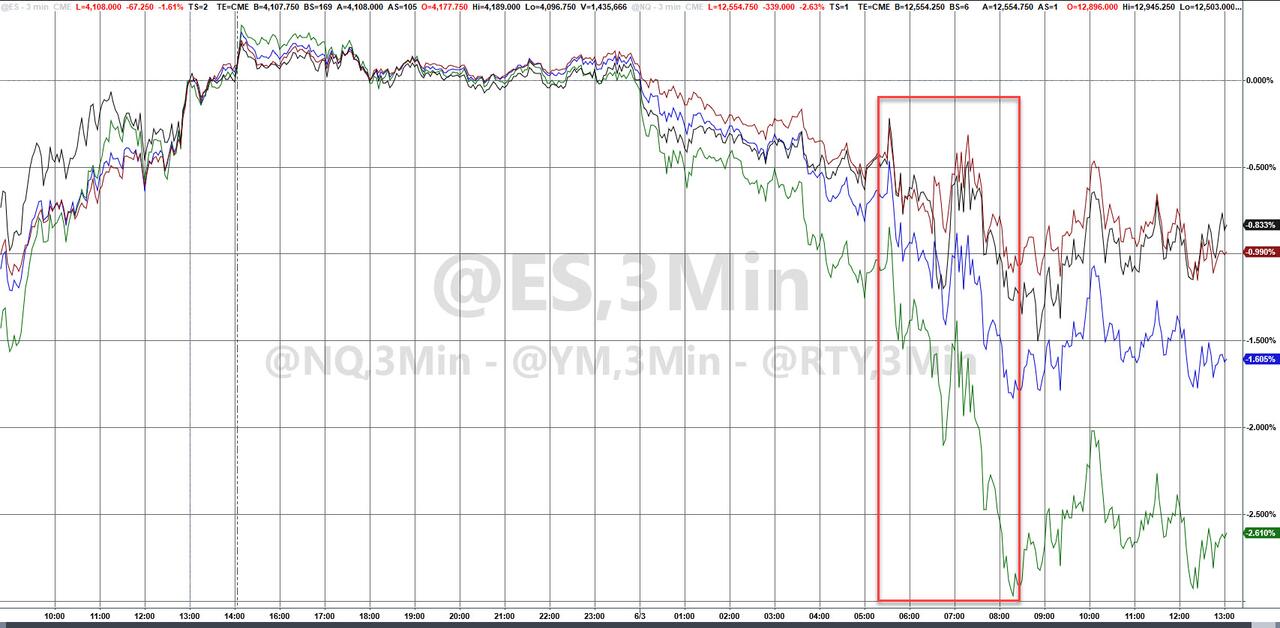
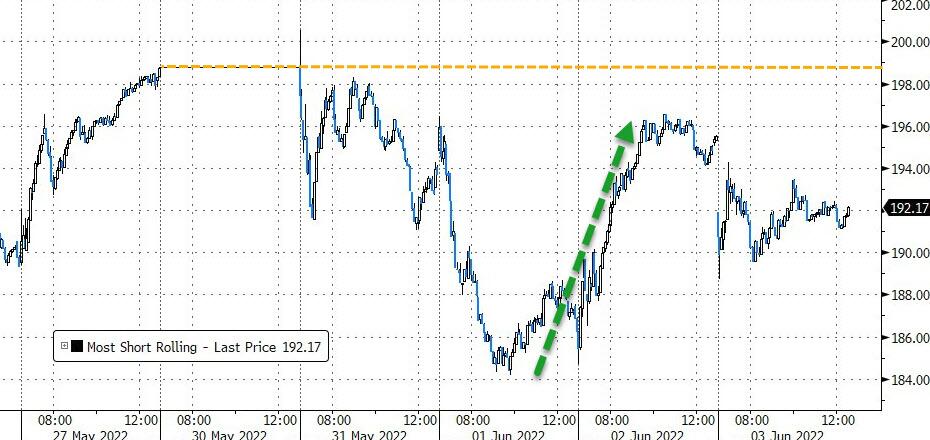
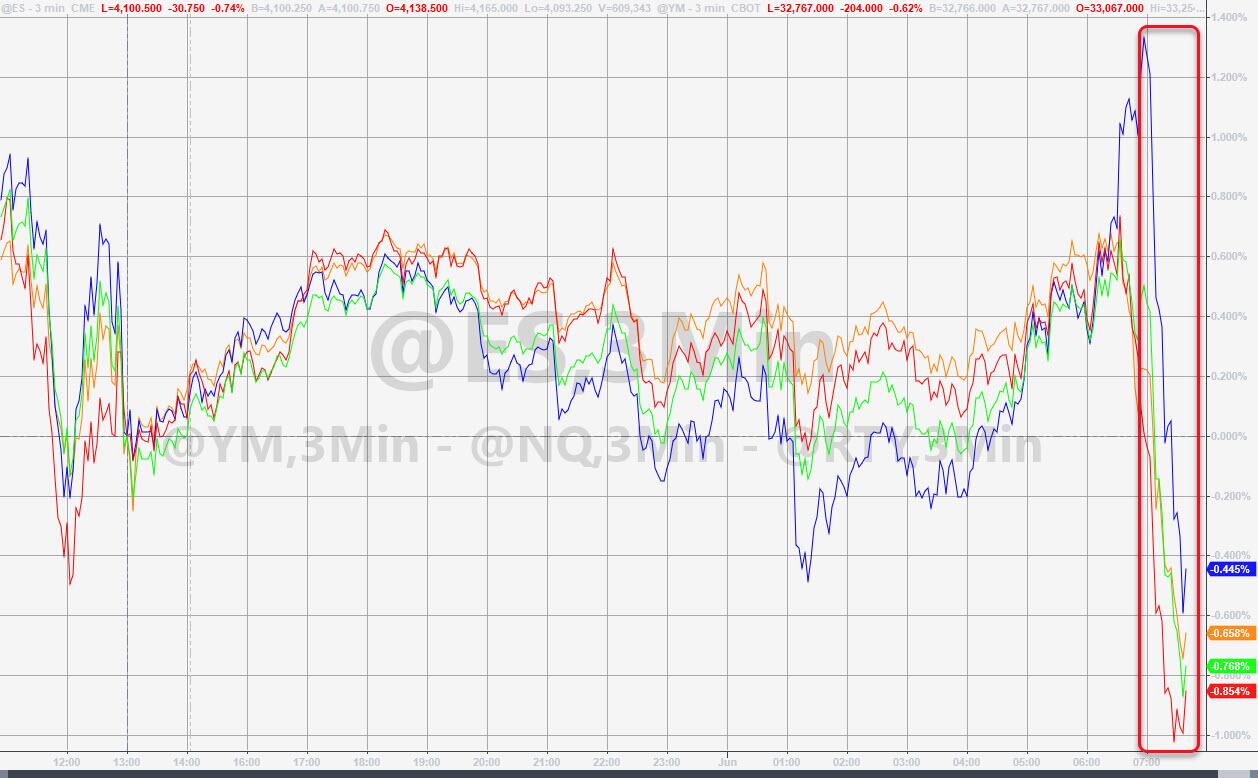
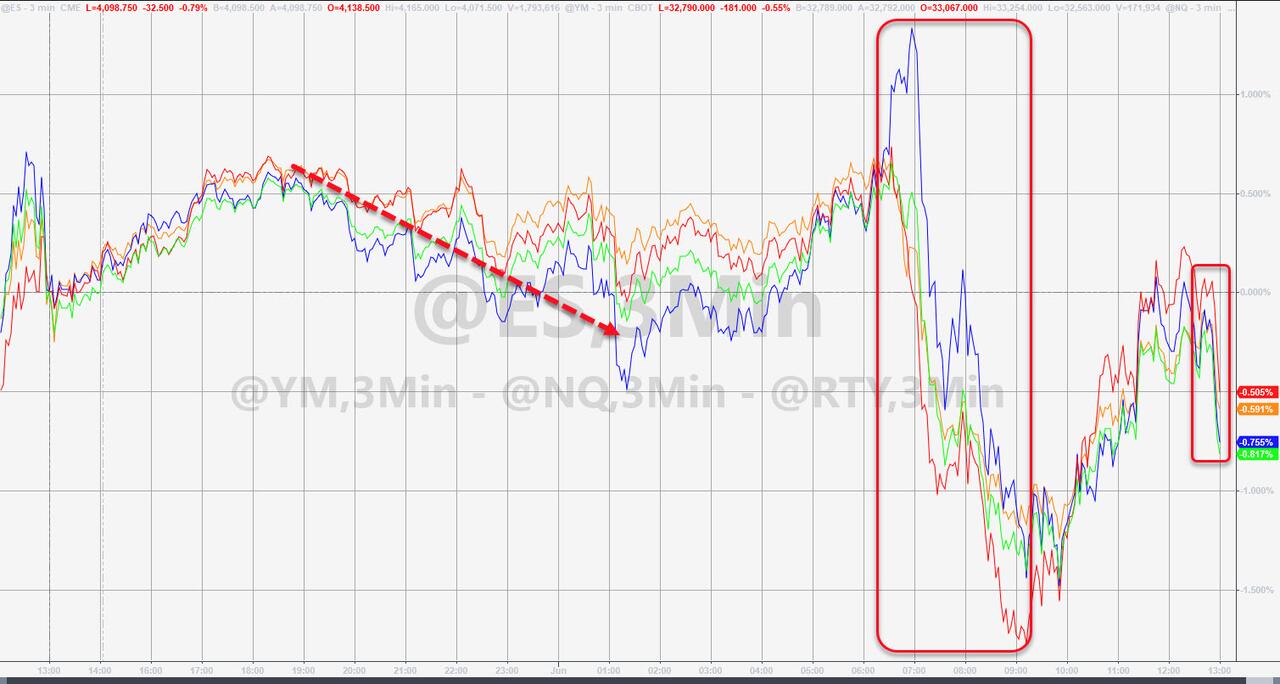
The major indexes were subdued early in the session, because Target’s profit warning sent equities into the red. After some bobbing and weaving, momentum turned positive, as dip buyers and a short squeeze combined forces to produce a green close to.
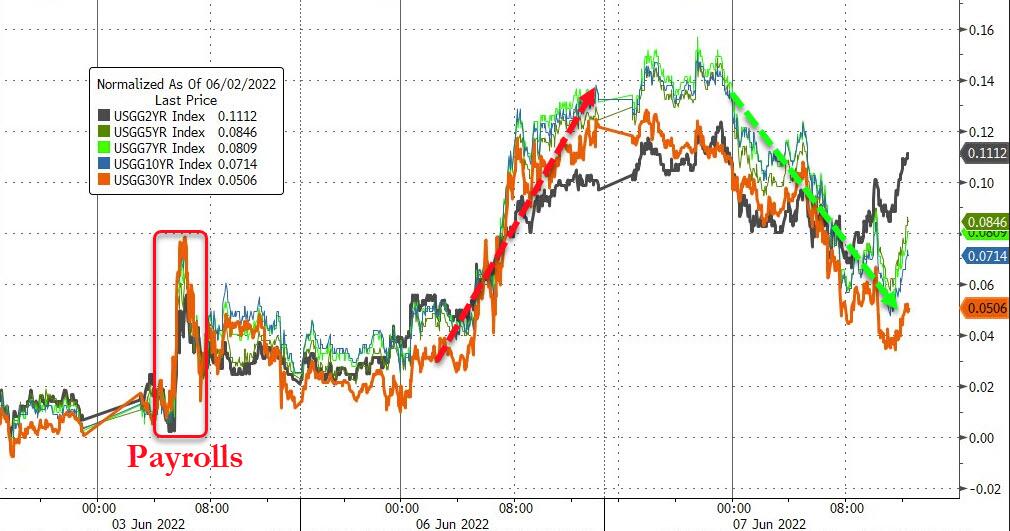
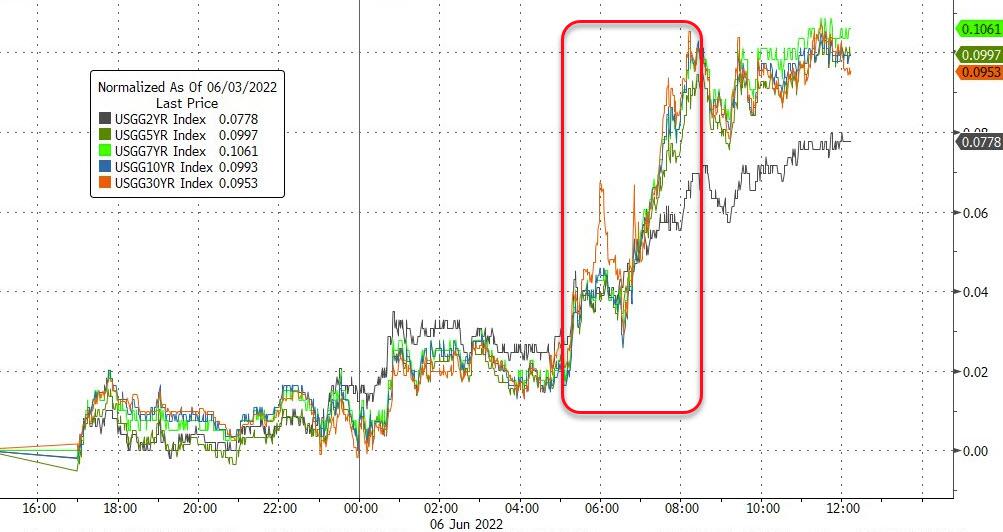
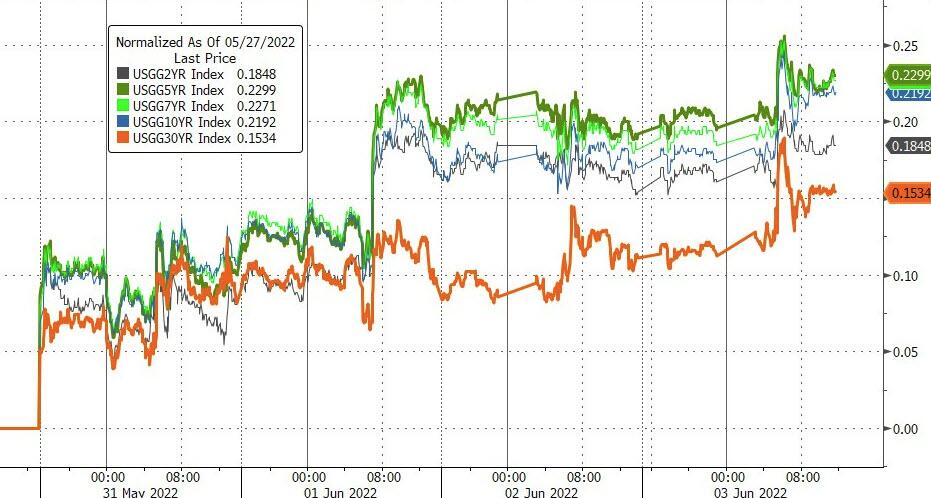
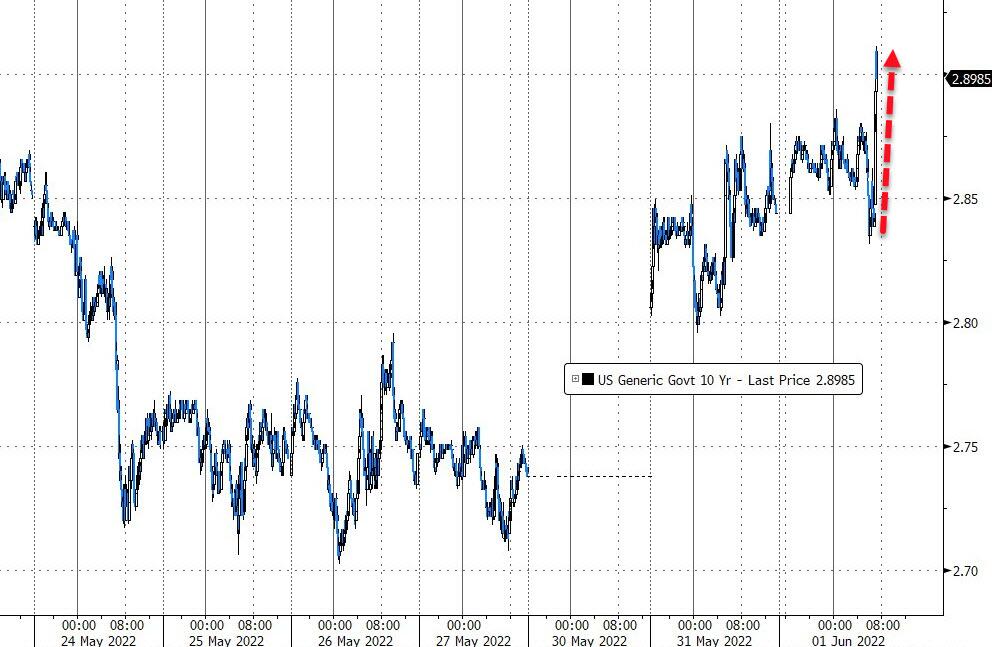
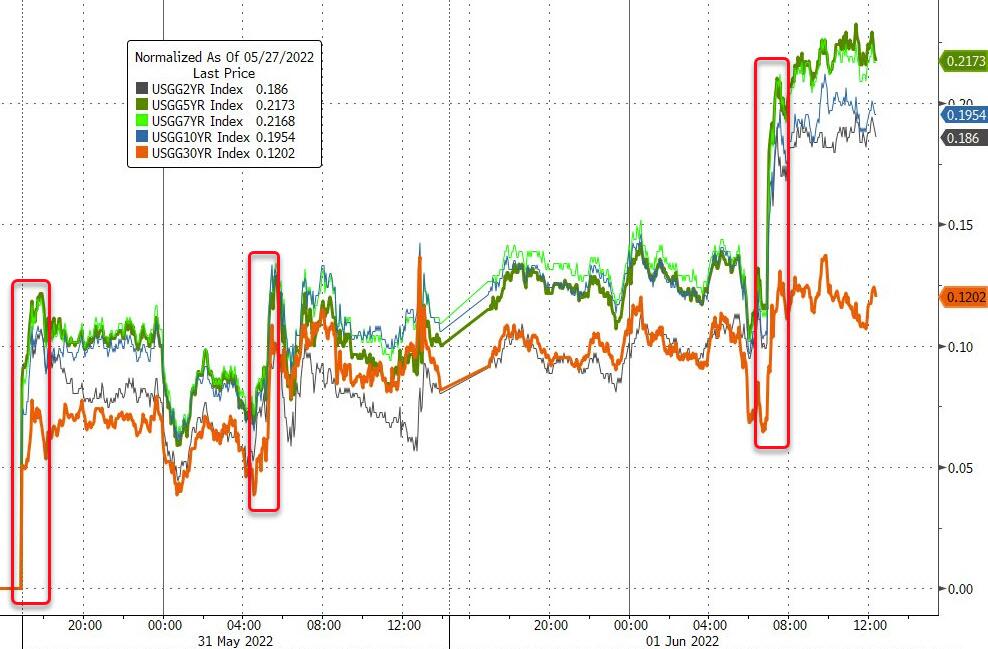
A big assist came from the bond market, after yields retreated with the 10-year losing 5.6 basis points and closing a tad below the much-feared 3% level. Any close above it appears to wreak havoc with equities, while any close below it supports bullish sentiment.
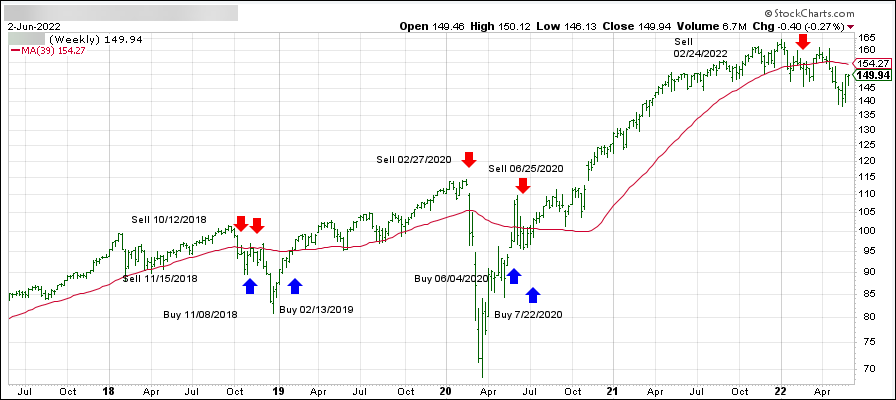
Traders are still anxiously debating whether the recent bounce is a bear market rally, or if we have seen the bottom of this year’s sell-off with a new bullish run now on deck. Personally, I think we may see a little more push to the upside, yet in limited fashion, after which new lows for the year will be made.
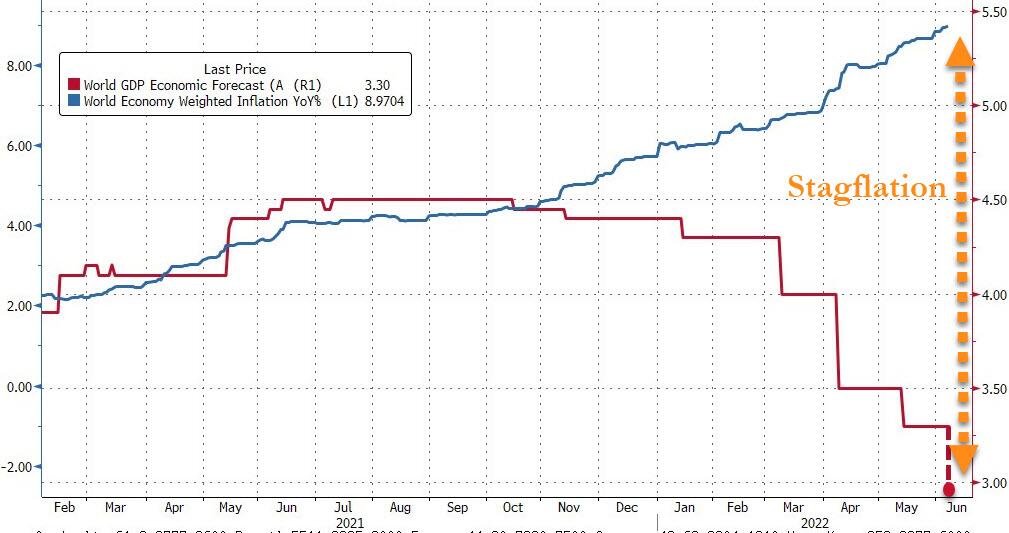
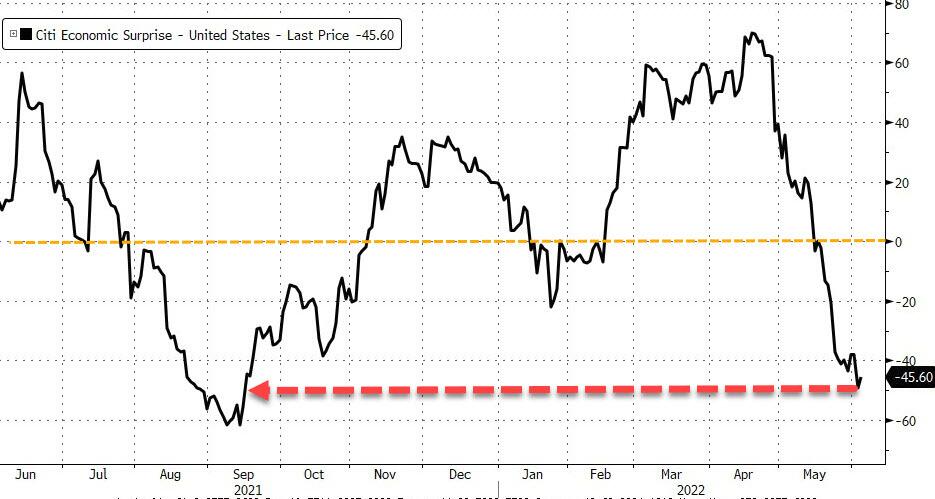
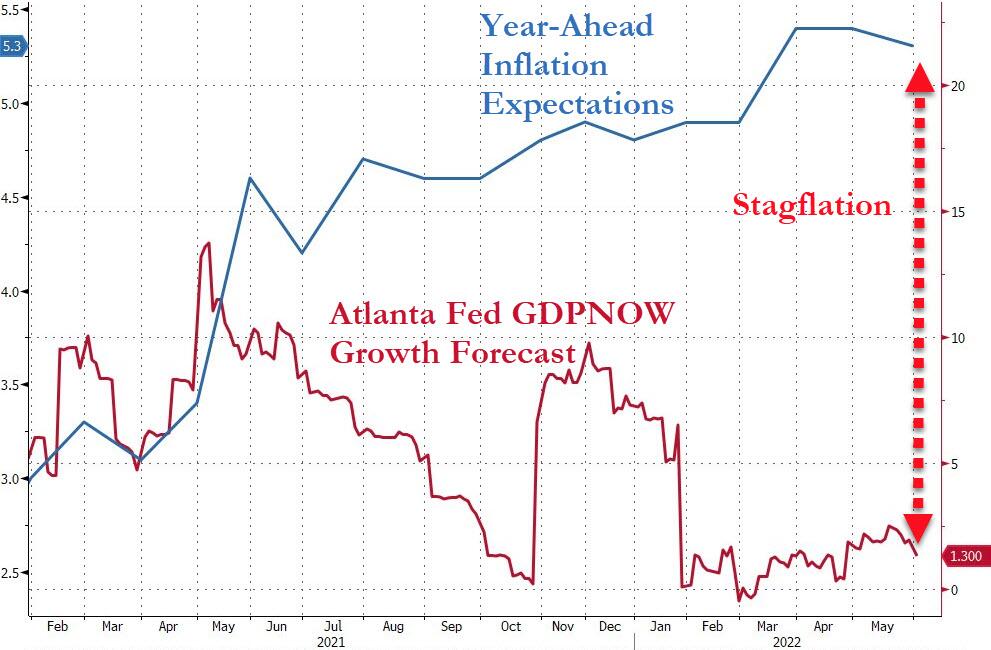
Econ data painted a different reality picture then that of equities. First, as ZH reported, the World Bank downgraded global economic growth and warned of stagflationary pressures building.
This was followed by the Atlanta Fed downgrading US economic growth to 0.9% from a 1.3% level just seven days ago. Way to go! Quipped ZeroHedge: Finally, today was a great day for buying stocks…
Read More
