
- Moving the markets
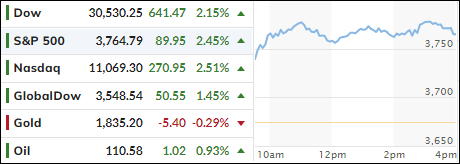
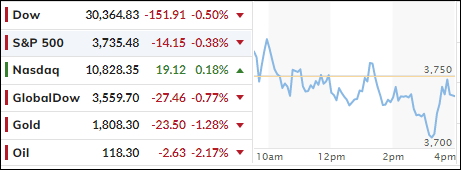
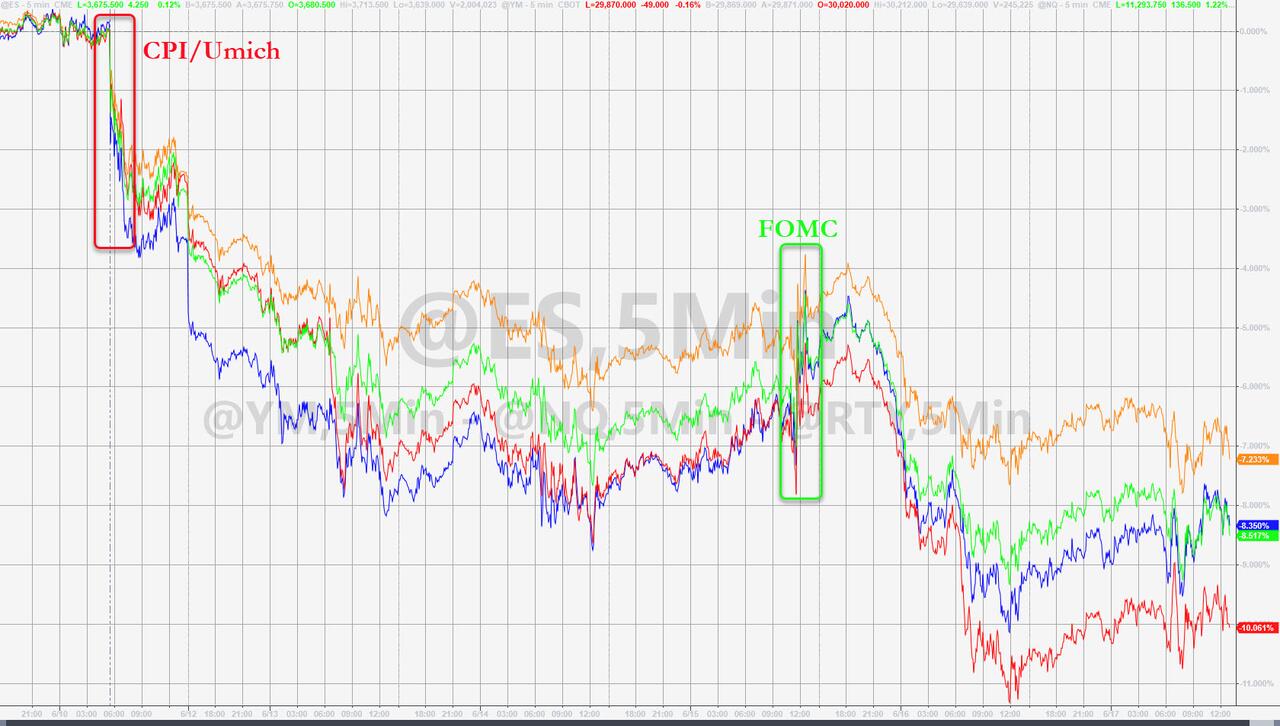
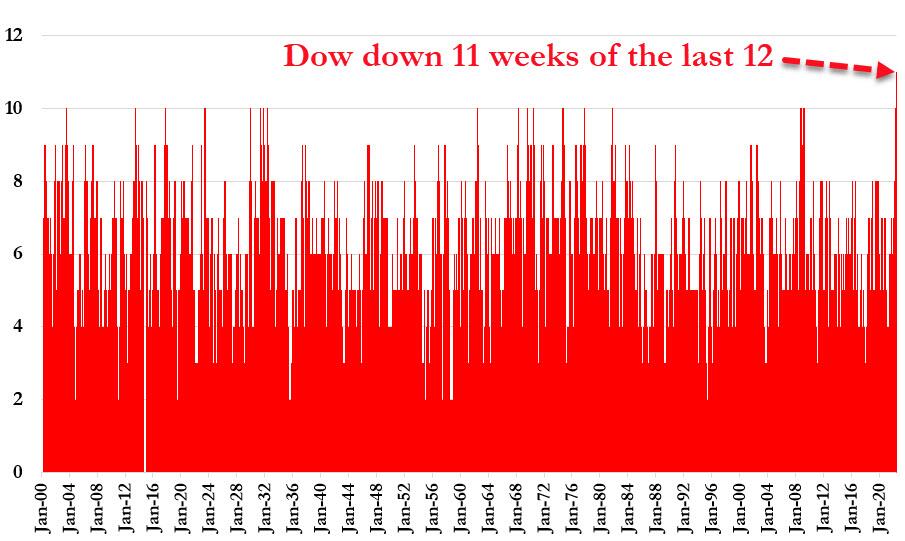
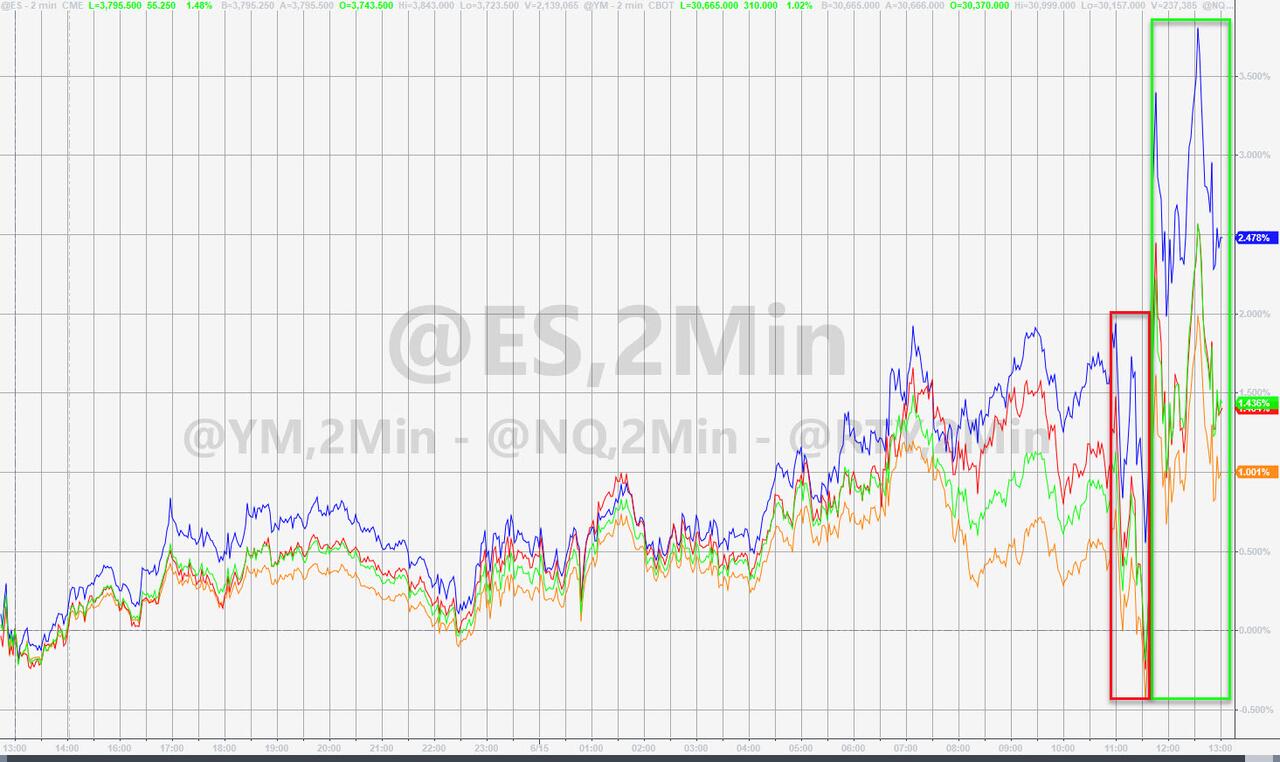
It comes as no surprise that the major indexes would eventually manage a bounce back from the brutal losses not only YTD but also from last week, which saw the S&P 500 surrender -5.8%—its worst 5-day stretch since 2020.
A more aggressive stance on interest rate hikes by the Fed, and increasing odds of a recession, combined forces to give the bears the upper hand. Considering the ever-worsening economic numbers, any rebound may be short-lived, but opinions also abound that the sell off was way overdone.
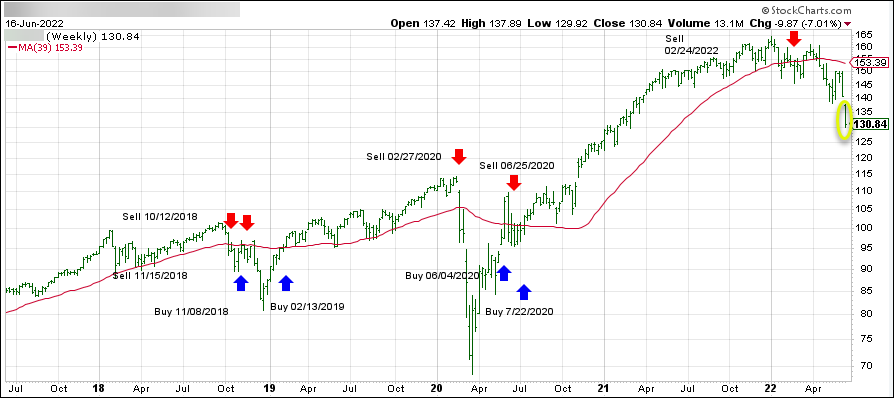
For sure, rebounds or rallies into the end of any quarter occur with great regularity, which means we’ll have to wait till July to get a better handle on whether this is simply a dead-cat-bounce or a true bottom. I believe it’s the former and not the latter.
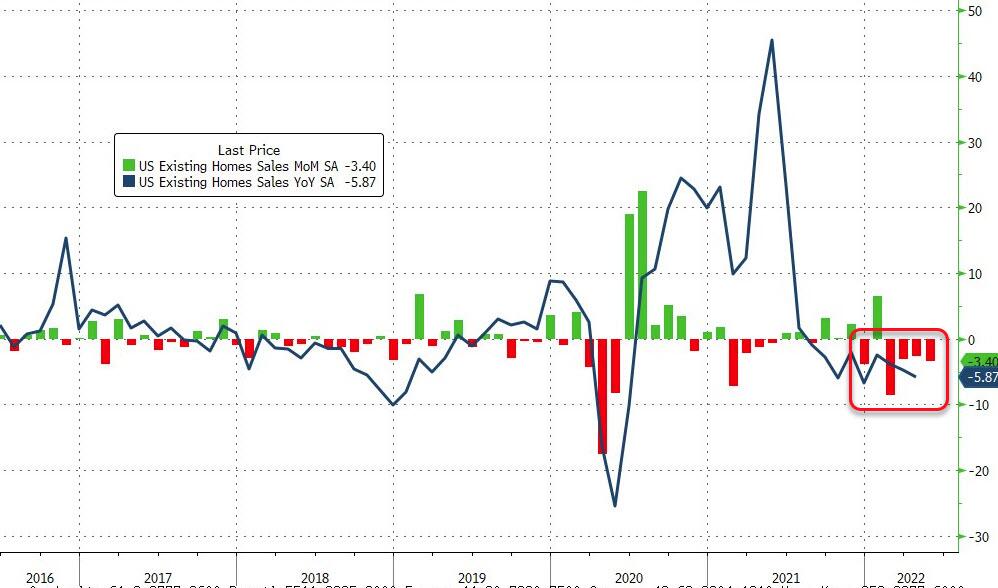
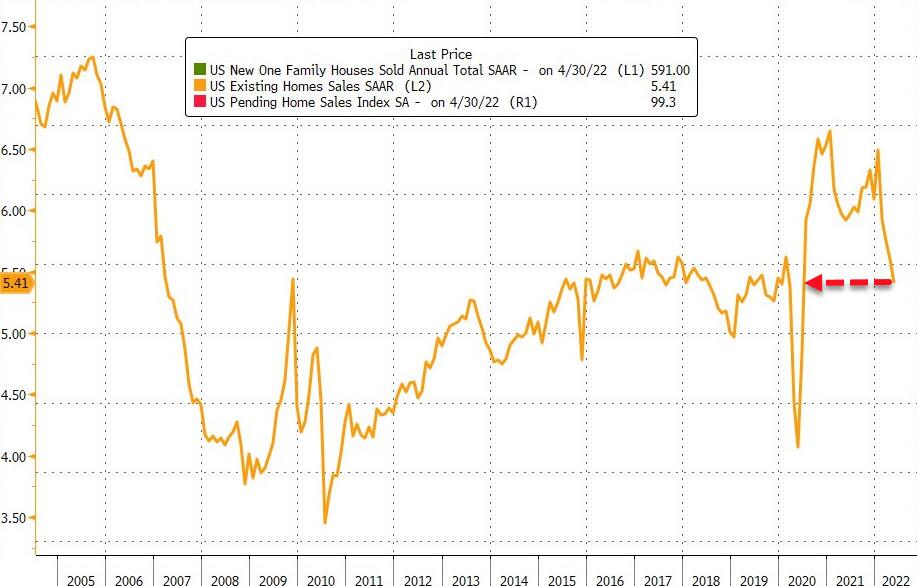
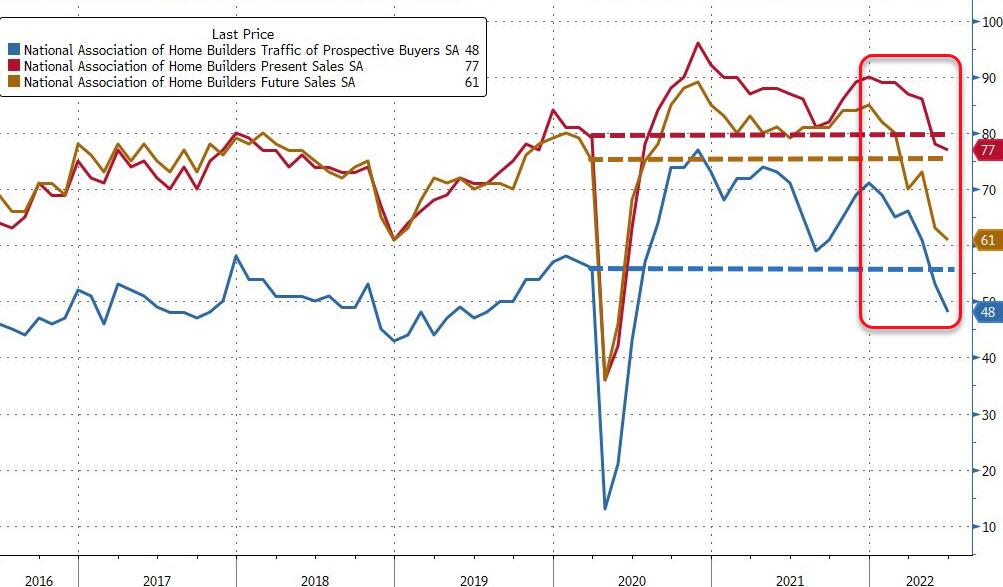
Looking at economic numbers, you must wonder what drove today’s rally. Existing Home Sales tumbled to a 2-year low, according to ZeroHedge, with the NAR warning that “worse is to come.”
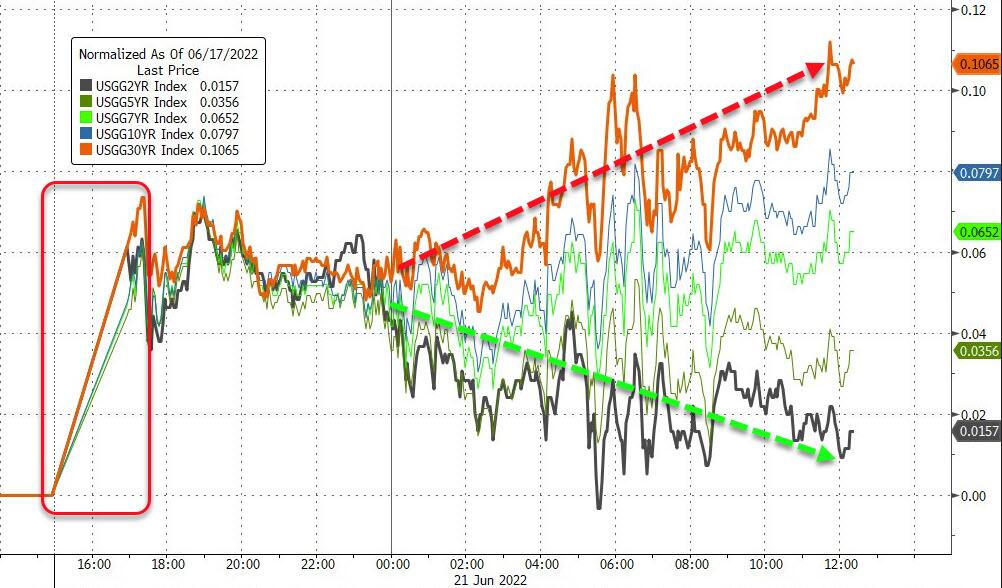
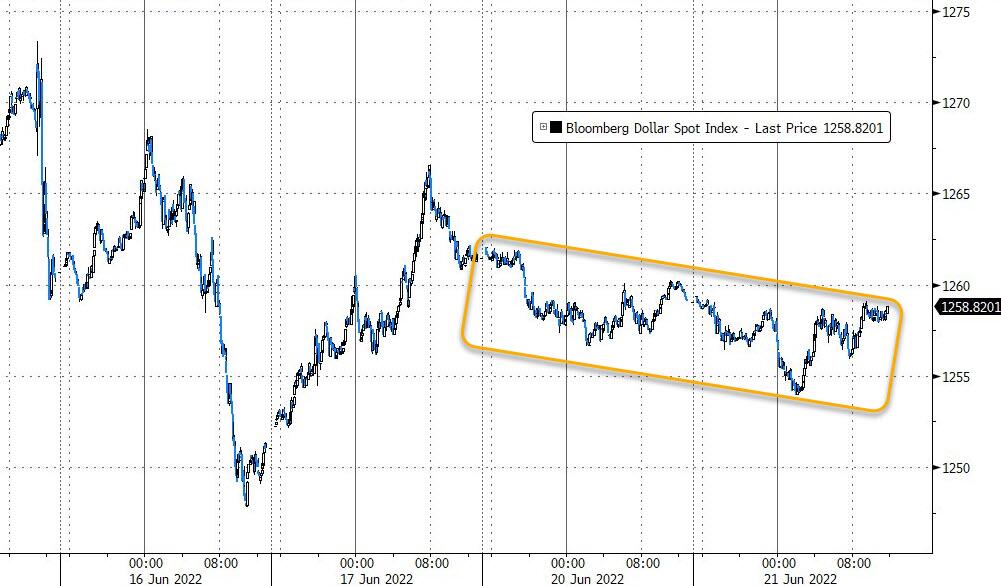
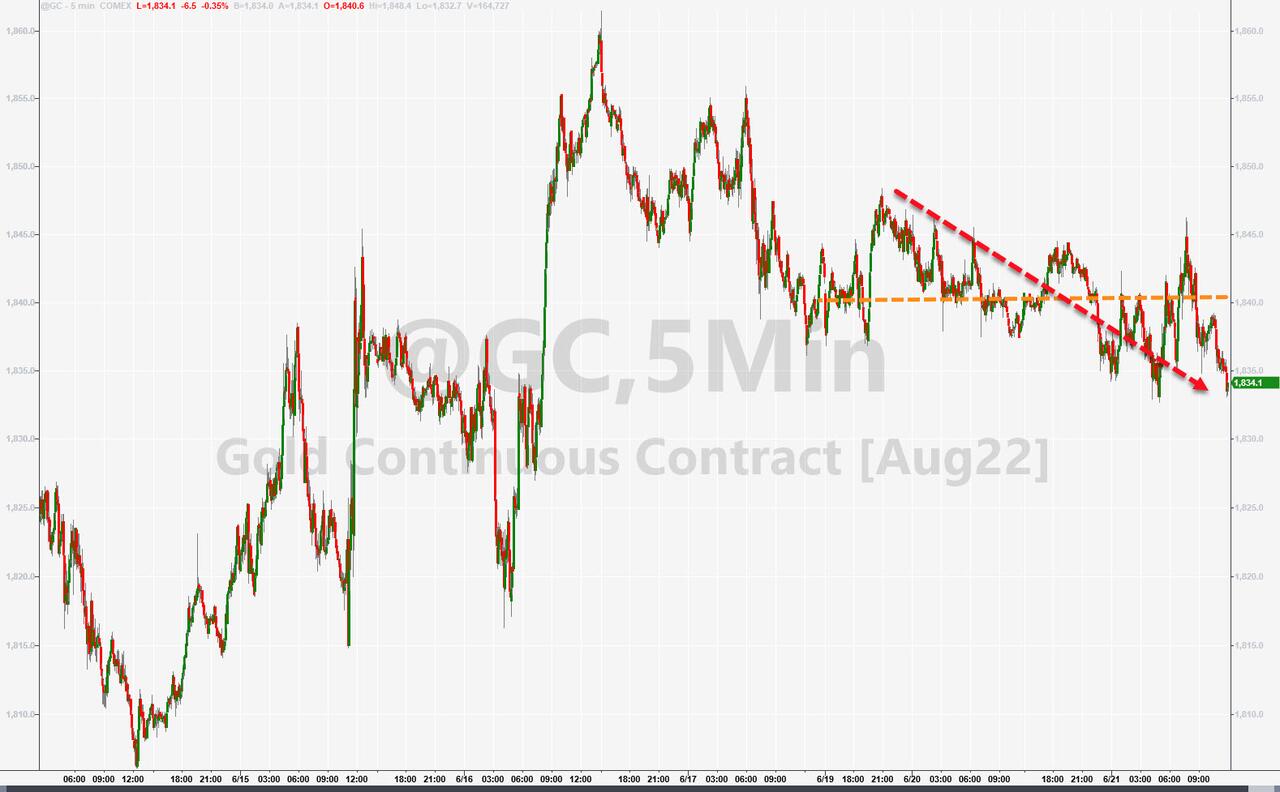
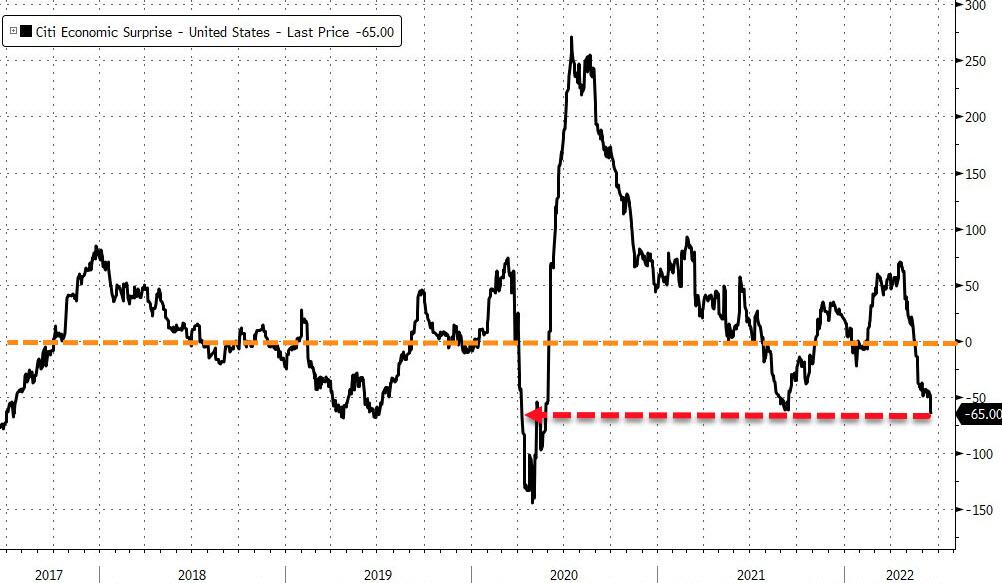
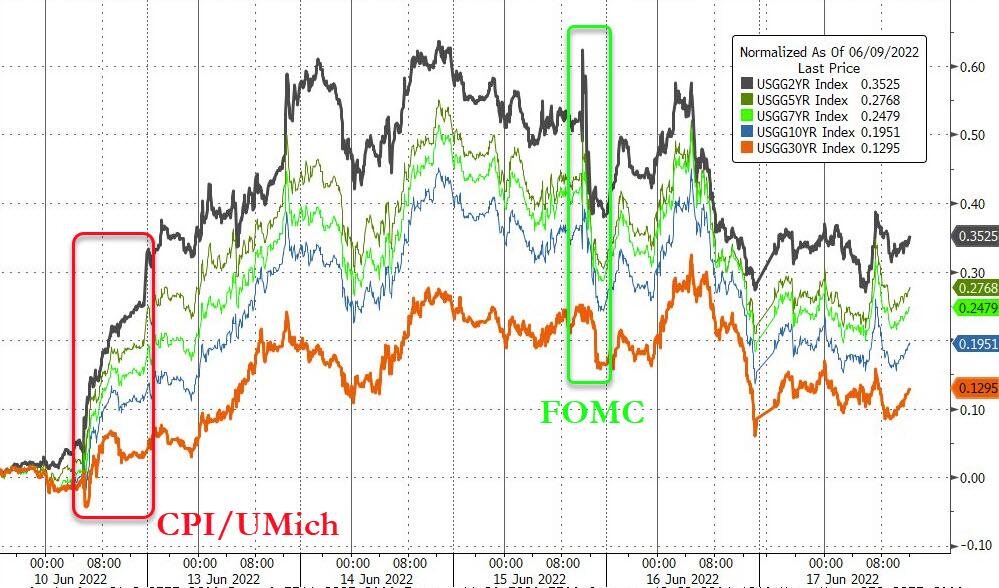
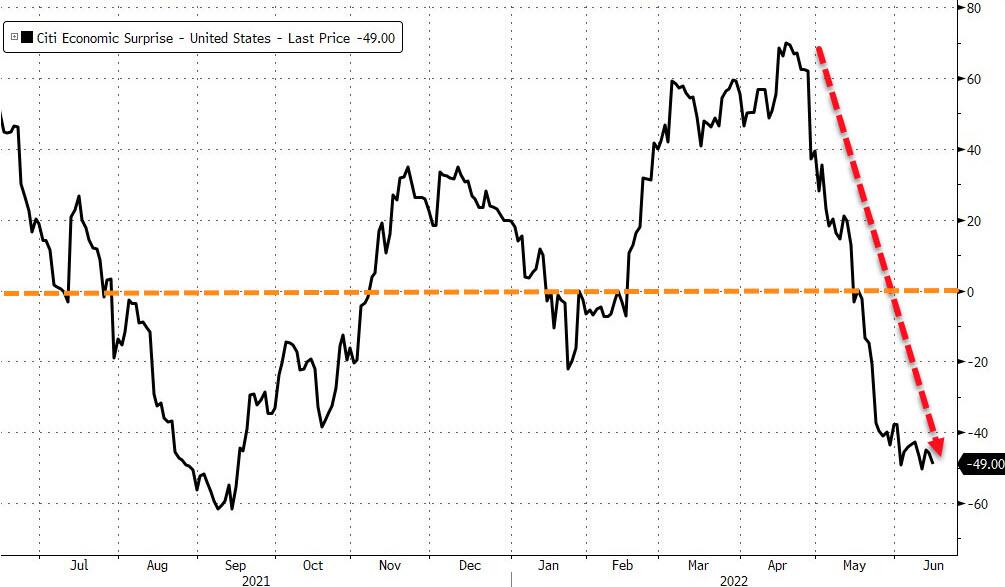
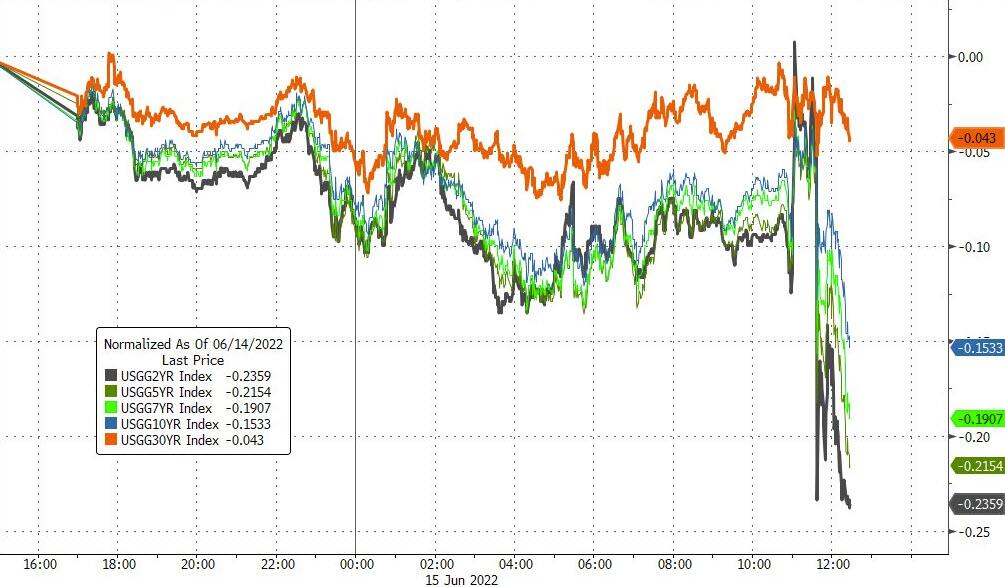
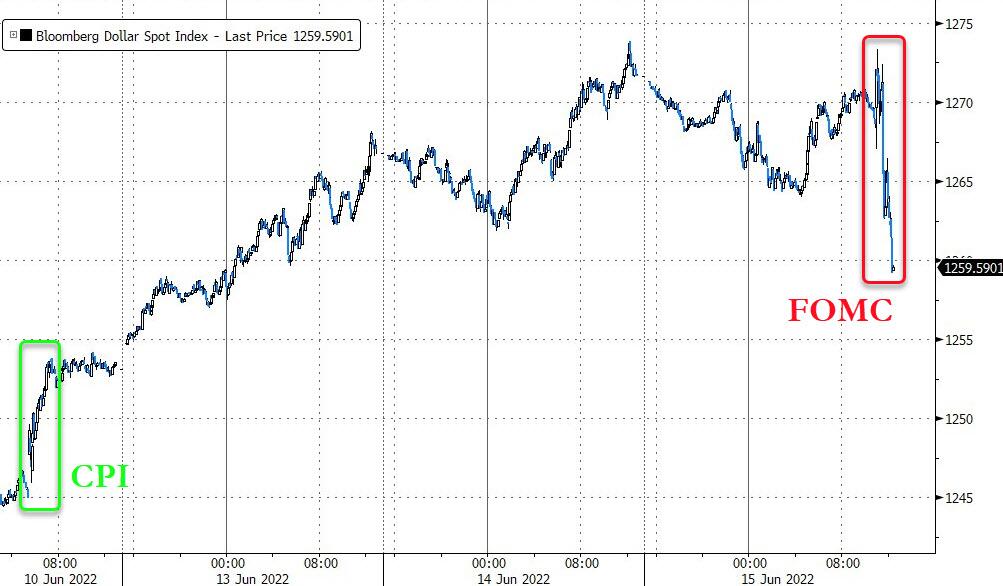
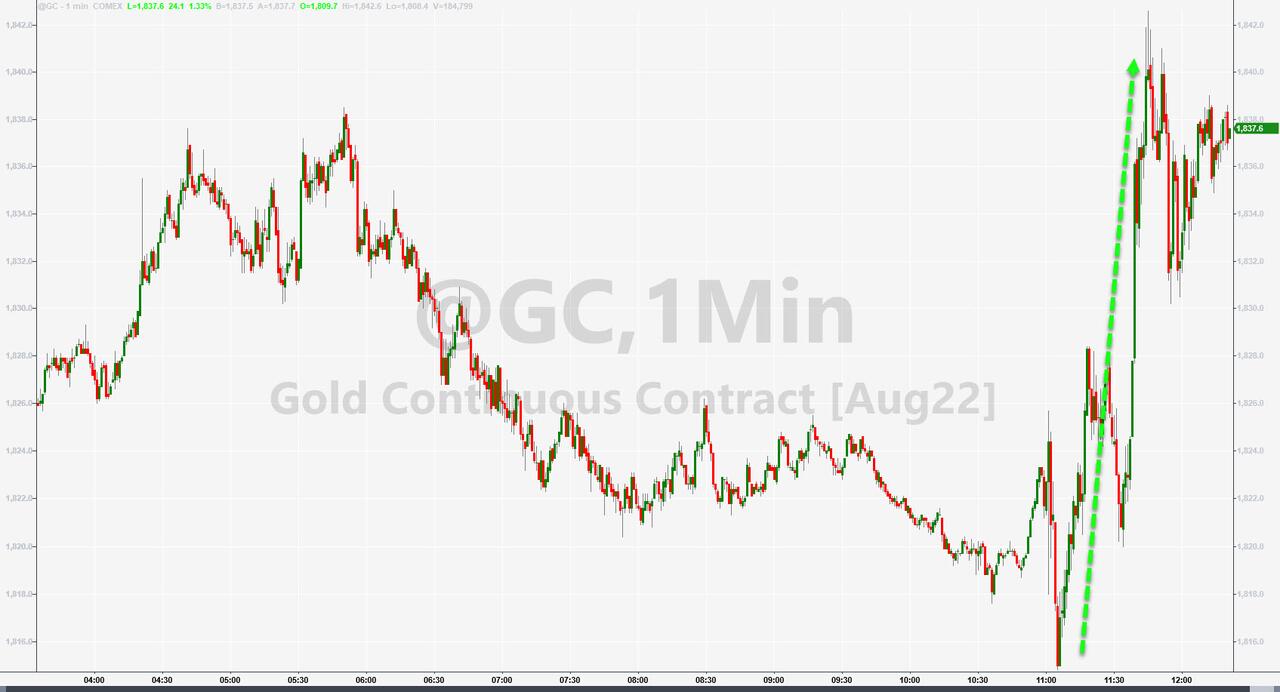
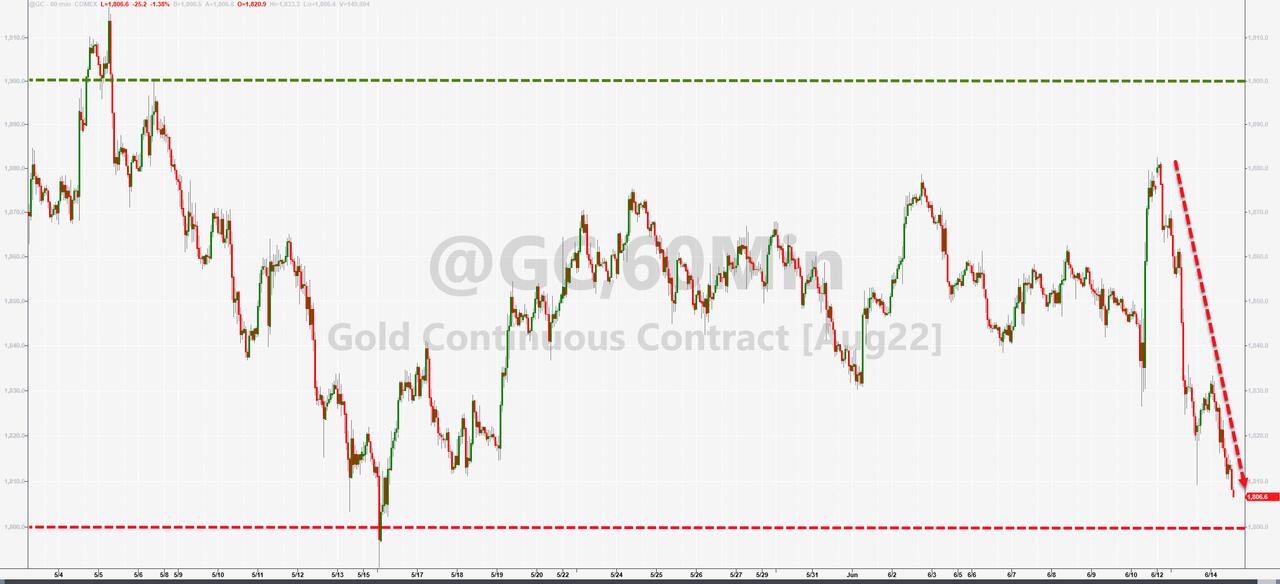
Adding to that negativity was a deteriorating Chicago’s National Activity index. As a result, we can see that the Economic Surprise index keeps worsening. Bond yields were mixed with the 10-year adding 6 bps to close at 3.30%. The US Dollar slid, but it was not enough to lend support to gold, as the precious metal lost -0.42%.
In the end, today was simply a reprieve for the buy-and-holders, but keep in mind that one bullish day does not indicate a directional trend change.
Read More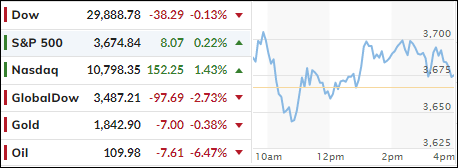
