Popping And Dropping

Ulli Market Commentary Contact

[Chart courtesy of MarketWatch.com]

  1. Moving the markets

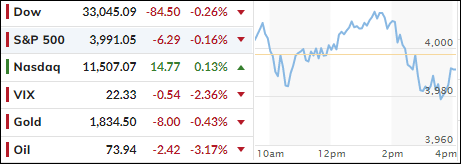
The release of the most recent Fed minutes was on traders’ minds, while they looked for clues as to what the next move by the Central Bank would be in terms of inflationary measures. An early bounce of hope reversed, despite a short squeeze, and the bears scored another win with the S&P 500 now having notched its 4th straight day of losses.

The Fed’s summary showed that inflation hovered well above the Fed’s 2% target, while the Labor market appears to be still very tight and thereby continues to keep upward pressure on wages and prices.

The only positive was the mention of a welcome reduction in the monthly pace of price increases, as MarketWatch reported. But, the disclaimer followed right away in that more progress would be required to confirm a sustainable downward path of inflationary trends.

In other words, no hope was given to those still thinking that the Fed might pause/pivot in the near future. As a result, the early bullish theme shifted into reverse, and two of the three major indexes closed the session with modest losses.

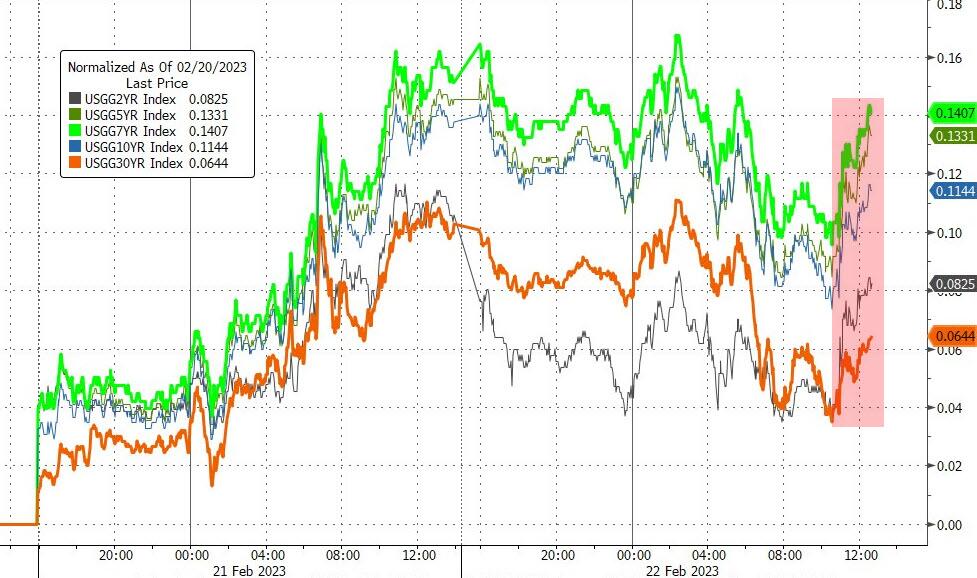
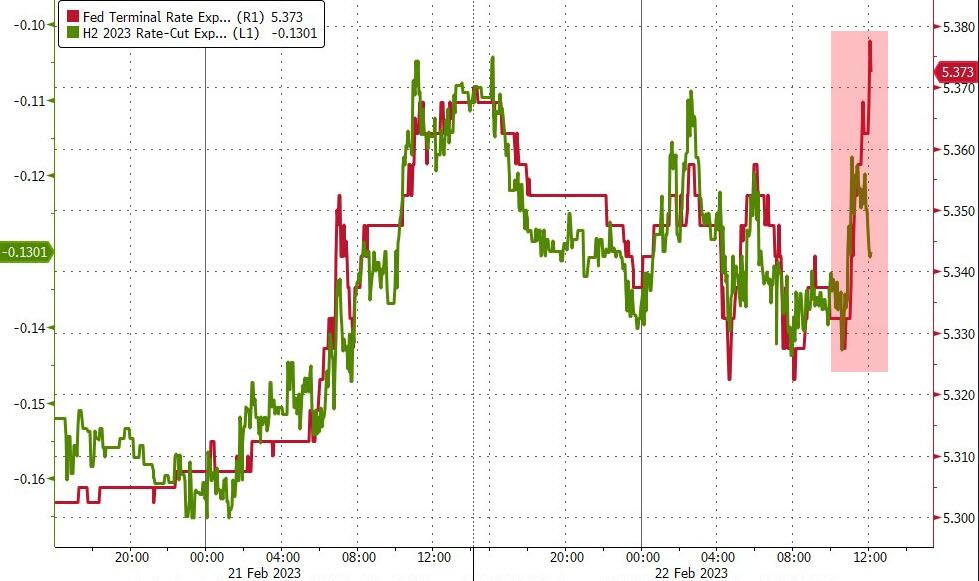
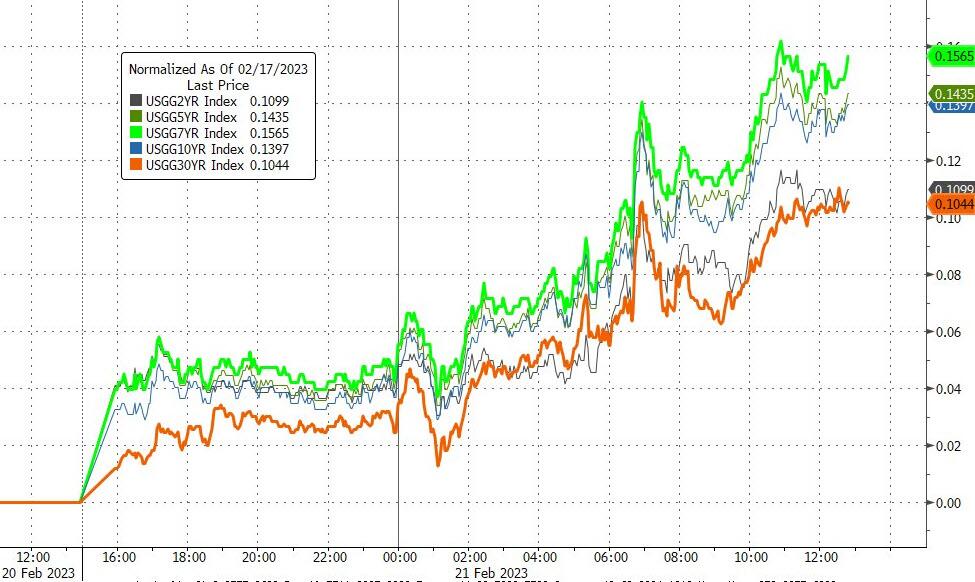
Bond yields rode the roller coaster with yields softening somewhat, as the 10-year pulled back a modest 3 bps to close at 3.925%. However, the Fed’s terminal rate moved higher from yesterday’s 5.33% indicating more hawkishness.  

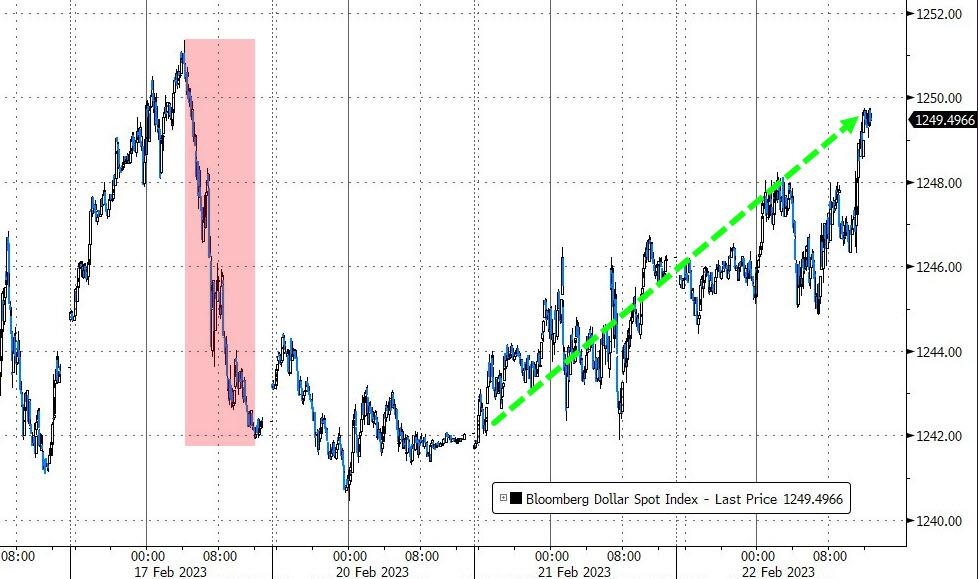
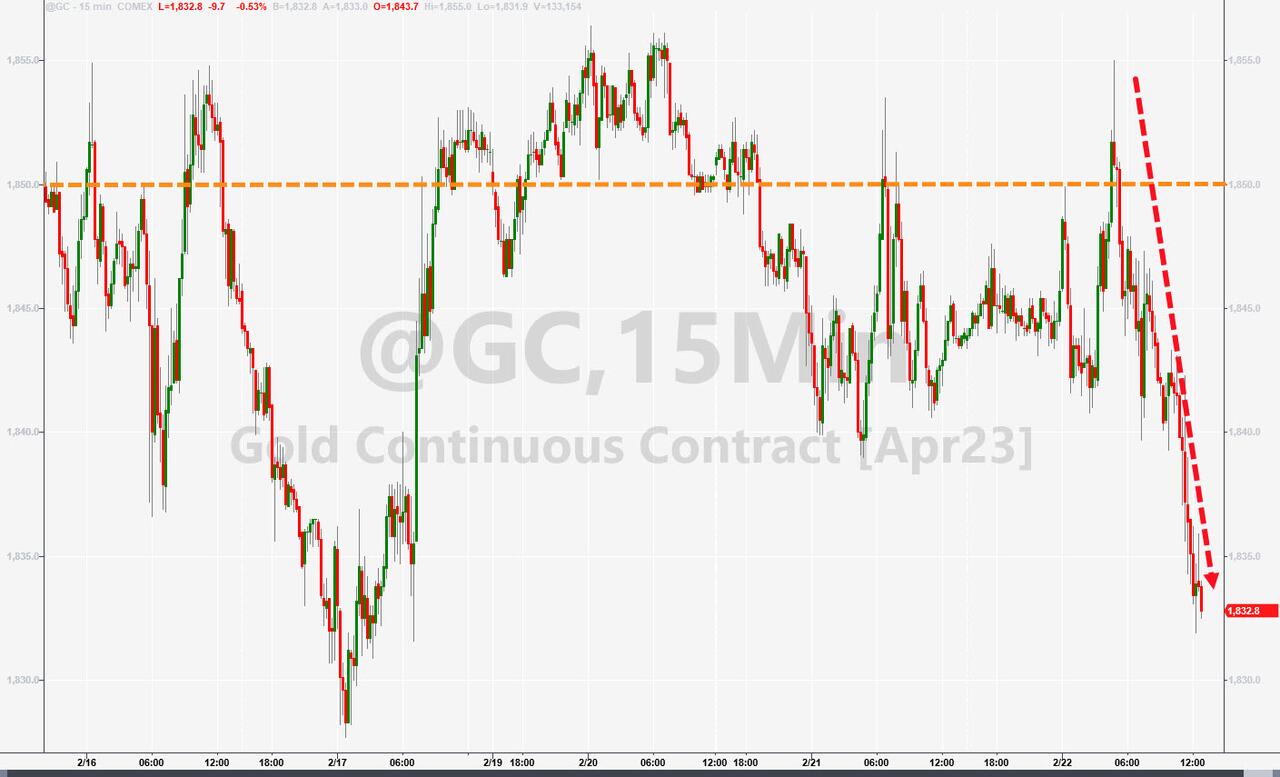
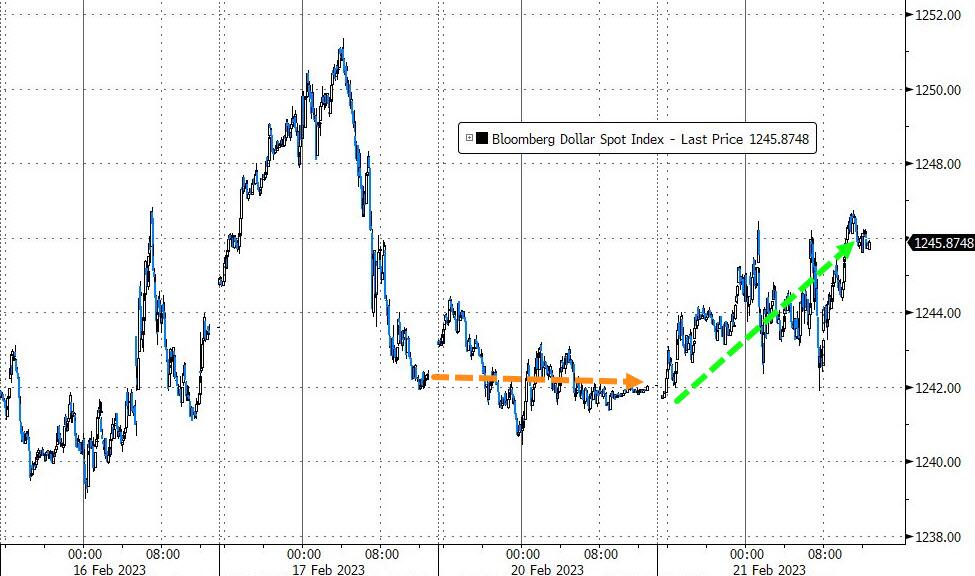
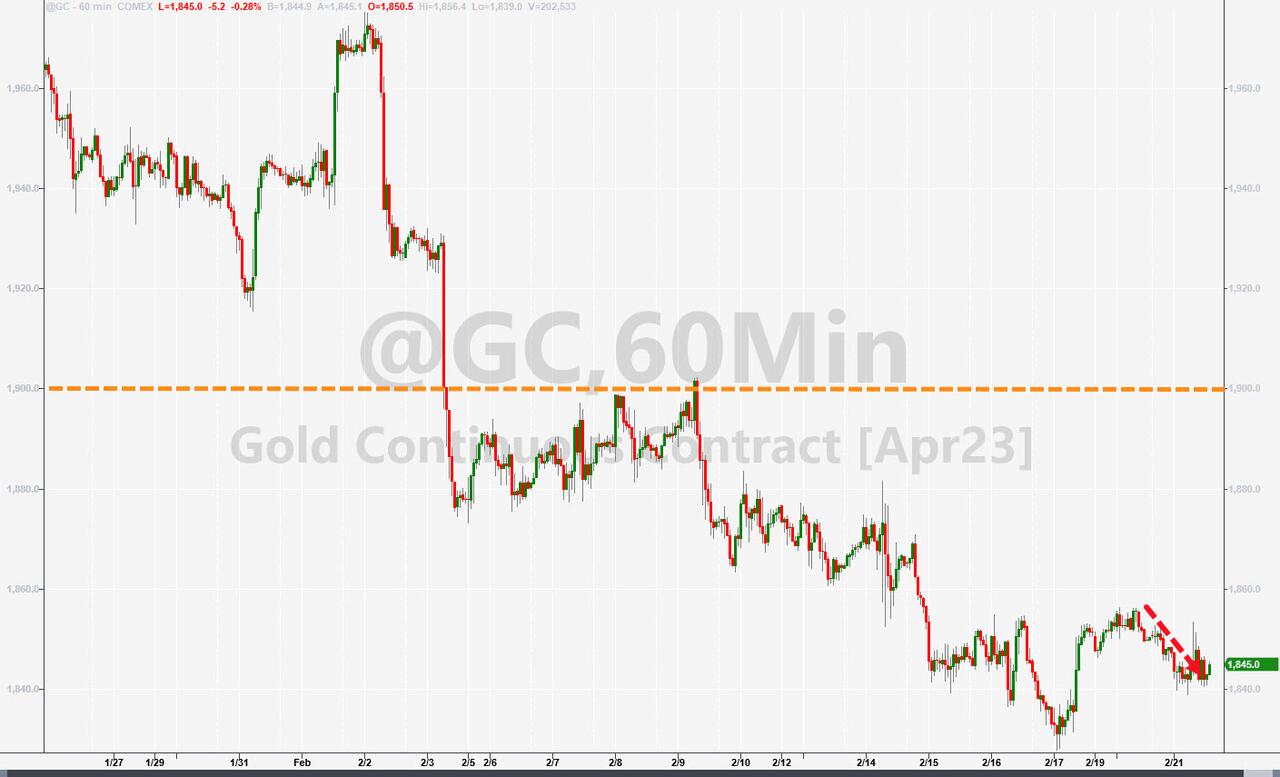
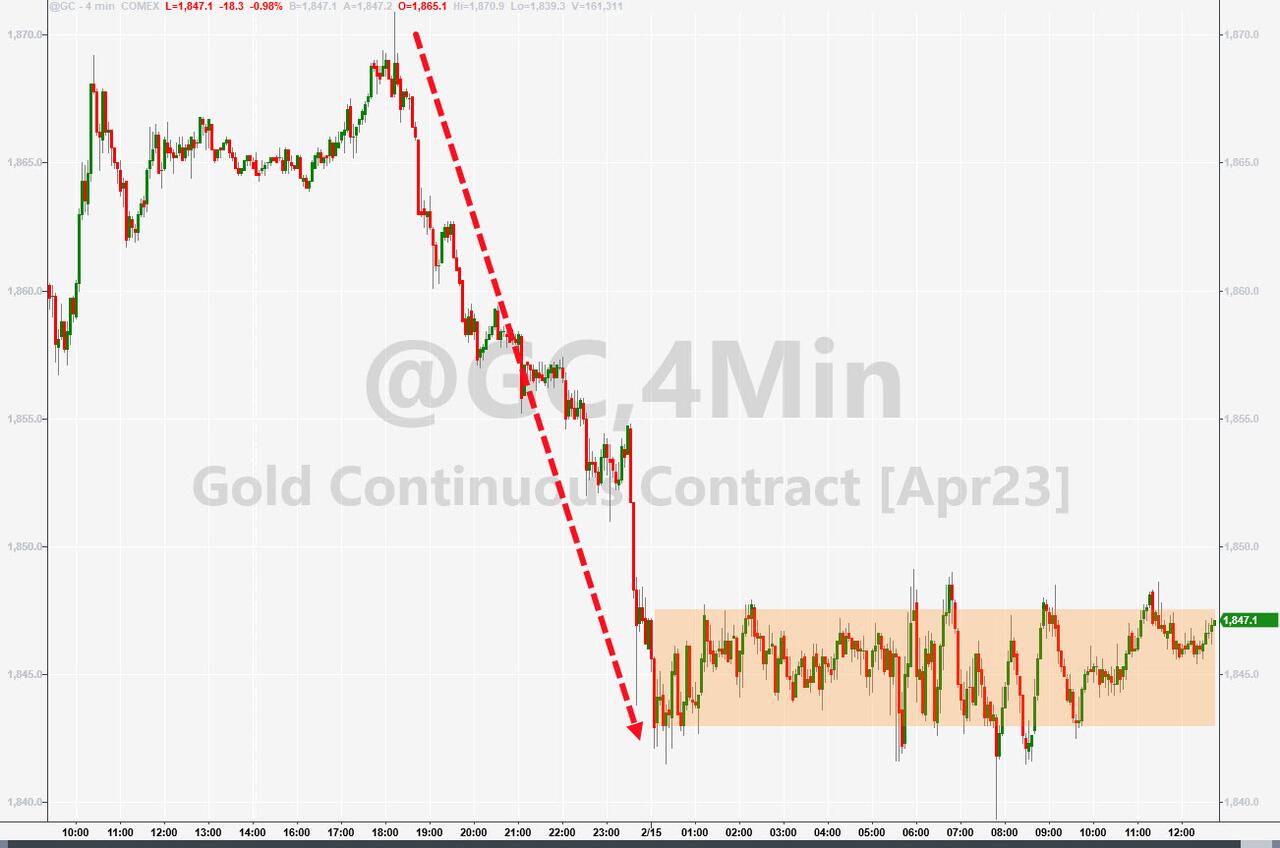
The US Dollar resumed its trajectory to higher prices and wiped out the majority of Friday’s losses. Gold slipped again and was not able to hang on to its $1,850 level.

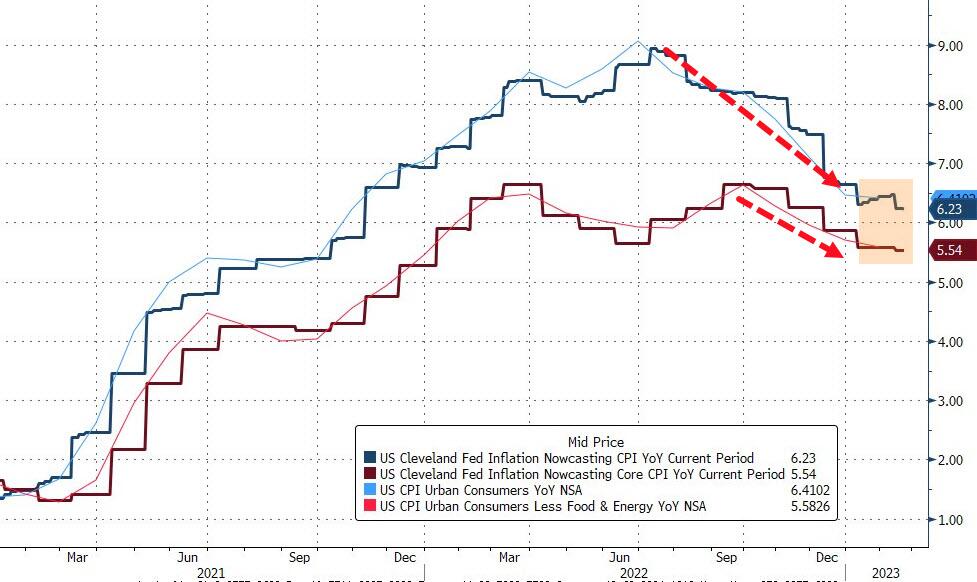
The Cleveland Fed’s own inflation forecasting model shows that the disinflation of the past few months appears to have come to an end, as ZeroHedge commented. Does that mean inflation will now rear its ugly head again?

I believe those odds are far better than 50-50.   

Read More
Reality Check

Ulli Market Commentary Contact

[Chart courtesy of MarketWatch.com]

  1. Moving the markets

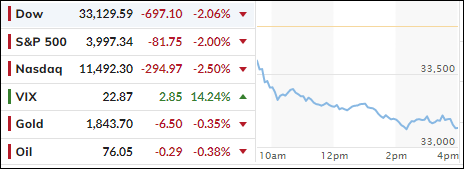
It appeared that traders and algos alike finally were confronted with a reality check, namely that interest rates will not retreat and likely move considerably higher. This has been the consistent theme of the Fed and its mouthpieces, and I have repeatedly suggested that front running and hopeful thinking does not change underlying facts.

That’s what we saw today, as the markets experienced a phenomenon that I call “hammer time,” meaning that all asset classes were slammed and there was no place to hide. Especially not bonds, as all yields rose sharply with the 10-year propelling to its highest level this year (3.96%).

The widely held bond ETF TLT dropped over 2% on the day and has now lost some 6.3% for the month of February. So much for the perceived security of this asset class in times of turmoil.

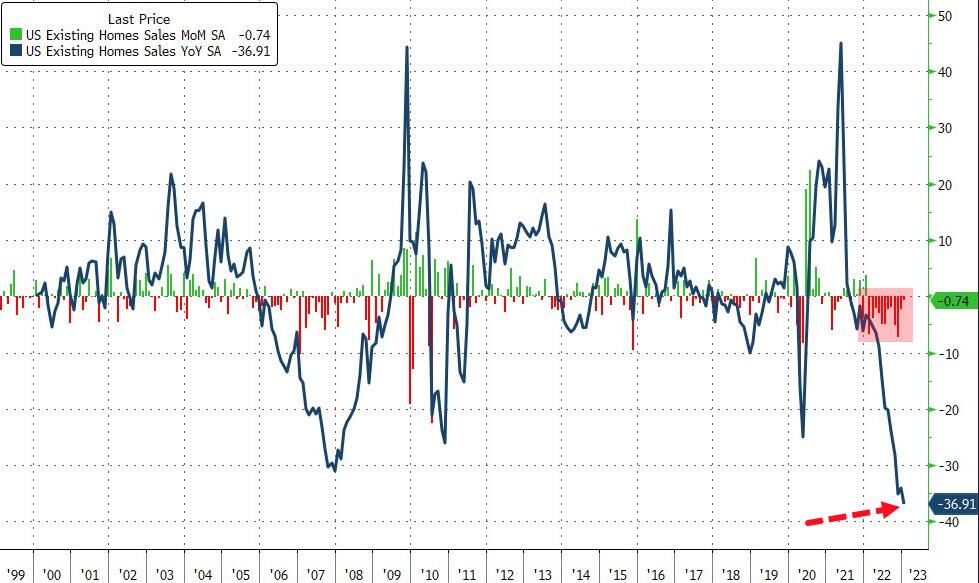
Surging rates obviously pressured the bullish theme, while retail earnings rang alarm bells regarding the health of the consumer and his ability to keep spending. After all, some 67% of all economic activity is consumer generated. News in the econ arena was poor, with Walmart issuing disappointing guidance, while Existing Home Sales unexpectedly declined in January and collapsed YoY by 37%. Ouch!

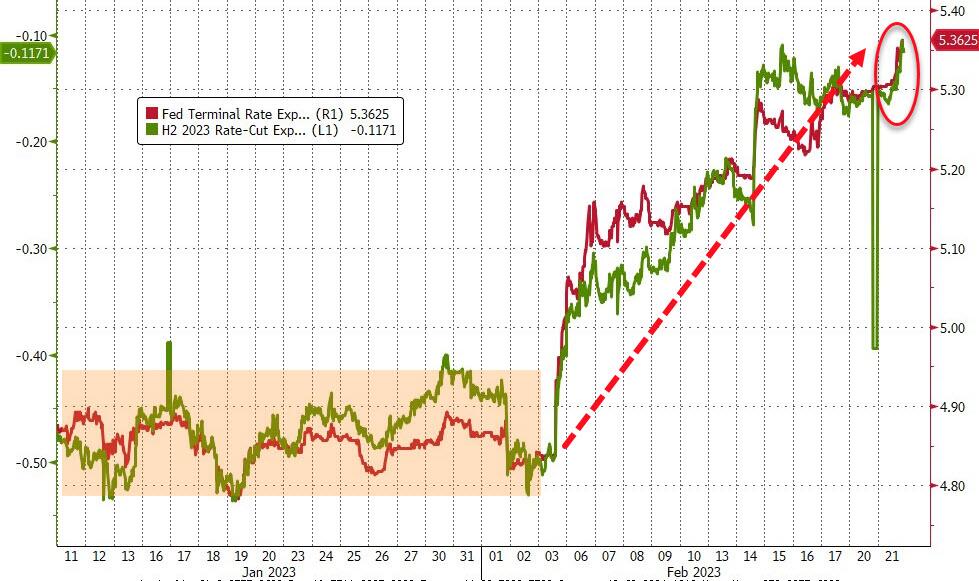
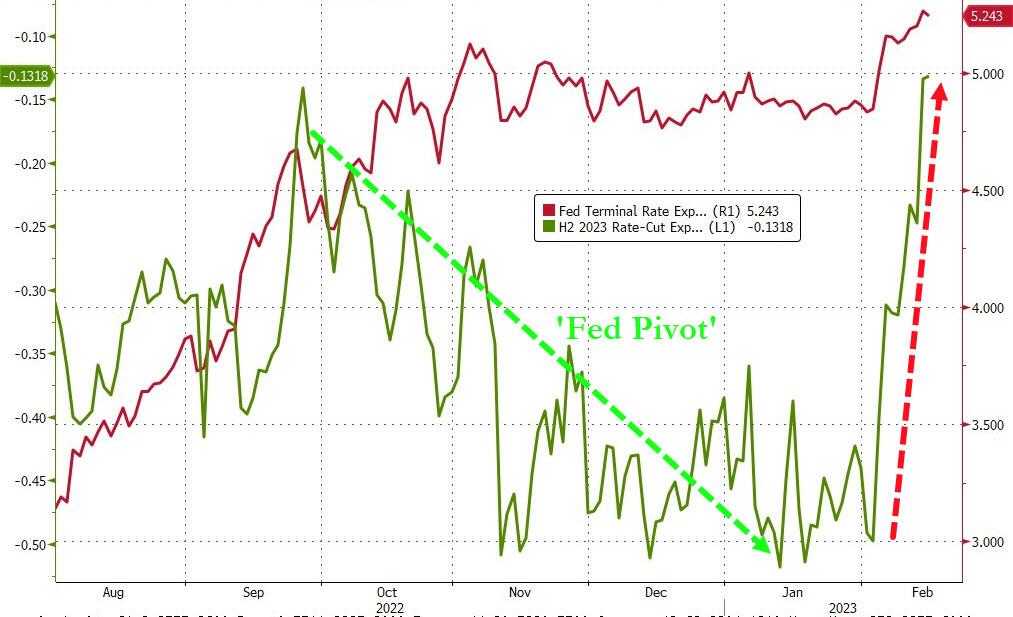
The Fed’s terminal rate exploded to over 5.3% and the usual dovish voices, counting on any rate cuts in 2023, disappeared mysteriously. This means, for the time being, that the consistently promoted “Fed pivot” narrative has died.  

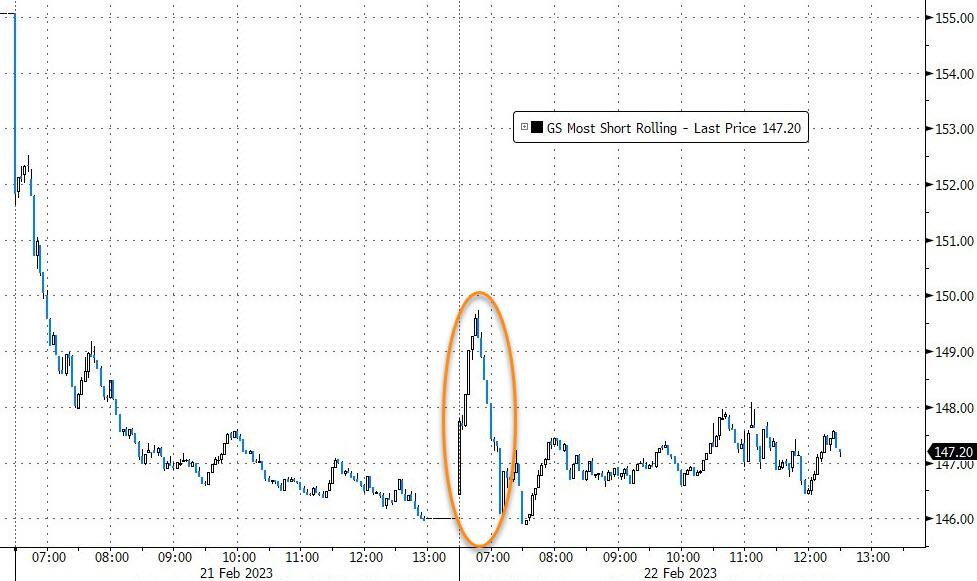
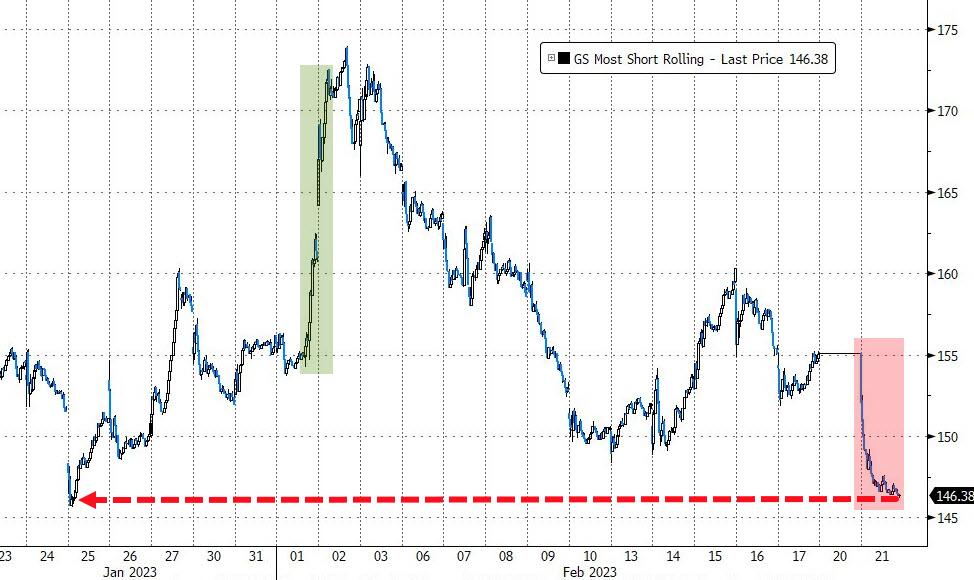
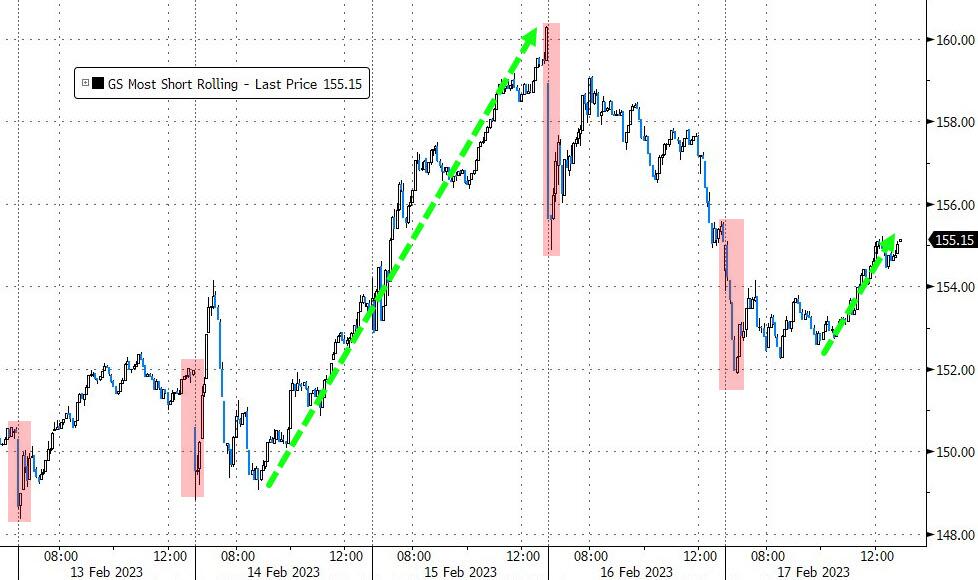
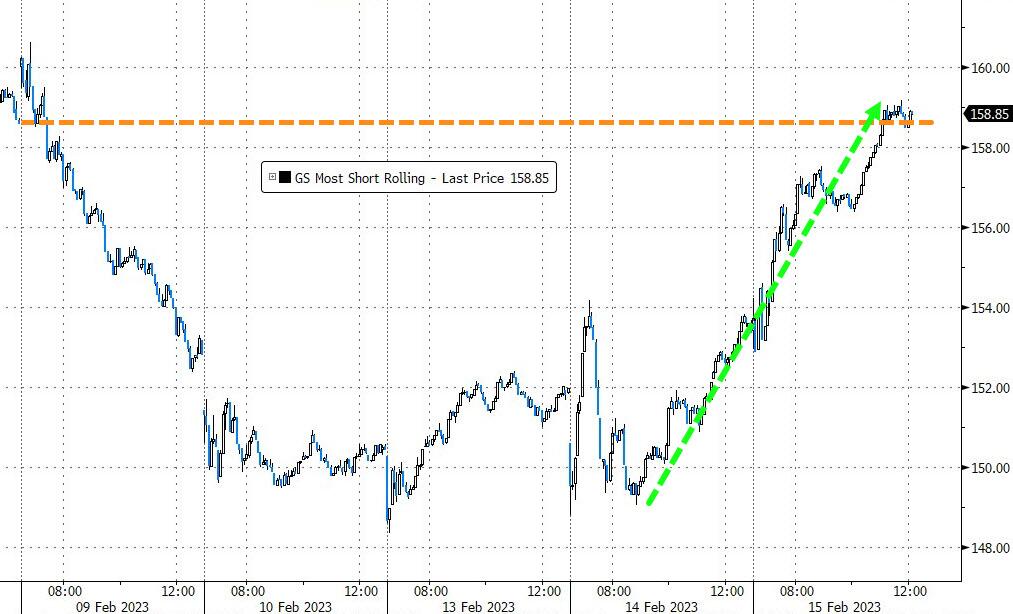
The most shorted stocks were clubbed like a baby seal, according to ZeroHedge, and saw their biggest single day decline since June 2022.    

The US Dollar gained a little on the day, causing Gold to drop a tad.

Read More
ETFs On The Cutline – Updated Through 02/17/2023

Ulli ETFs on the Cutline Contact

Below, please find the latest High-Volume ETF Cutline report, which shows how far above or below their respective long-term trend lines (39-week SMA) my currently tracked ETFs are positioned.

This report covers the HV ETF Master List from Thursday’s StatSheet and includes 312 High Volume ETFs, defined as those with an average daily volume of more than $5 million, of which currently 238 (last report: 239) are hovering in bullish territory. The yellow line separates those ETFs that are positioned above their trend line (%M/A) from those that have dropped below it.

Take a look:                                                                   

The HV ETF Master Cutline Report

In case you are not familiar with some of the terminology used in the reports, please read the Glossary of Terms.

If you missed the original post about the Cutline approach, you can read it here.               

ETF Tracker Newsletter For February 17, 2023

Ulli ETF Tracker Contact

ETF Tracker StatSheet          

You can view the latest version here.

HAWKISH FED SPEAK OVERWHELMS MARKETS

[Chart courtesy of MarketWatch.com]

  1. Moving the markets

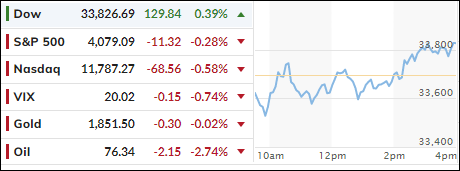
Yesterday’s thrashing of the markets continued early this morning, but the major indexes again climbed back, yet only the Dow was able to eke out a small gain.

Thursday afternoon, Fed mouthpieces Mester and Bullard combined forces to present a case for a bigger interest rate hike later this month, with Bullard not ruling out that he would support a 0.5% increase, thereby destroying hope that the expected 0.25% would be the new normal.

That pushed the terminal expiration date to almost 5.3% and clobbered any bullish market momentum with the Dow dumping over 400 points.

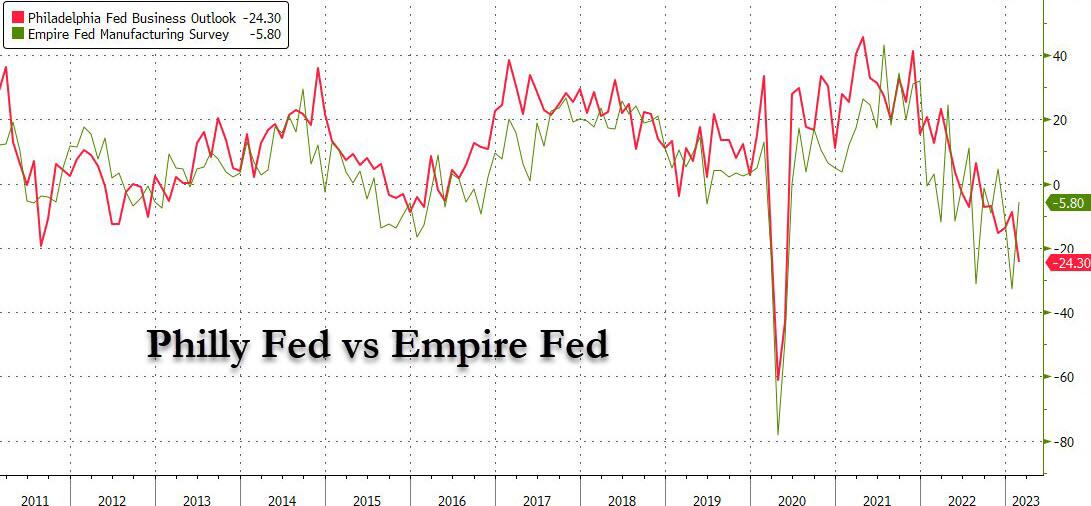
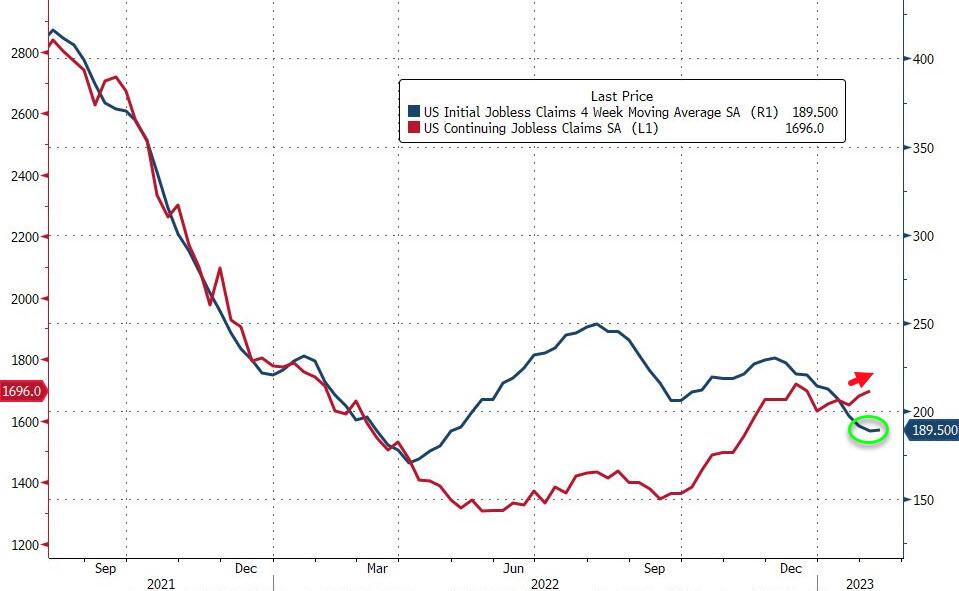
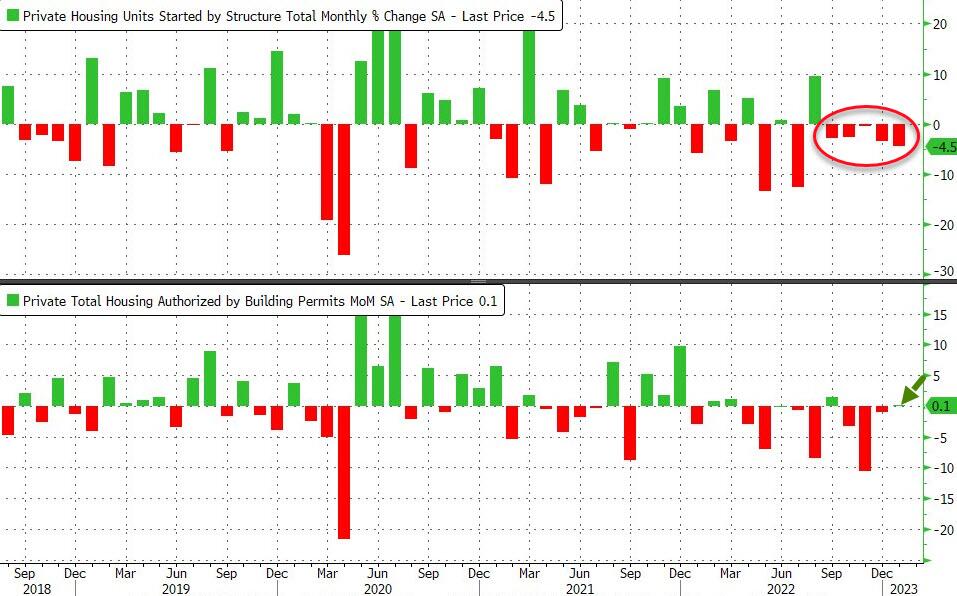
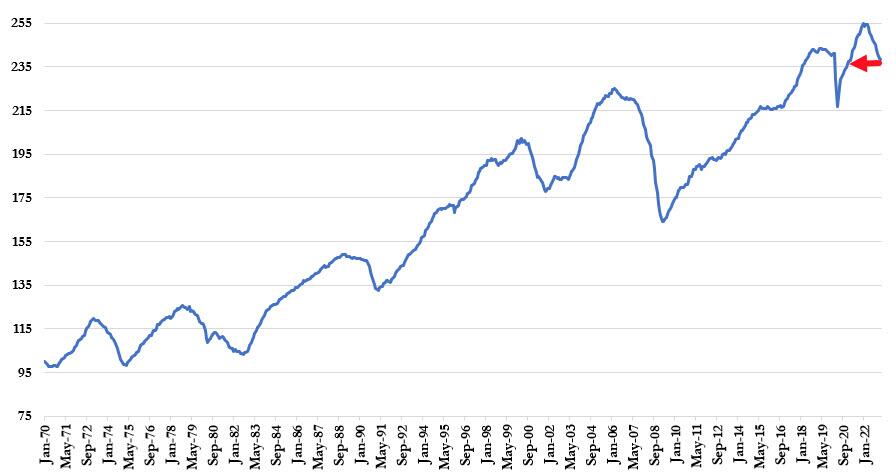
On the economic front, the various data points were bleak, as the manufacturing outlook tumbled to a 21-month low, jobless claims are hovering near one-year highs, housing starts showed their 5th straight monthly decline, Producer Prices surged more than expected, while Leading Indicators dropped for the 10th straight month.  

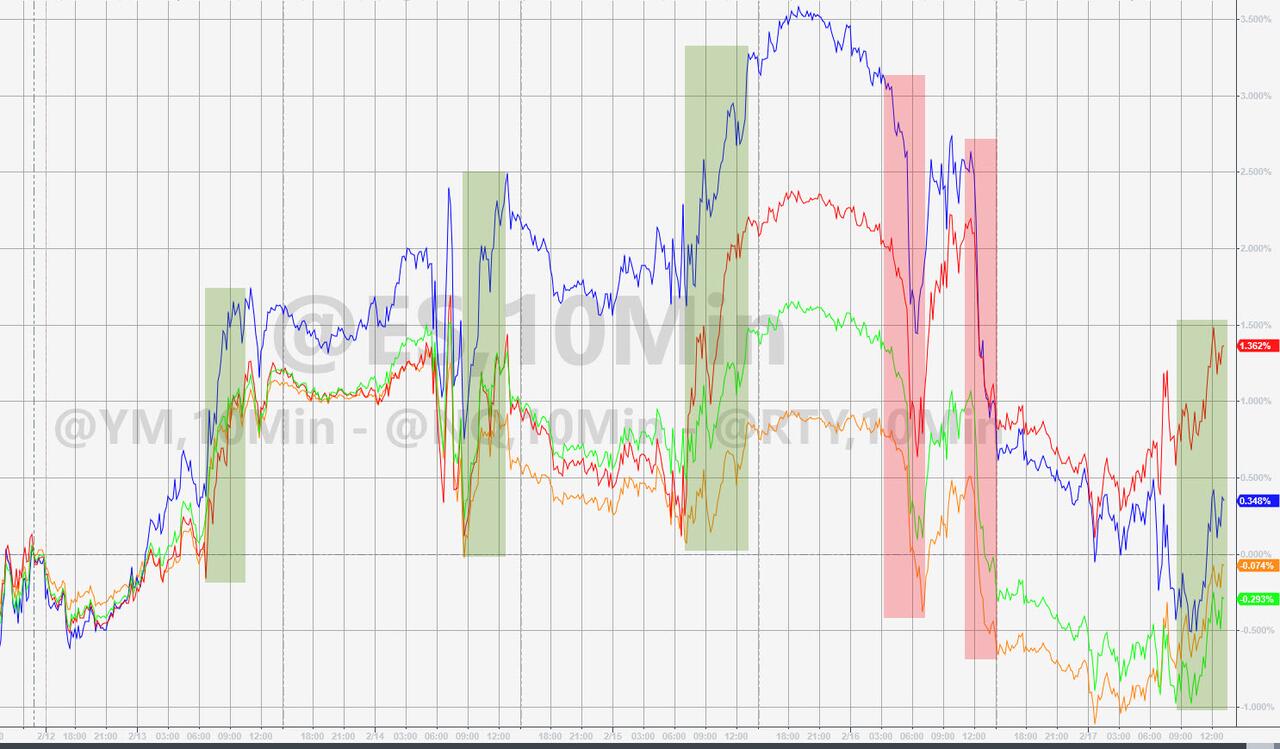
Needless to say, none of these created any warm fuzzies for traders and down we went. That weakness continued throughout today’s session, and, in the end, the S&P 500 gave up its early gains and recorded a small loss for the week, while giving up the gains for the month, despite an afternoon short squeeze.

And again, traders and algos alike are not listening to what the Fed is saying and continue to hope that a soft landing is on deck followed by a pause/pivot after a couple of more rate hikes. Unless the Fed walks back their hawkish talk, a pivot will not happen in the foreseeable future.

Bond yields rose for the week, not helping the bullish theme, as the financial conditions have tightened somewhat, thereby aligning with the Fed’s hawkish monetary policy direction.

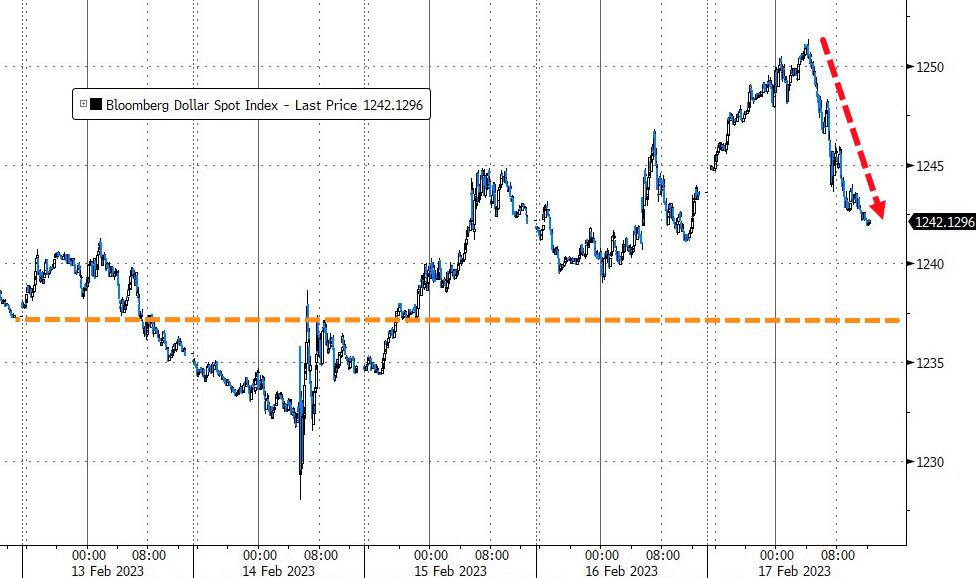
The US Dollar dumped for the day but gained for the week, while Gold retreated for the 3rd straight week after having risen for 6 straight weeks.  

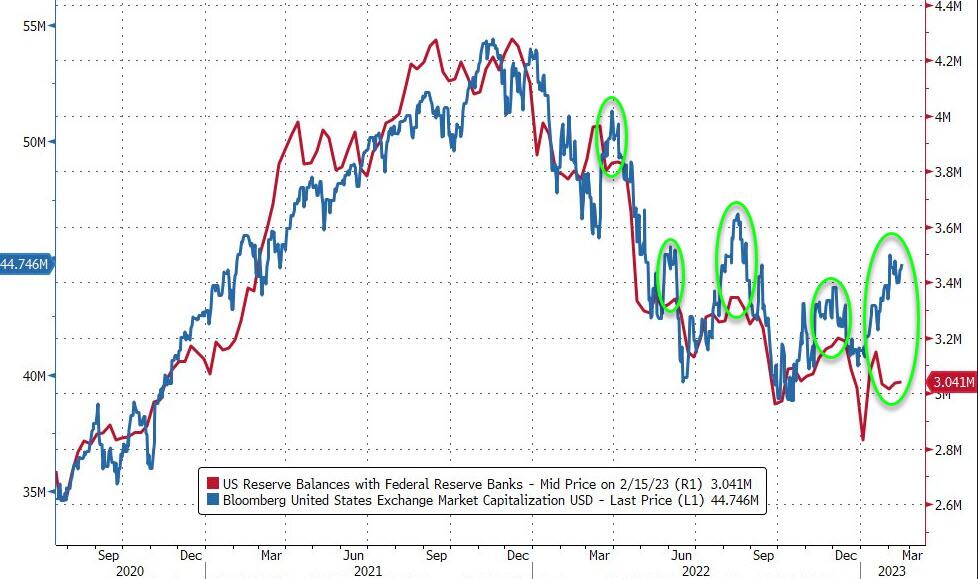
When charting stocks vs. balances at the Federal Reserve Banks, this chart makes it clear that those two move in sync most of the time. However, right now we are seeing a wide divergence making me ponder how this might end.

Hmm…

Read More
Weekly StatSheet For The ETF Tracker Newsletter – Updated Through 02/16/2023

Ulli ETF StatSheet Contact

ETF Data updated through Thursday, February 16, 2023

Methodology/Use of this StatSheet:

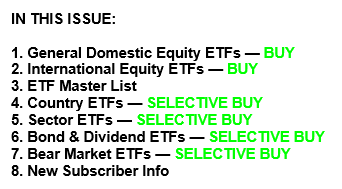
1. From the universe of over 1,800 ETFs, I have selected only those with a trading volume of over $5 million per day (HV ETFs), so that liquidity and a small bid/ask spread are assured.

2. Trend Tracking Indexes (TTIs)

Buy or Sell decisions for Domestic and International ETFs (section 1 and 2), are made based on the respective TTI and its position either above or below its long-term M/A (Moving Average). A crossing of the trend line from below accompanied by some staying power above constitutes a “Buy” signal. Conversely, a clear break below the line constitutes a “Sell” signal. Additionally, I use a 12% trailing stop loss on all positions in these categories to control downside risk.

3. All other investment arenas do not have a TTI and should be traded based on the position of the individual ETF relative to its own respective trend line (%M/A). That’s why those signals are referred to as a “Selective Buy.” In other words, if an ETF crosses its own trendline to the upside, a “Buy” signal is generated. Here too, I recommend trailing sell stop of 12%, or less, depending on your risk tolerance.

If you are unfamiliar with some of the terminology, please see Glossary of Terms and new subscriber information in section 9.     

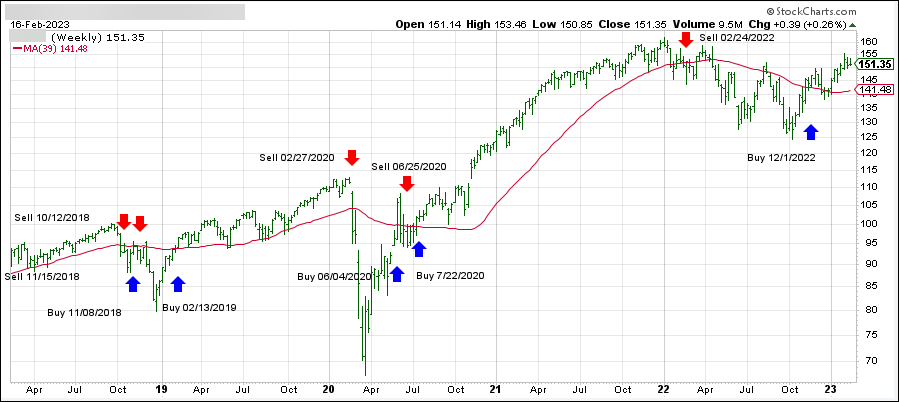
1. DOMESTIC EQUITY ETFs: BUY — since 12/01/2022

Click on chart to enlarge

Our main directional indicator, the Domestic Trend Tracking Index (TTI-green line in the above chart) has reclaimed its long-term trend line (red) by +7.22% and remains in “Buy” mode for the time being.

Read More
Climbing Out Of A Hole—Again

Ulli Market Commentary Contact

[Chart courtesy of MarketWatch.com]

  1. Moving the markets

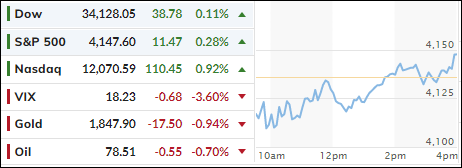
Yesterday’s hotter-than-expected CPI report could not keep the markets under water for any length of time. The same meme was at play today, after a stronger-than-expected retail sales report pushed equities into an early hole.

In an almost repeat performance, the major indexes battled back, reclaimed their unchanged lines and closed moderately in the green, with the Nasdaq scoring a 3-day win streak.

January retail sales rose 3%, which was a lot higher that analysts’ expectations of 1.9%. Traders interpreted that as an economy that is holding up well, despite the Fed’s aggressive rate hike policies.

This latest data point again confirms that the Fed is nowhere near pausing or pivoting its hawkish stance, and their mantra “higher for longer” appears to be the continued path for the remainder of 2023.

Hawkish Fed rate expectations are rising and so are stocks, which seems paradoxical. In other words, the tug-of-war between the Fed’s intention and the markets calling it a bluff continues in full swing. Right now, the markets are winning and, as is often the case, a well-timed short-squeeze gave the bulls a much-needed assist.   

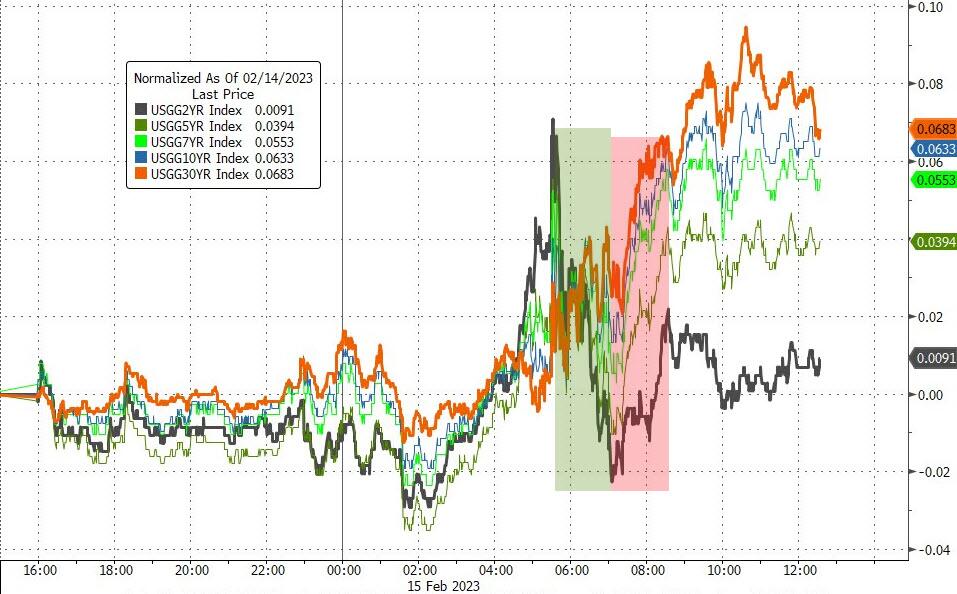
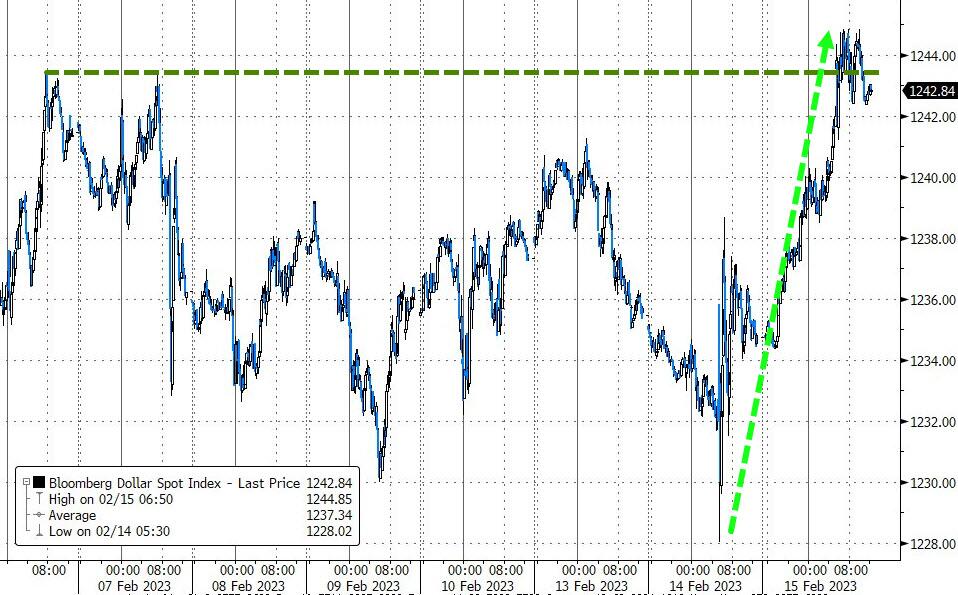
Even rising bond yields were not able to stop bullish sentiment, but they were able to propel the US Dollar higher, which hurt Gold, and the precious metal surrendered 0.9%.

ZeroHedge summed it up succinctly in that stocks simply don’t care about opposing data points due to their long-term outlook:

Higher rates sooner ->>> recession sooner ->>> crash sooner ->>> emergency rate cuts sooner (goal accomplished).

Read More