Below, please find the latest High-Volume ETF Cutline report, which shows how far above or below their respective long-term trend lines (39-week SMA) my currently tracked ETFs are positioned.
This report covers the HV ETF Master List from Thursday’s StatSheet and includes 312 High Volume ETFs, defined as those with an average daily volume of more than $5 million, of which currently 19 (last week 12) are hovering in bullish territory. The yellow line separates those ETFs that are positioned above their trend line (%M/A) from those that have dropped below it.
In case you are not familiar with some of the terminology used in the reports, please read the Glossary of Terms. If you missed the original post about the Cutline approach, you can read it here.
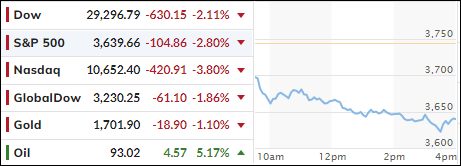
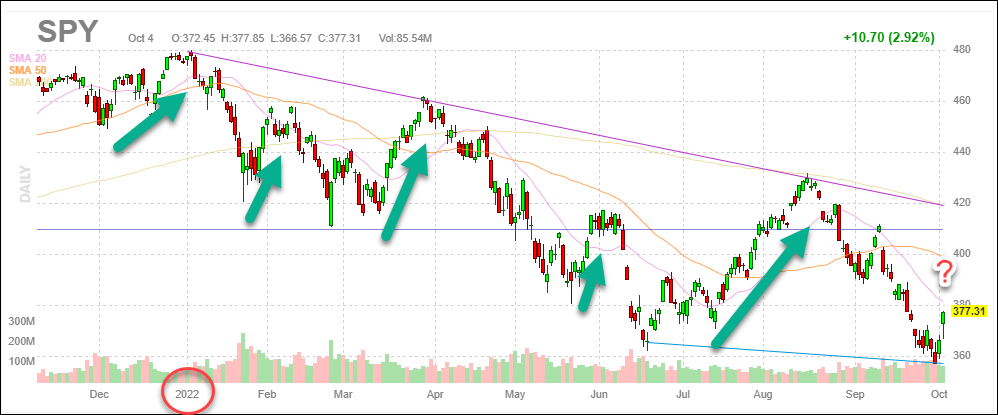
Right now, it sure looks like the bullish feel-good hope moves of Monday and Tuesday were nothing more than another dead cat bounce, with most gains having been surrendered as the bears battled back and took the upper hand.
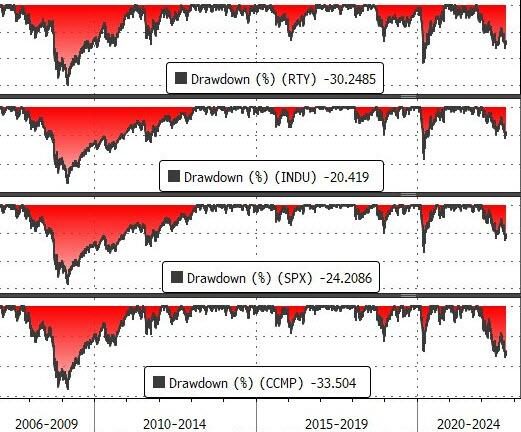
For the week, the S&P 500 managed to eke out a gain of 1.5%, which is a far cry from the almost 6% it had scored by Tuesday night. Looking at the bigger picture, you can see that all the major indexes are still down over 20% from their highs.
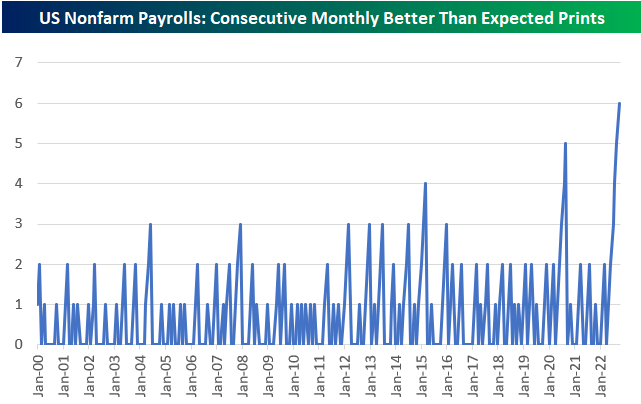
All eyes were on today’s jobs report, which showed that the US economy gained 263k jobs in September, just a bit lower than the estimate of 275k. However, what put a damper on bullish sentiment was the fact that unemployment slipped to 3.5% from the August’s 3.7%.
While that is good news, it was bad news for the market, because it reflects a strengthening jobs picture, despite the Fed’s attempt to slow the economy with continued rate hikes to battle inflation. Combining this drop in unemployment with yesterday’s low level of initial jobless claims, and you have an environment that will motivate the Fed to continue with its hawkish policy of nudging rates higher.
Added ZeroHedge:
Great news America – the unemployment rate has tumbled (with Hispanic unemployment at record lows).
Terrible news America – improving labor market statistics are the opposite of what The Fed is trying to do, and this data today is not going to encourage any pause or pivot anytime soon.
That was not what traders and algos wanted to see, and down we went. Not helping matters was a shockingly bad revenue and margin preannouncement from Advanced Micro Devices (AMD), which made a mockery of its own guidance from August, as ZeroHedge explained.
This disaster was followed by powerhouse FedEx, which offered lower volume forecasts, a surprise that sent its stock down some 4%.
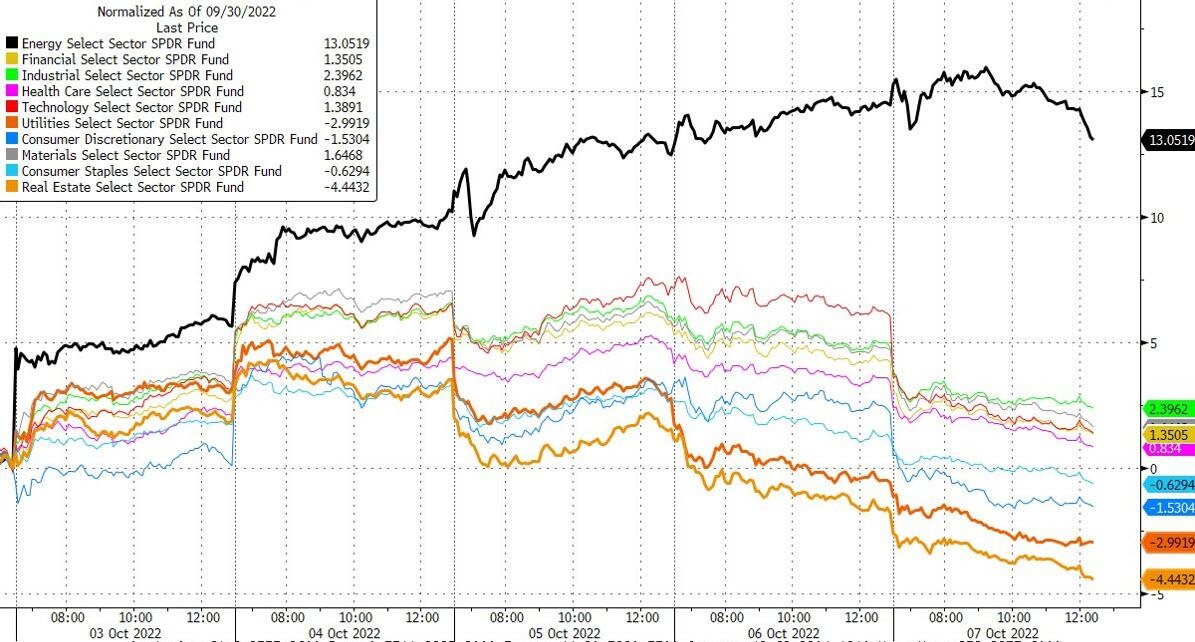
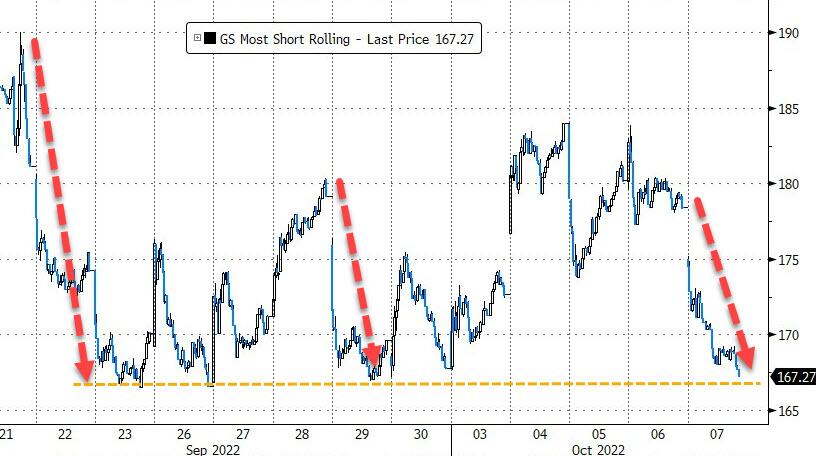
As ZH pointed out, even those traders invested in Defensives ended the week with a loss, which confirms my belief that this is the time to be out of the market and, due to ever increasing uncertainties, eliminate portfolio risk altogether, as even the most shorted stocks did nothing but ride the rollercoaster.
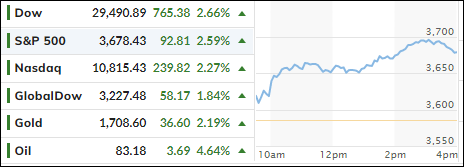
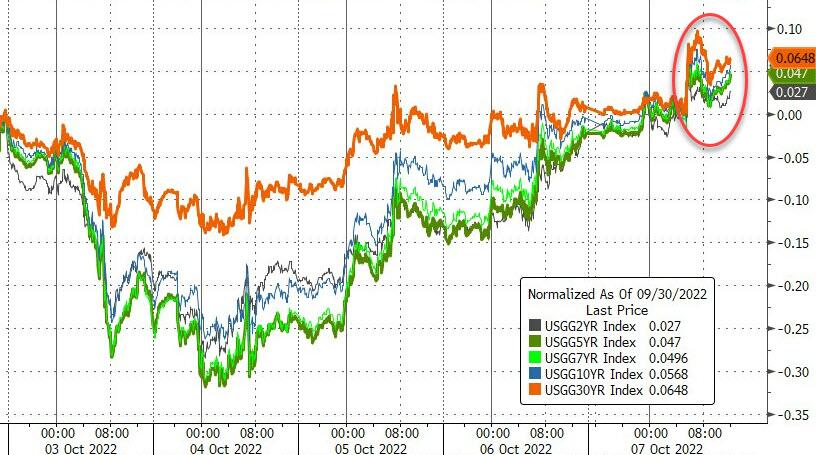
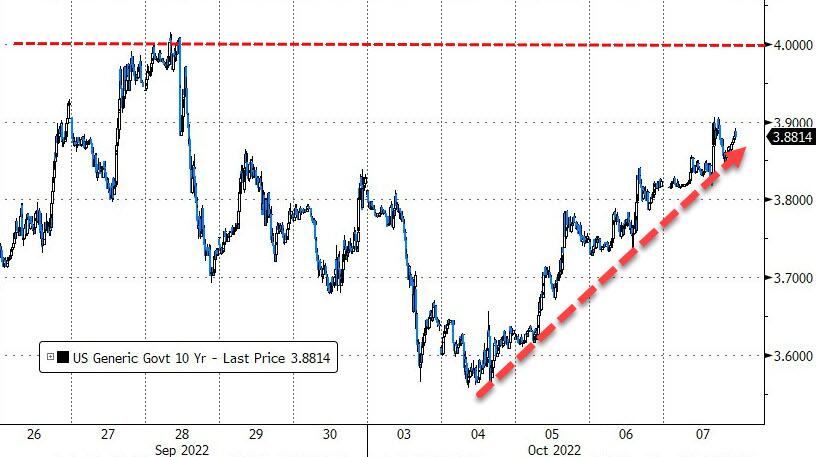
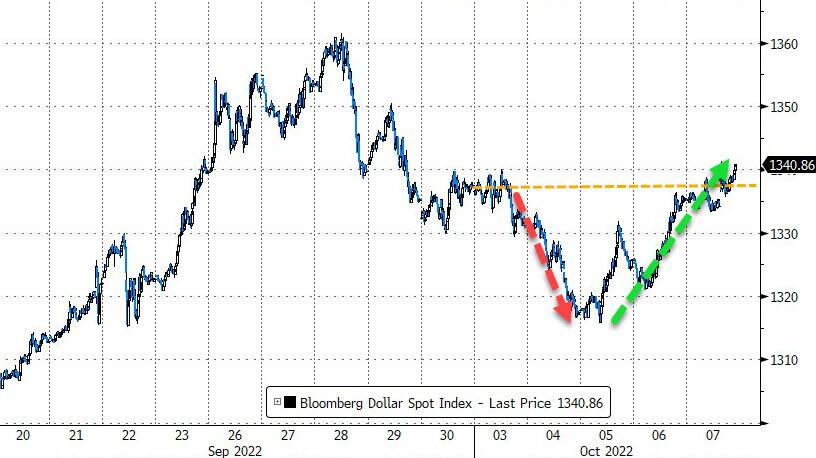
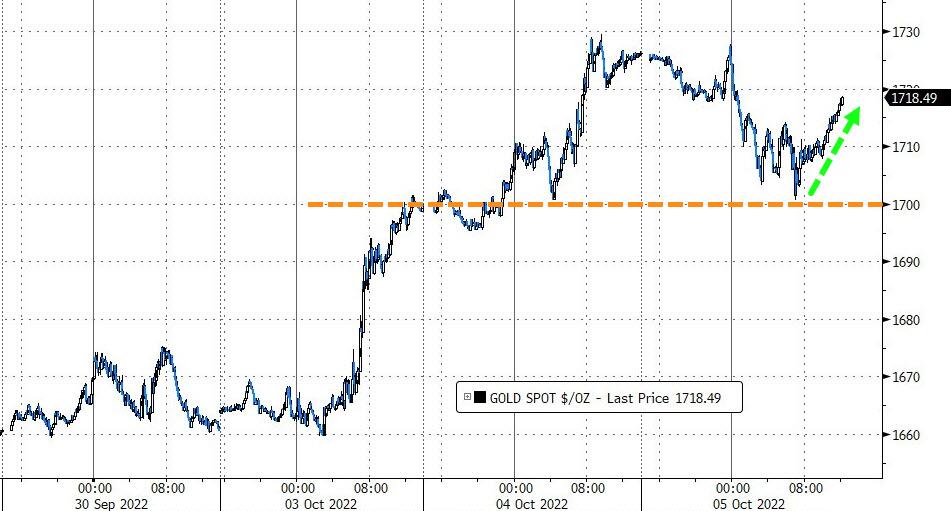
Bond yields ratcheted higher with the 10-year again trying to reclaim its 4% level but so far falling short of it. The US Dollar whipsawed this week and ended about unchanged with Gold following suit and managing to successfully defend its $1,700 level.
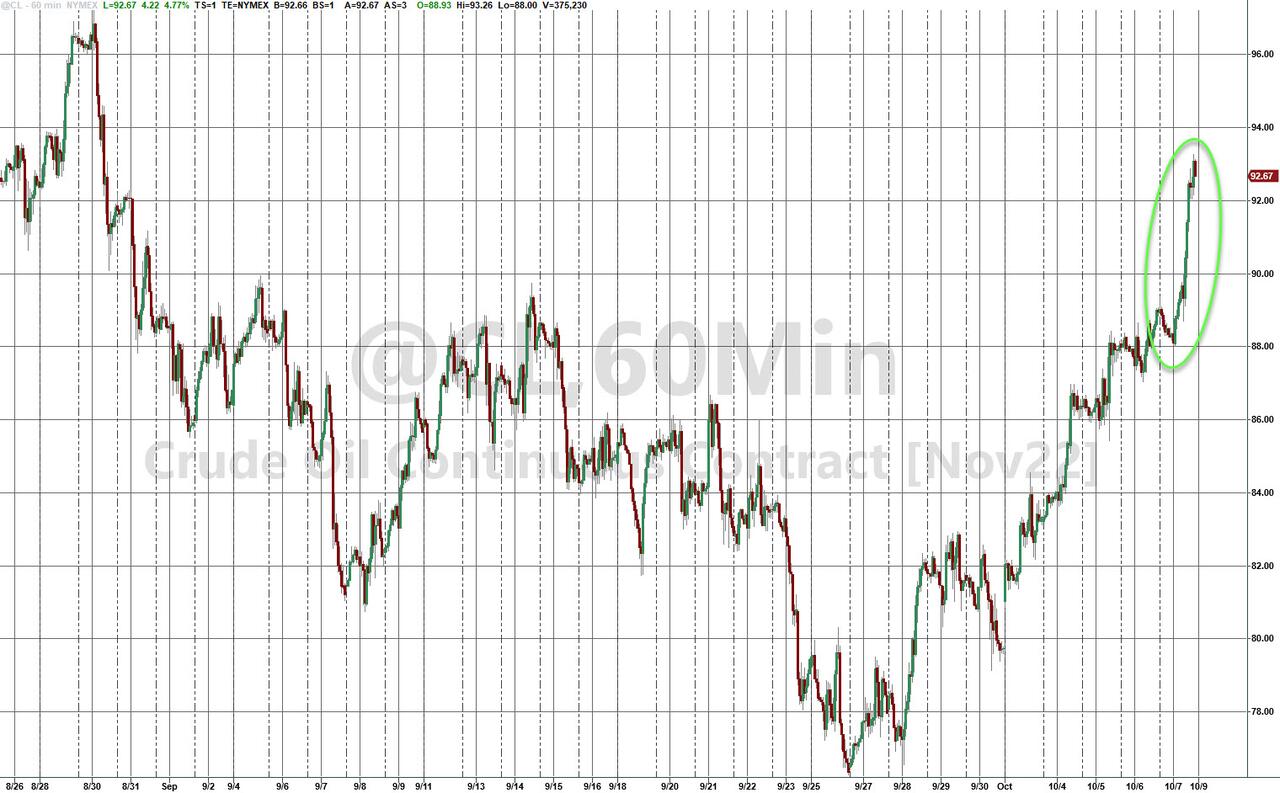
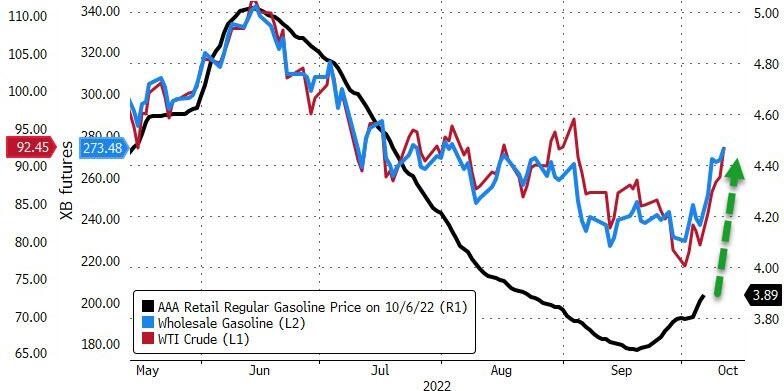
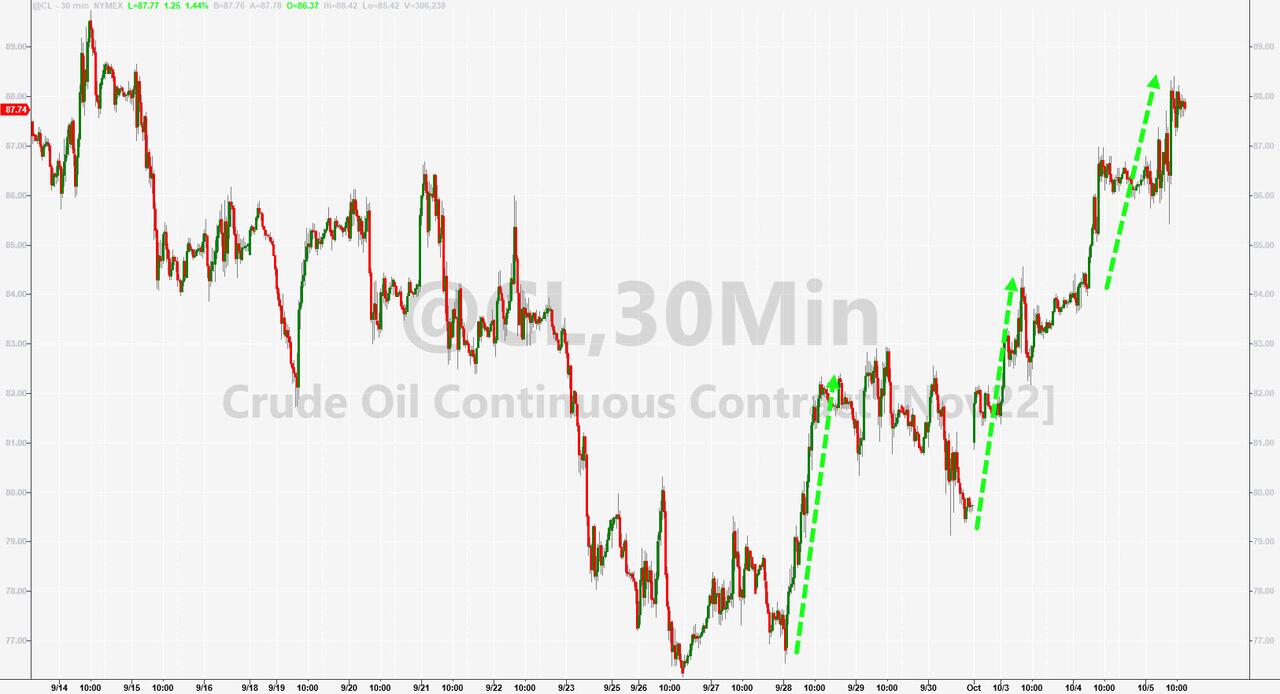
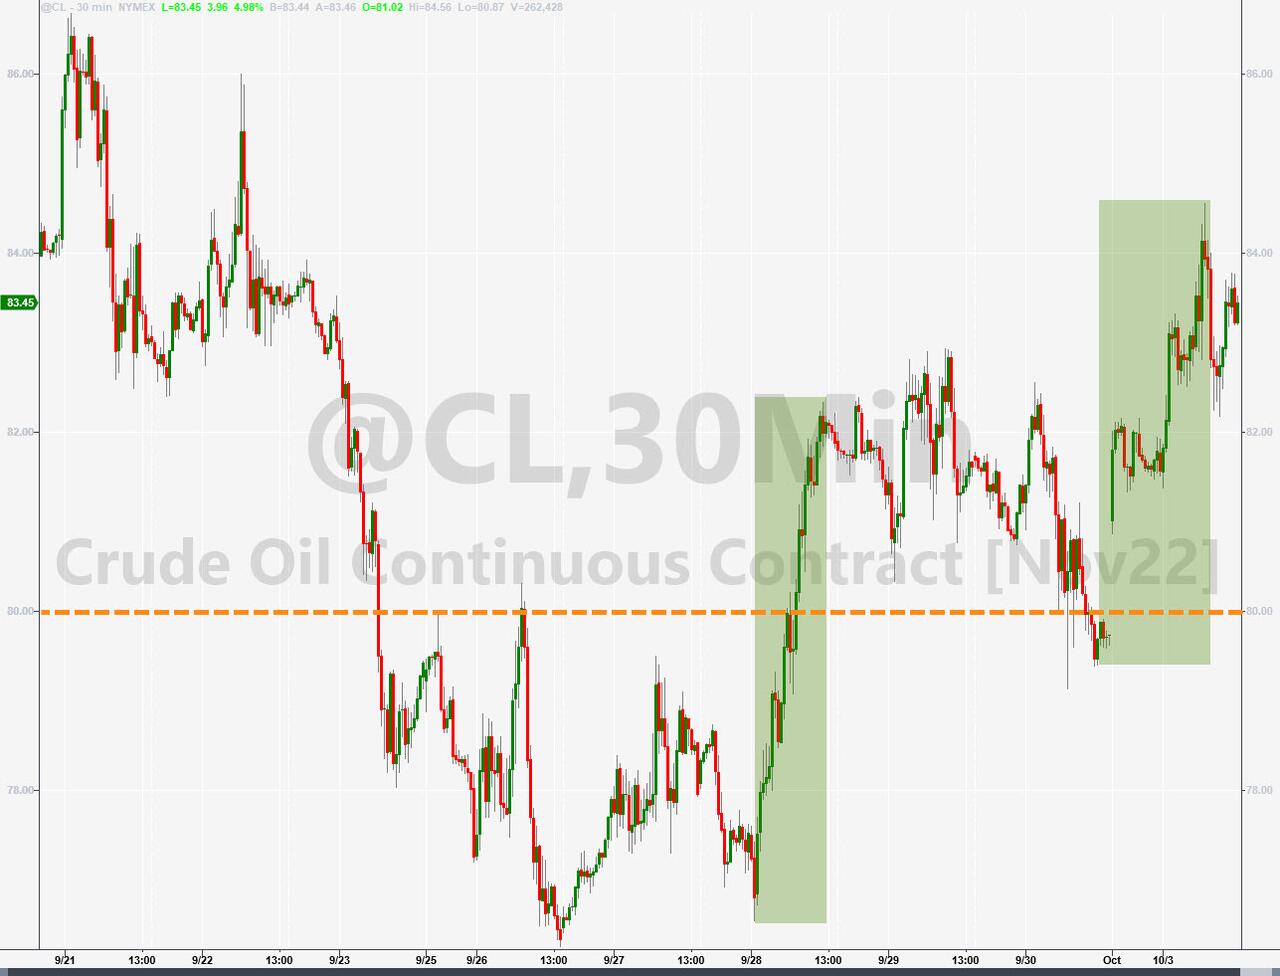
With OPEC+ going their separate ways, and reducing daily output, Crude Oil surged and ended the week around $93 with the magic $100 marker now being in striking distance. That also means, higher prices will be coming at the pump.
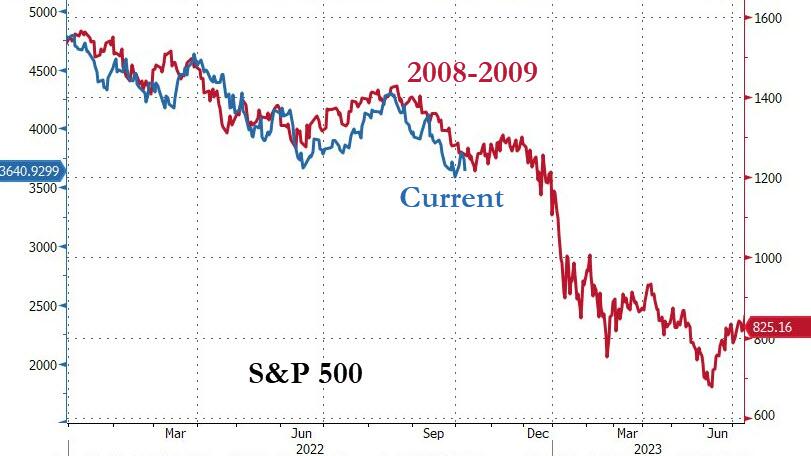
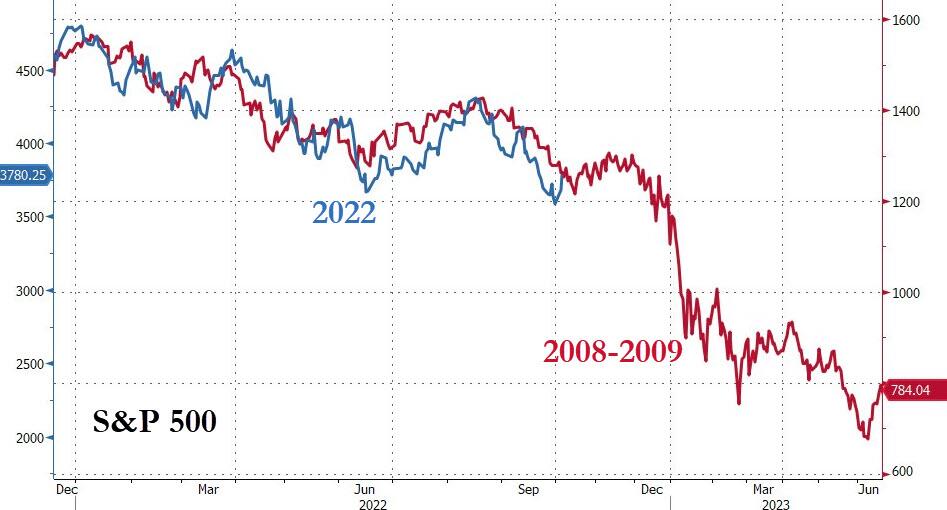
The big picture analog to 2008-2009 shows us that we are on target for a possible historical repeat, but we are only half way there.
Watching this slow motion trainwreck from the sidelines never felt so good.
ETF Data updated through Thursday, October 6, 2022
Methodology/Use of this StatSheet:
1. From the universe of over 1,800 ETFs, I have selected only those with a trading volume of over $5 million per day (HV ETFs), so that liquidity and a small bid/ask spread are assured.
2. Trend Tracking Indexes (TTIs)
Buy or Sell decisions for Domestic and International ETFs (section 1 and 2), are made based on the respective TTI and its position either above or below its long-term M/A (Moving Average). A crossing of the trend line from below accompanied by some staying power above constitutes a “Buy” signal. Conversely, a clear break below the line constitutes a “Sell” signal. Additionally, I use an 12% trailing stop loss on all positions in these categories to control downside risk.
3. All other investment arenas do not have a TTI and should be traded based on the position of the individual ETF relative to its own respective trend line (%M/A). That’s why those signals are referred to as a “Selective Buy.” In other words, if an ETF crosses its own trendline to the upside, a “Buy” signal is generated. Here too, I recommend trailing sell stop of 12%, or less, depending on your risk tolerance.
If you are unfamiliar with some of the terminology, please see Glossary of Termsand new subscriber information in section 9.
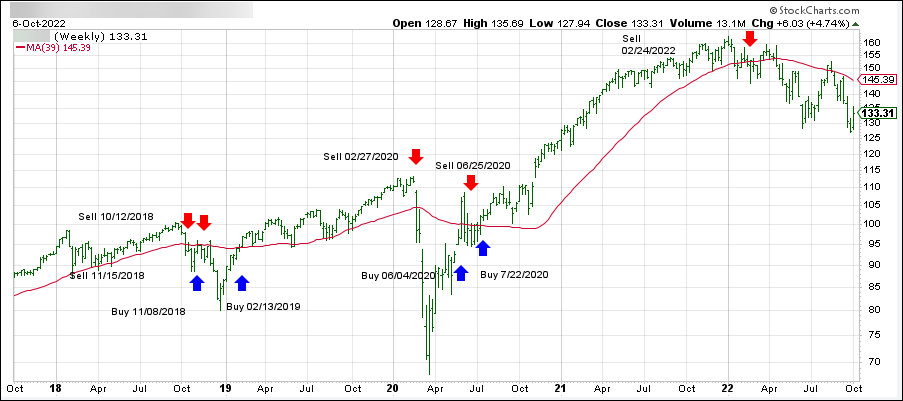
1. DOMESTIC EQUITY ETFs: SELL — since 02/24/2022
Click on chart to enlarge
Our main directional indicator, the Domestic Trend Tracking Index (TTI-green line in the above chart) has broken below its long-term trend line (red) by -8.73% and remains in “SELL” mode.
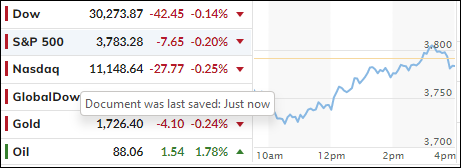
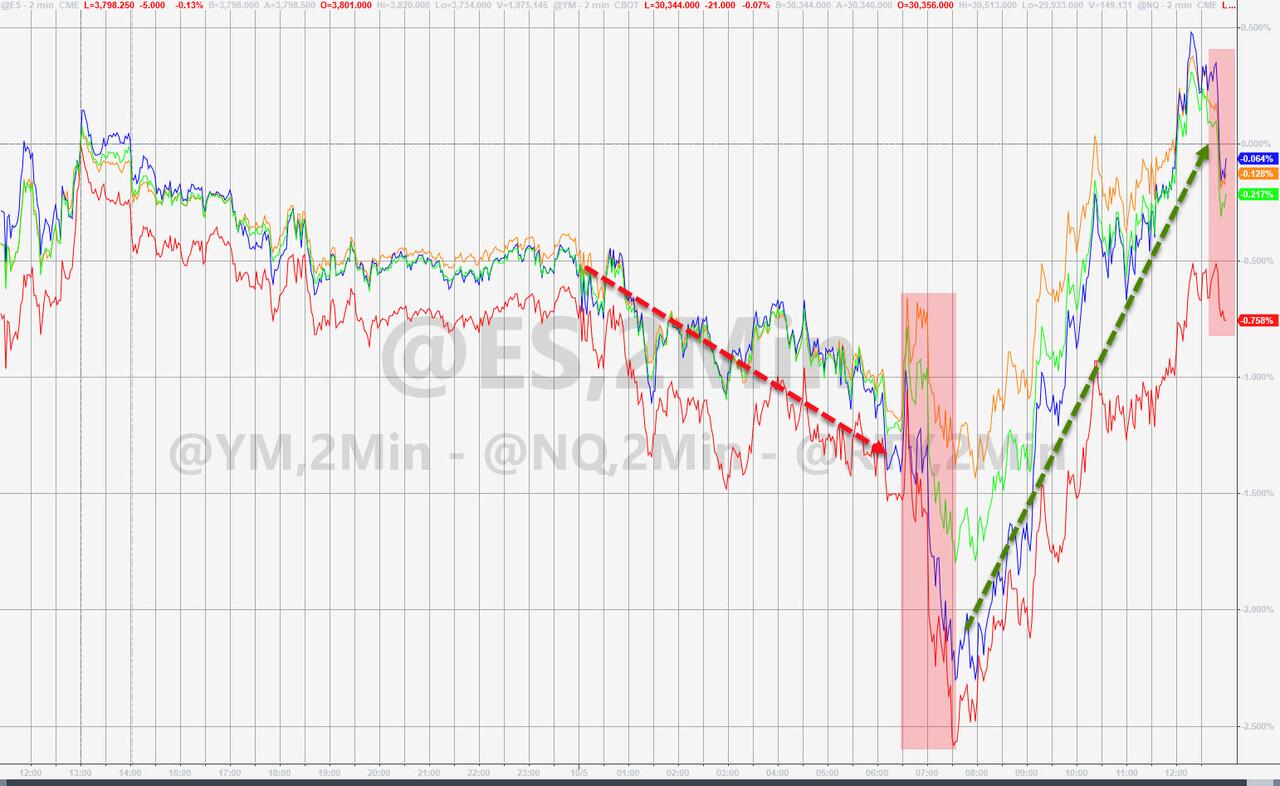
Overnight weakness, followed by an early dump, with the Dow dropping some 400 points, was reversed as bullish sentiment prevailed causing traders and algos to pull the major indexes out of a hole and back to within striking distance of their respective unchanged lines.
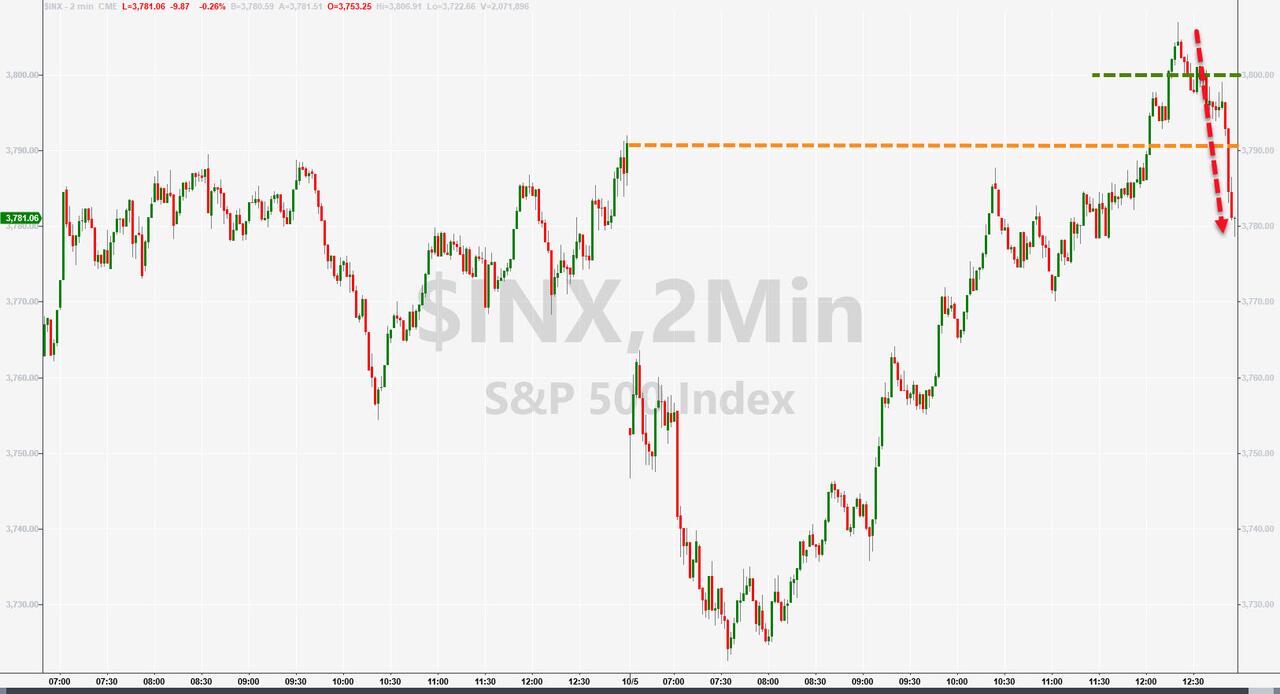
After two days of strong gains, the widely followed S&P 500 closed lower by a moderate amount, as the index gave back -0.19%, which was a nice recovery off the session’s lows. However, the S&P was not able to hang on to its 3,800 level, which it had crossed intra-day.
Today’s action reflected a moment of pause and deliberation as to how durable the current advance might be. After all, this rebound was based on nothing but hope that the Fed will make, or be forced to, a dovish pivot. So far, there have been no indications.
Bloomberg elaborated on the turnaround:
One giant options transaction may have sparked the S&P 500’s bounce on Wednesday, according to Wells Fargo & Co. The trade, which involved buying and selling call options tied to the index at a cost of around $31 million, probably helped fuel a recovery that saw the benchmark gauge erase a 1.8% decline.
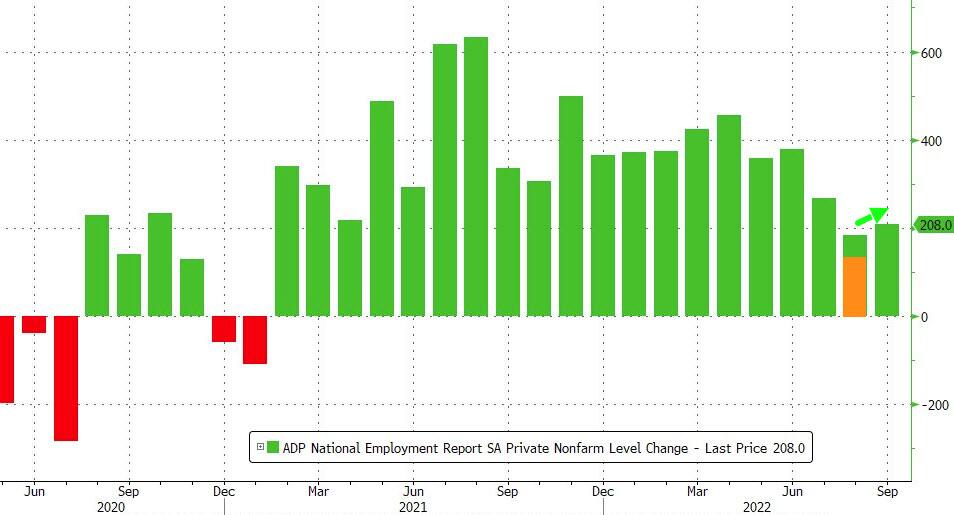
A better-than-expected jump in jobs, as per ADP, showed an increase of 208k jobs vs. an expected 200k, but more important will be Friday’s non-farm payroll report.
Bond yields jumped but did not affect equities negatively, despite the 10-year climbing 12bps to end the session at 3.754%. The US dollar, after a 5-day down streak, showed signs of life again and rebounded almost 1%.
Crude Oil jumped as well, due OPEC now being in the process of reducing daily production. Ouch!
Gold bounced erratically but managed to defend its $1,700 level.
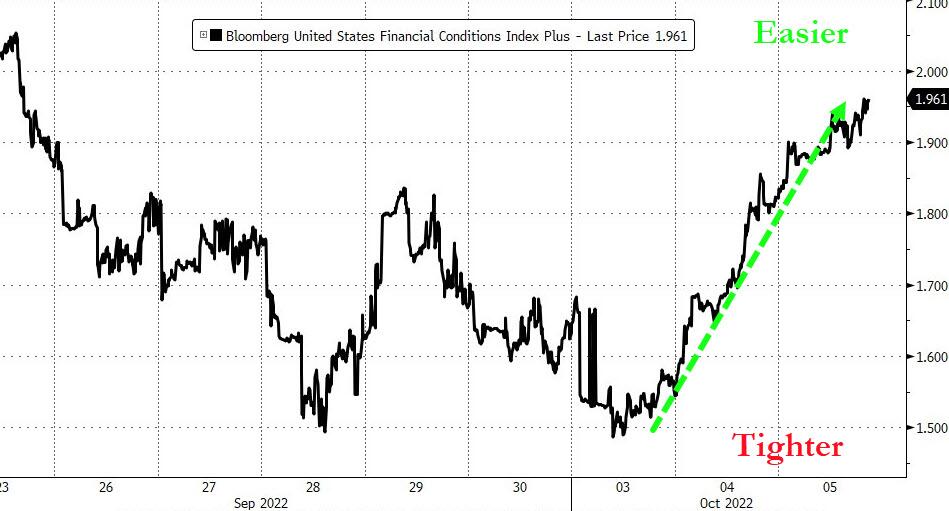
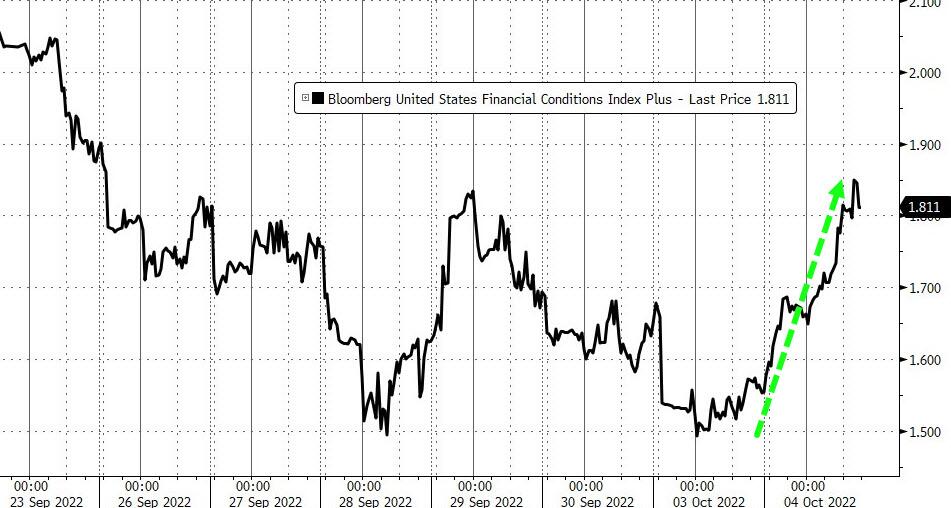
As ZeroHedge noted, financial conditions have eased notably over the last 3 days, which is not what the Fed wants to see. My conclusion is that they are not ready to pivot anytime in the very near future.
For the second day in a row, the markets rebounded sharply based on the idea that the Fed is due to pivot and implement a more dovish stance with its monetary policy. Never mind that all this is merely perception and not reality at all.
But to the frontrunning traders and algos none of that matters and reality is simply ignored, despite John Williams, President of the NY Fed, giving a speech, which included the following nuggets:
Inflation is far too high.
Our job of cooling demand and reducing inflationary pressures is not yet done.
The drop in commodities prices is “not enough” to “bring down” the “broad-based inflation” caused by goods demand as well as labor and services demand.
Hmm, I don’t see a hint of a pivot and neither did other observers, leading Morgan Stanley’s strategist Mike Wilson to issue a host of warnings:
Stocks will continue to fall even after the Fed pivots
They will likely be headed lower for the foreseeable future, as volatility across equities, bonds, commodities, and currencies could remain elevated
As interest rates continue to rise and the Fed keeps shrinking its balance sheet, it could risk provoking a crisis somewhere in the world, or even in the U.S. This is because higher interest rates create a drag on the U.S. economy by making it more expensive for corporations and households to borrow money, while a stronger dollar makes it more difficult for emerging economies to pay back debt denominated in dollars.
For sure, after the beating equities have taken this year, a periodic rebound is to be expected, and we have seen this pattern repeated throughout 2022, yet every time lower lows were subsequently made:
Will this time be different?
Analyst Graham Summers summed the outcome up like this:
The Fed will no doubt pivot at some point… but it’s not doing so now. And the market’s action has made the likelihood of a pivot MUCH lower.
So, enjoy the relief rally… but don’t plan on it lasting for long. Because the Great Crisis… the one to which 2008 was a warm-up, has finally arrived.
On the economic front, we saw the biggest crash in job openings on record (outside of global Covid lockdown), as ZeroHedge posted. Openings tumbled to just about 10 million from a revised July print of 11.1 million. Ouch!
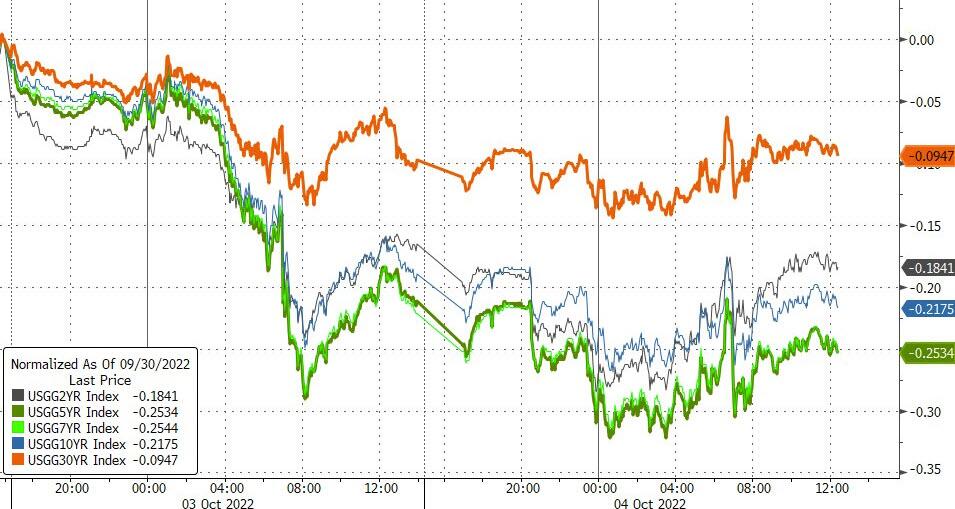
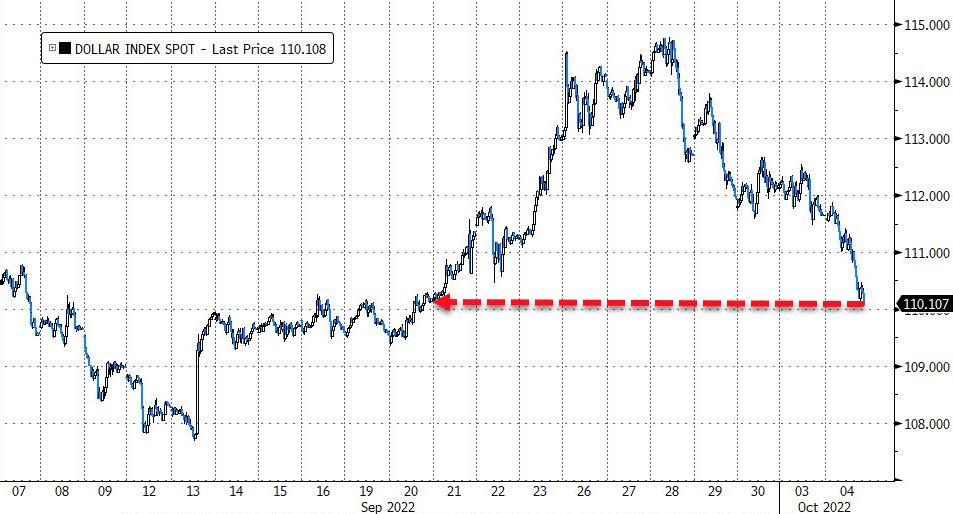
However, if anything, the market’s action over the last two days makes a Fed pivot less likely any time soon. With both Treasury yields and the dollar falling, rate and liquidity pressures are much lower than they were last week… reducing the pressure on Powell to go full ‘Bank of England’… and round and round goes the big reflexive wheel of leverage.
Despite the violent market behavior of the recent past, the analog to 2008-2009 is still on target.
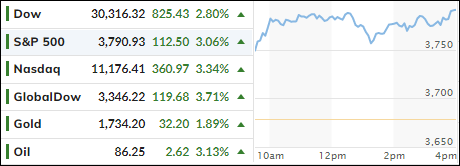
After last month’s thrashing, during which the S&P 500 lost -9.3%, it comes as no surprise that a rebound from a very oversold condition materialized, as the markets welcomed October with a bullish bounce.
Following the recent debacle in the UK, when the BoE reversed its tough talk of hiking rates to fight inflation, by hurriedly starting a new QE program to stem the fall of its bond (gilts) market to bail out potentially failing pension funds, the rest of the world took notice.
It now seems that, despite tough talk to the opposite, the BoE, instead of proceeding with their Quantitative Tightening program (QT), folded like a cheap lawn chair, at the first sign of pain, by reverting to Quantitative Easing (QE)—inflation be damned.
The explanation that the BoE just wanted to maintain an orderly market was quickly rebuffed by analyst Peter Schiff:
Well, you can’t fight inflation and maintain an orderly market because the markets have been propped up by inflation. So, if you’re going to fight inflation, you’d better be prepared for a disorderly market. And until yesterday, the Bank of England was bluffing that they were. But now that their bluff has been called, they had to show their cards, and they’re holding nothing. And so, inflation won.
Peter added that, when the day of reckoning comes, he expects Fed head Powell to make the same decision:
I don’t care how much he wants to bark about being tough on inflation. At the end of the day, he will not bite. The Fed is a paper tiger, and it will fold just as quickly as the Bank of England when they’re confronted with an actual crisis.
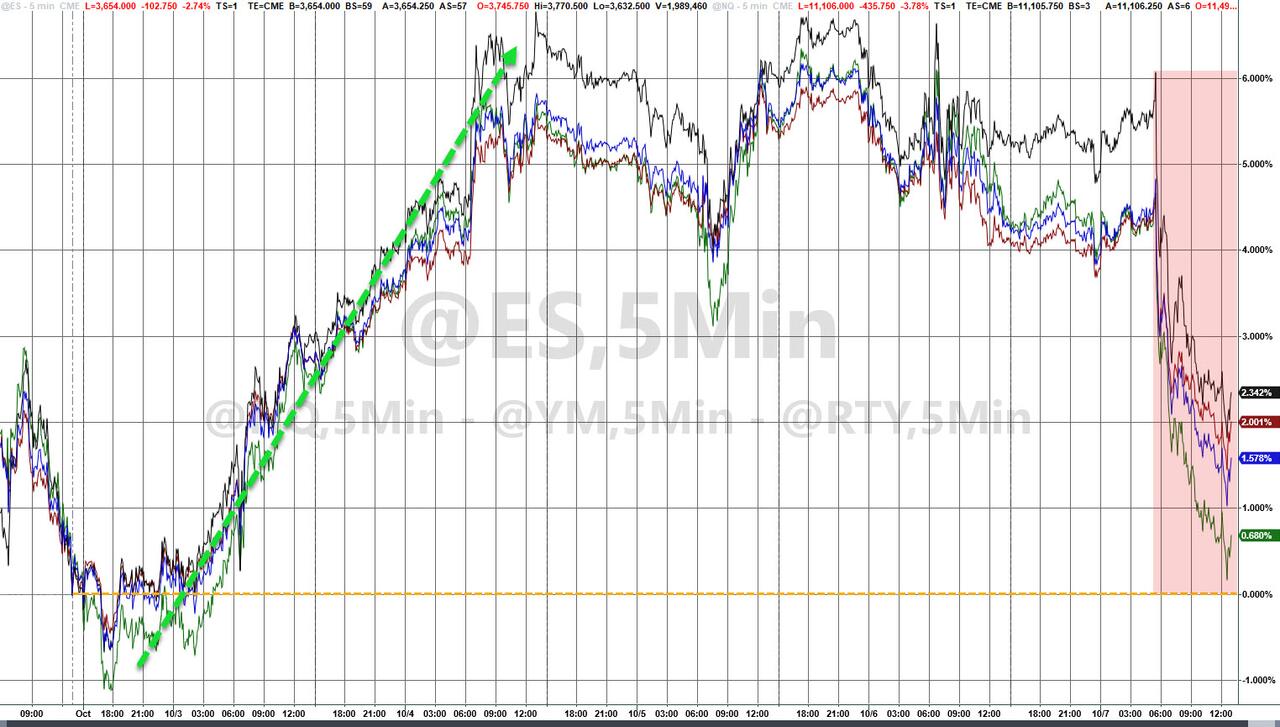
And that’s what traders and algos were seeing as well, hence the sharp rally into October. Of course, at this time, it’s all guesswork and hope that Powell will follow suit, but what if he doesn’t?
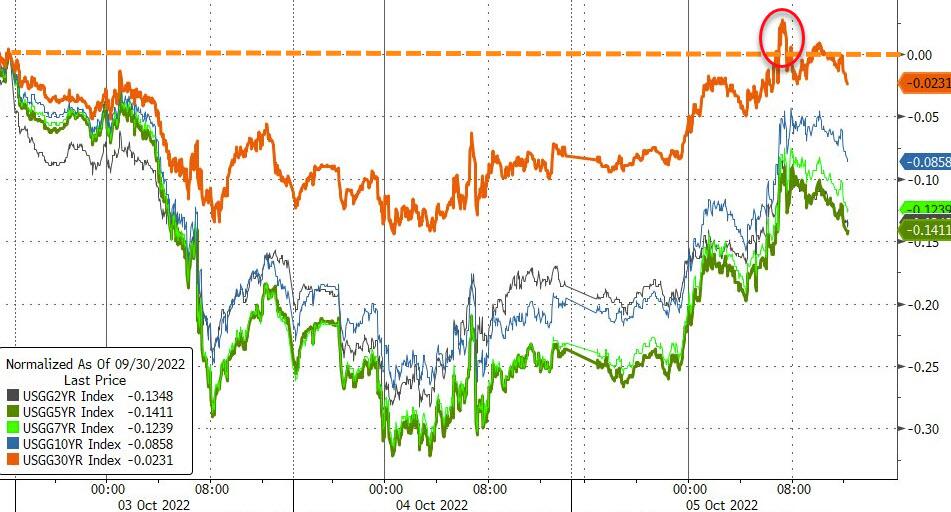
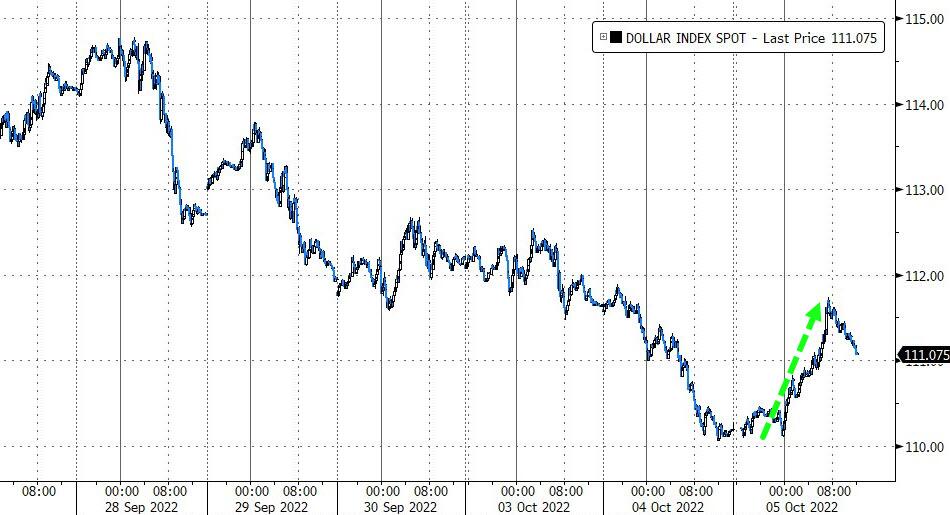
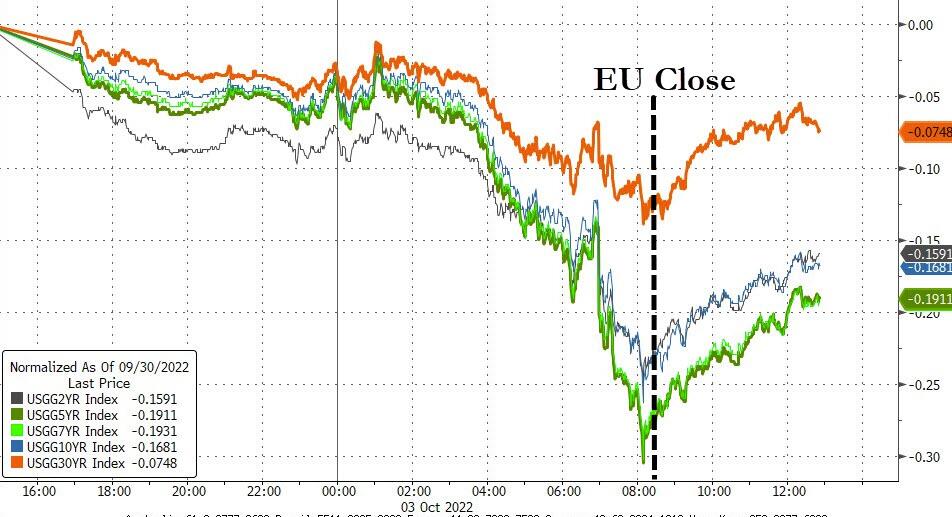
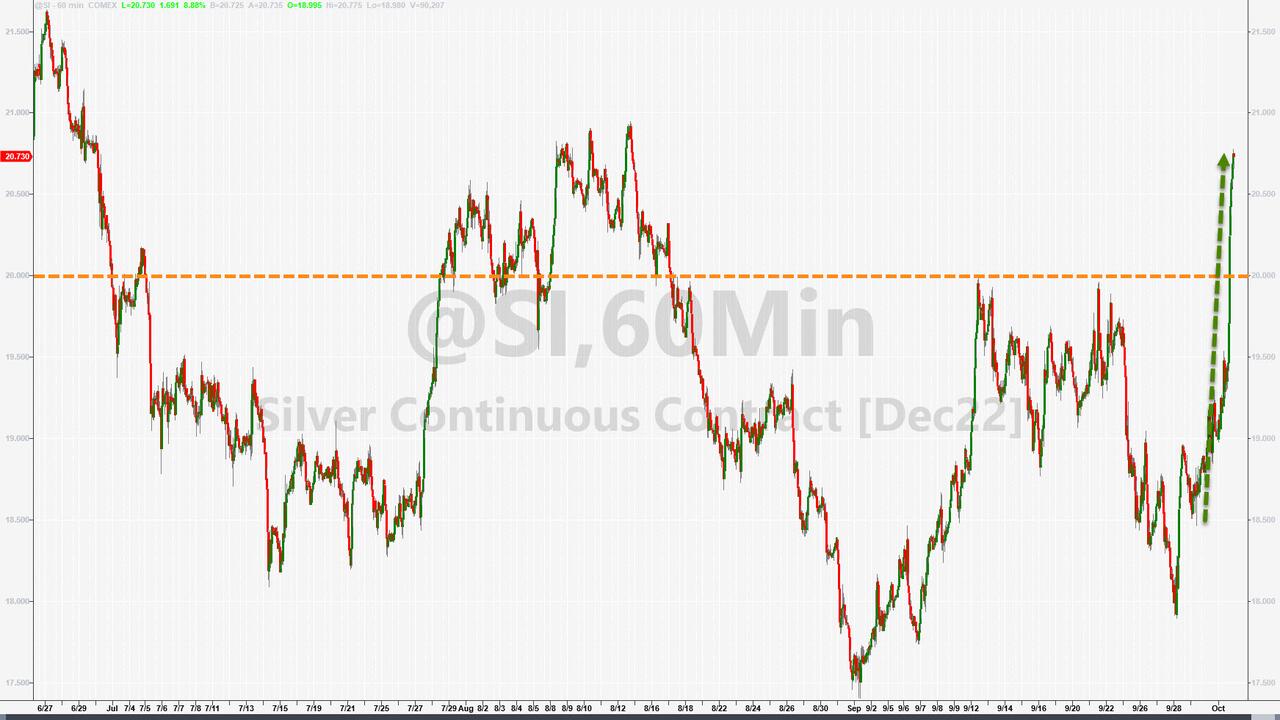
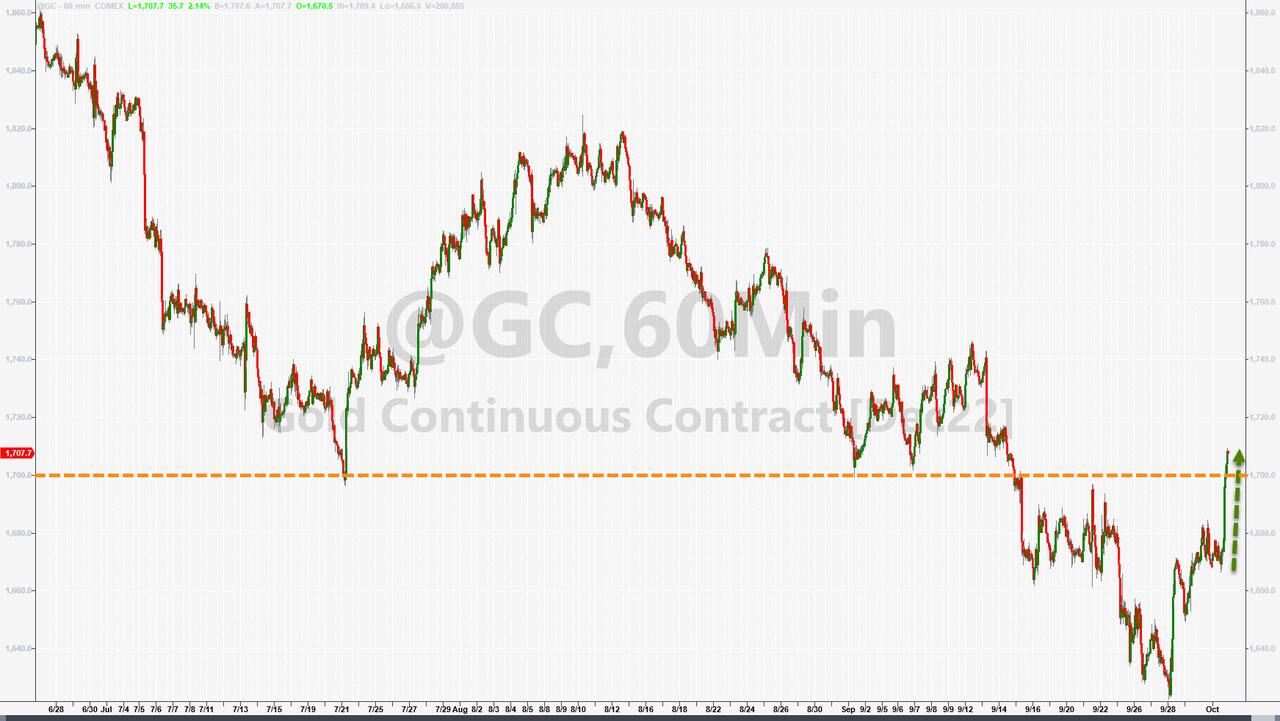
Nevertheless, we saw stocks, bonds, crude oil, and precious metals surging, as the US Dollar and bond yields hit the skids. Silver soared about 9% today, while gold had great showing by gaining over 2% and reclaiming its $1,700 level again.
Will Powell pivot? As per ZeroHedge, FedSpeak by some his Fed Gov’s don’t seem to confirm that:
Tighter monetary policy has begun to cool demand and reduce inflationary pressures, but our job is not yet done.
What if we are in a new era — one in which we face inflationary headwinds?
History may be less of a precedent for appropriate policy.
As a result, our efforts to stabilize inflation expectations could require periods where we tighten monetary policy more than has been our recent pattern.
You might think of this as leaning against the wind.

