Below, please find the latest High-Volume ETF Cutline report, which shows how far above or below their respective long-term trend lines (39-week SMA) my currently tracked ETFs are positioned.
This report covers the HV ETF Master List from Thursday’s StatSheet and includes 312 High Volume ETFs, defined as those with an average daily volume of more than $5 million, of which currently 21 (last week 22) are hovering in bullish territory. The yellow line separates those ETFs that are positioned above their trend line (%M/A) from those that have dropped below it.
In case you are not familiar with some of the terminology used in the reports, please read the Glossary of Terms. If you missed the original post about the Cutline approach, you can read it here.
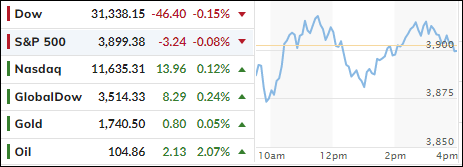
The markets finally managed to eke out a winning week after the relentless losses during the month of June, despite a “good news could be bad news scenario” waiting in the wings.
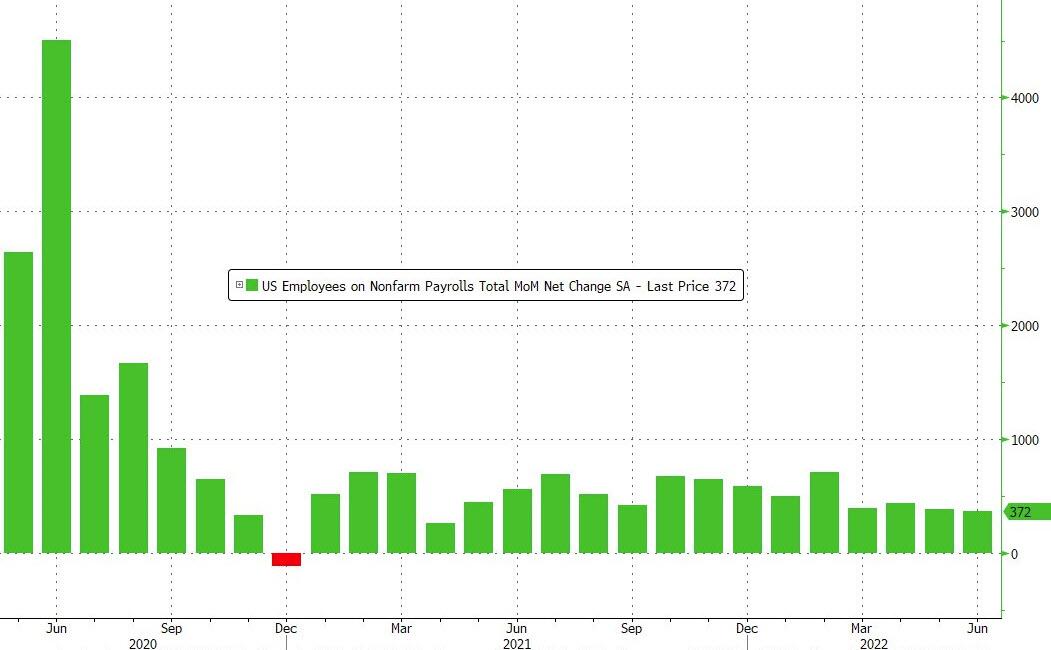
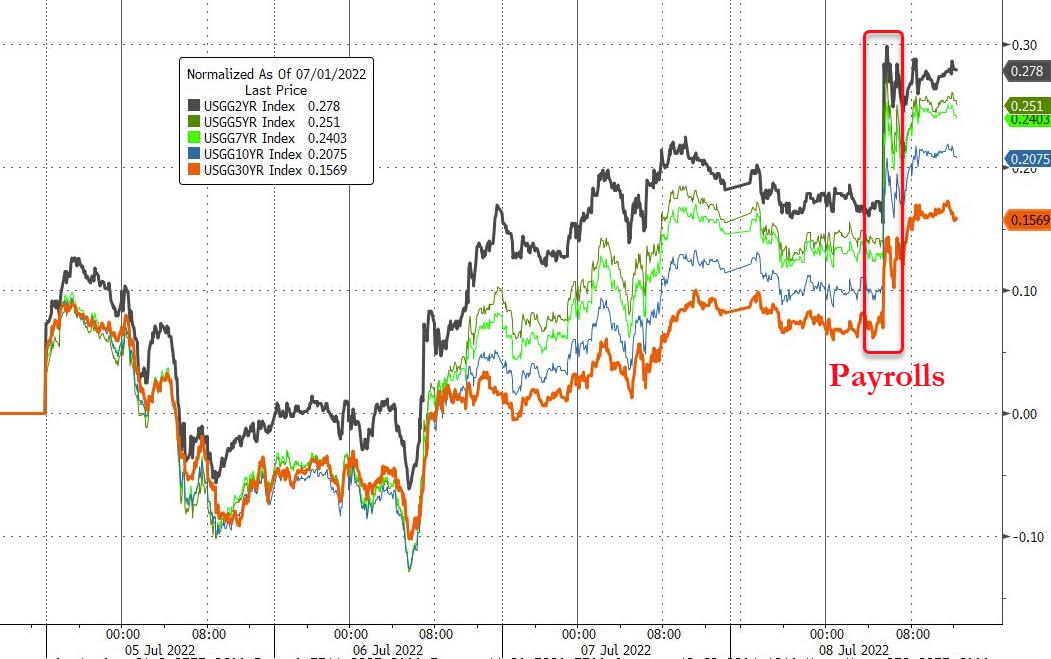
All eyes were on the nonfarm payrolls which, on the surface, came in better than expected. For the month of June, we saw an increase of +372k jobs from the Establishment survey, which was better than the 250k Dow Jones estimate.
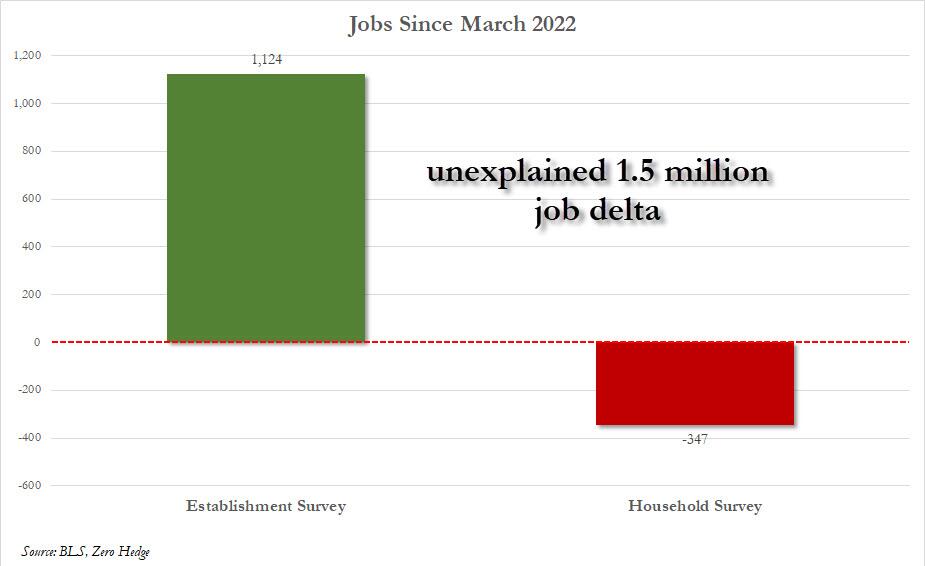
Looking under the hood, however, ZeroHedge pointed to an unexplainable discrepancy, namely that the Household survey showed just the opposite via a loss of -315k jobs. That seemed odd, since both numbers run pretty much in sync, as this chart shows.
In fact, since March, the Establishment Survey shows a gain of +1.124 million jobs while the Household Survey shows an employment loss of -347K!
Hmm…
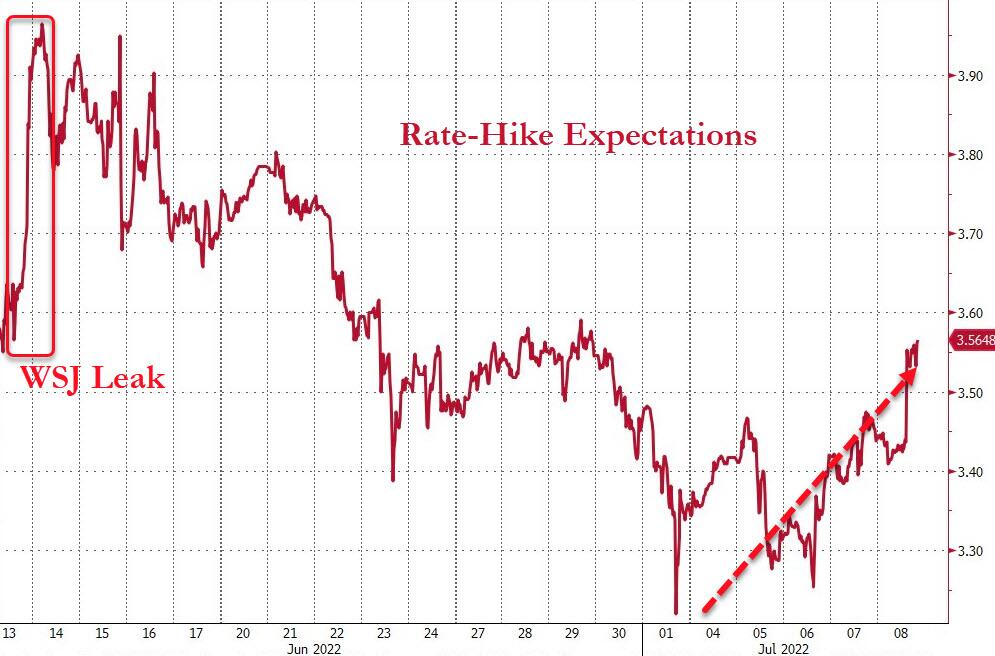
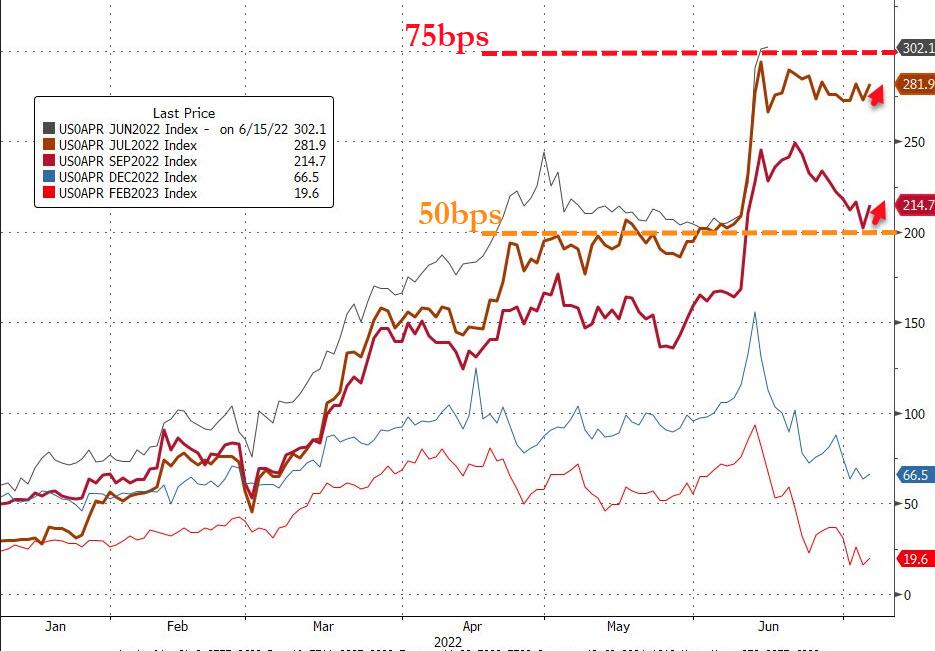
On one side, you could not have asked for a better number in terms of the state of the economy, but on the other, the market now must come to terms with the Fed hiking by 75bps later this month and may not reverse its inflation fighting stance as quickly as had been anticipated.
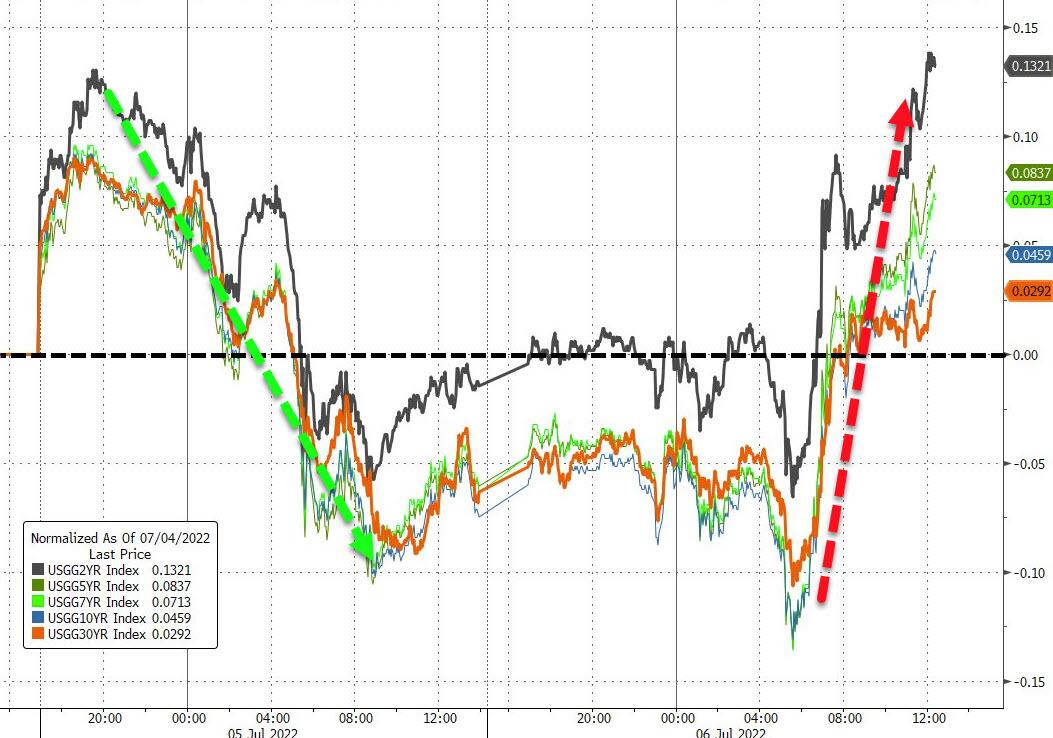
Rate hike expectations reversed and jumped higher during this week. It was a period of bobbing and weaving, which ZH summed up like this:
Commodities crushed – recession anxiety, demand weaker? (but China reopening and stimulus)
Stocks strong – recession anxiety, end of Fed easing closer (Growth >> Value)
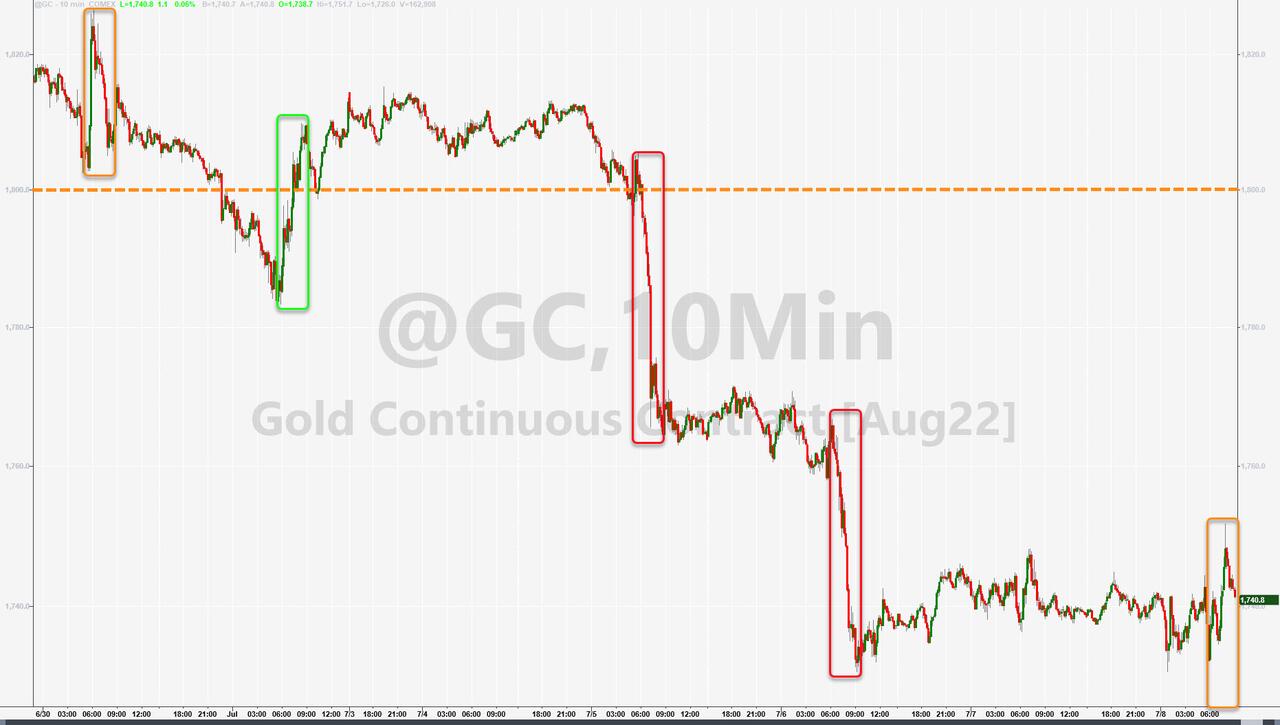
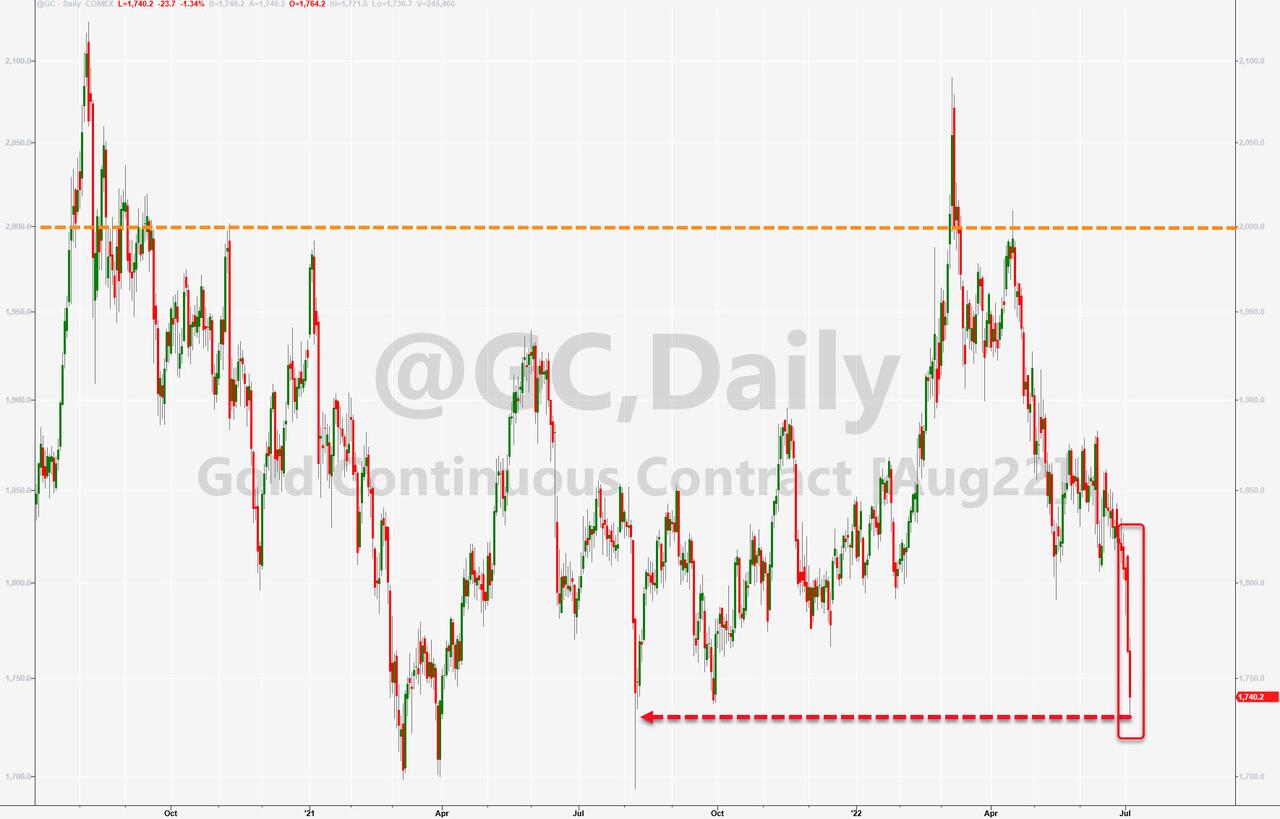
Gold down hard – strong enough economy, inflation-fighting Fed hawkish
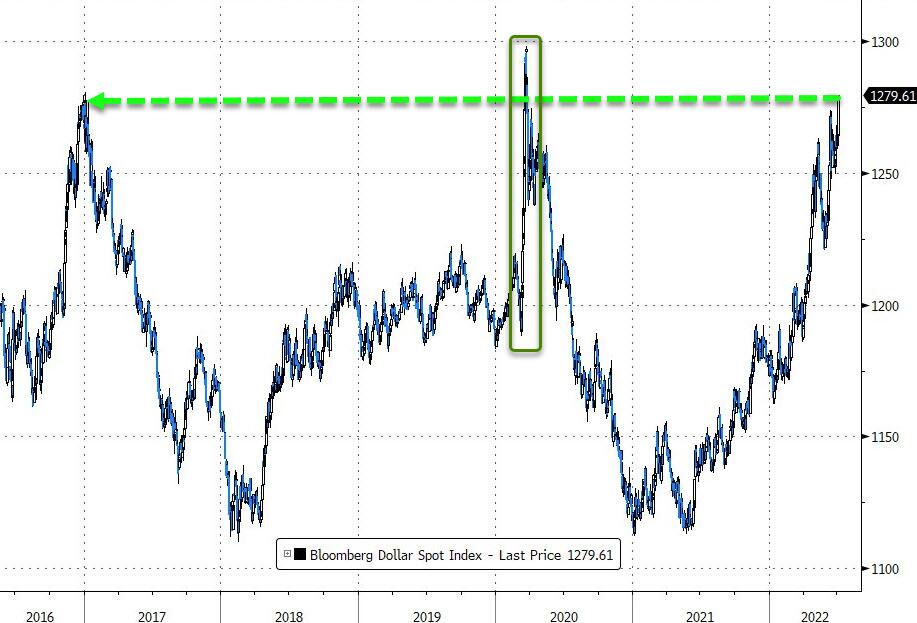
Dollar up strong – strong enough economy relative to Europe (Fed ‘hawkisher’ than ECB)
Payrolls headline strong BUT household survey ugly – so is the economy ‘strong enough’ or a shitshow?
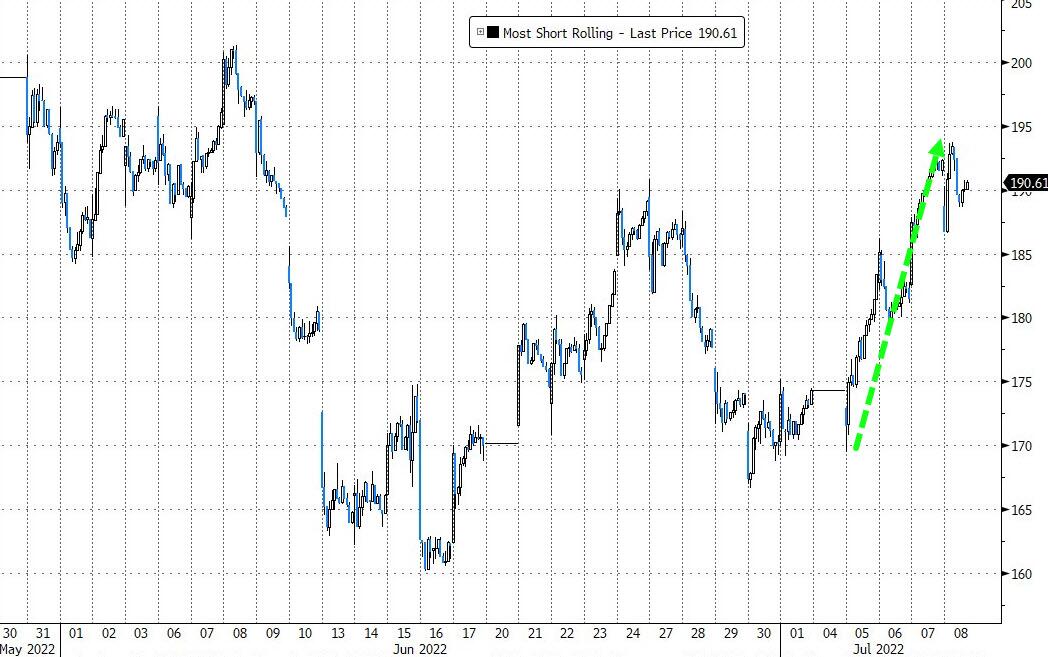
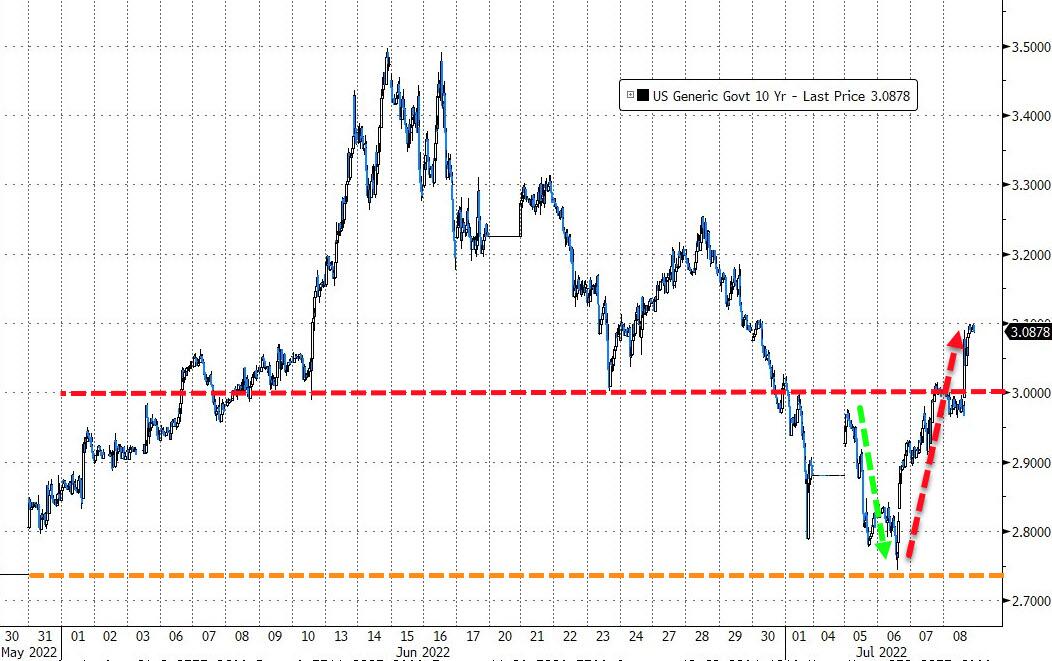
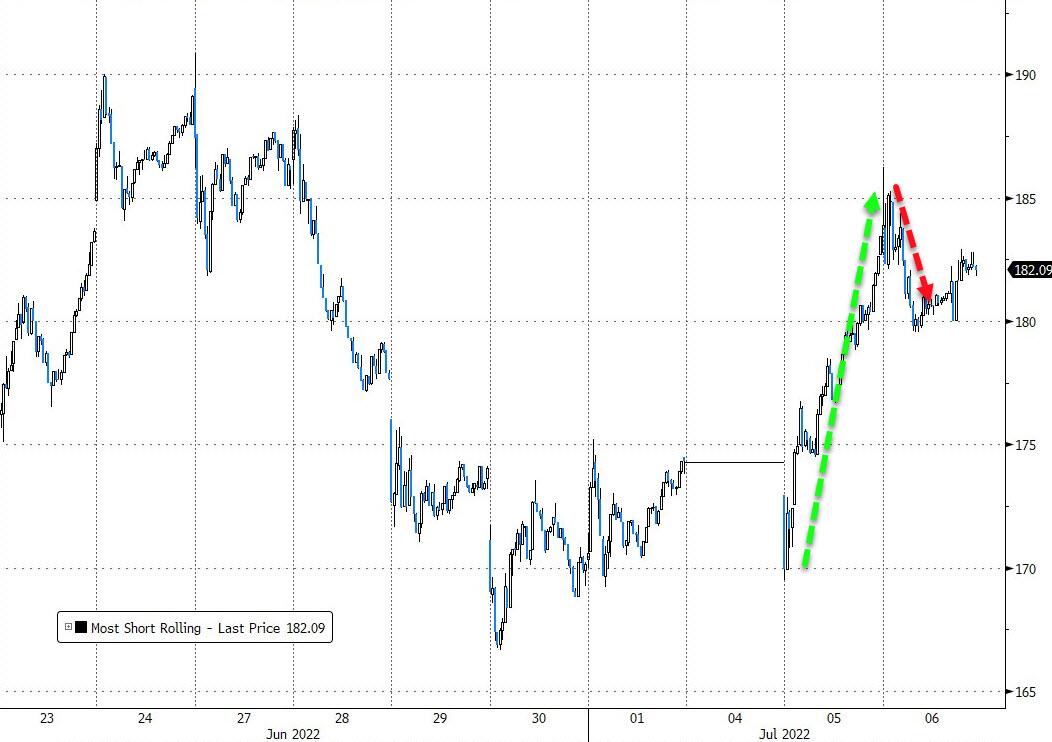
The short squeeze of the past few days ran out of steam, as bond yields headed higher with the 10-year reclaiming its 3% level and closing at 3.08%.
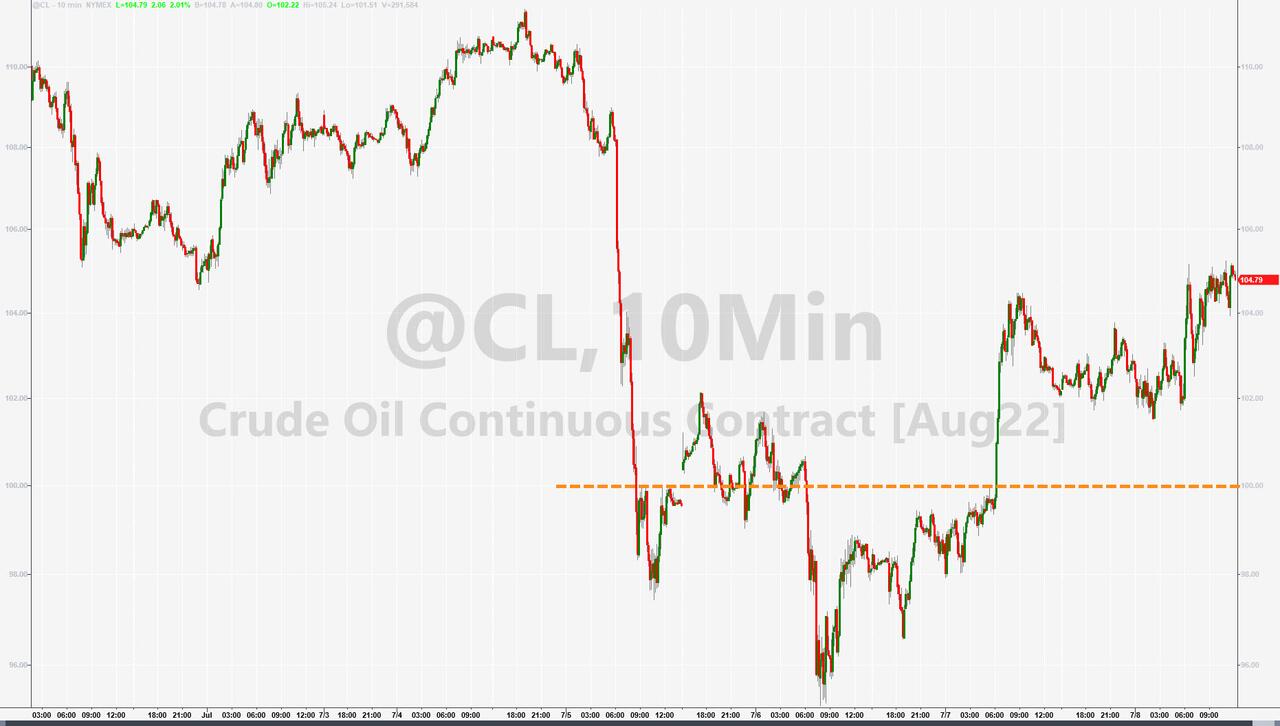
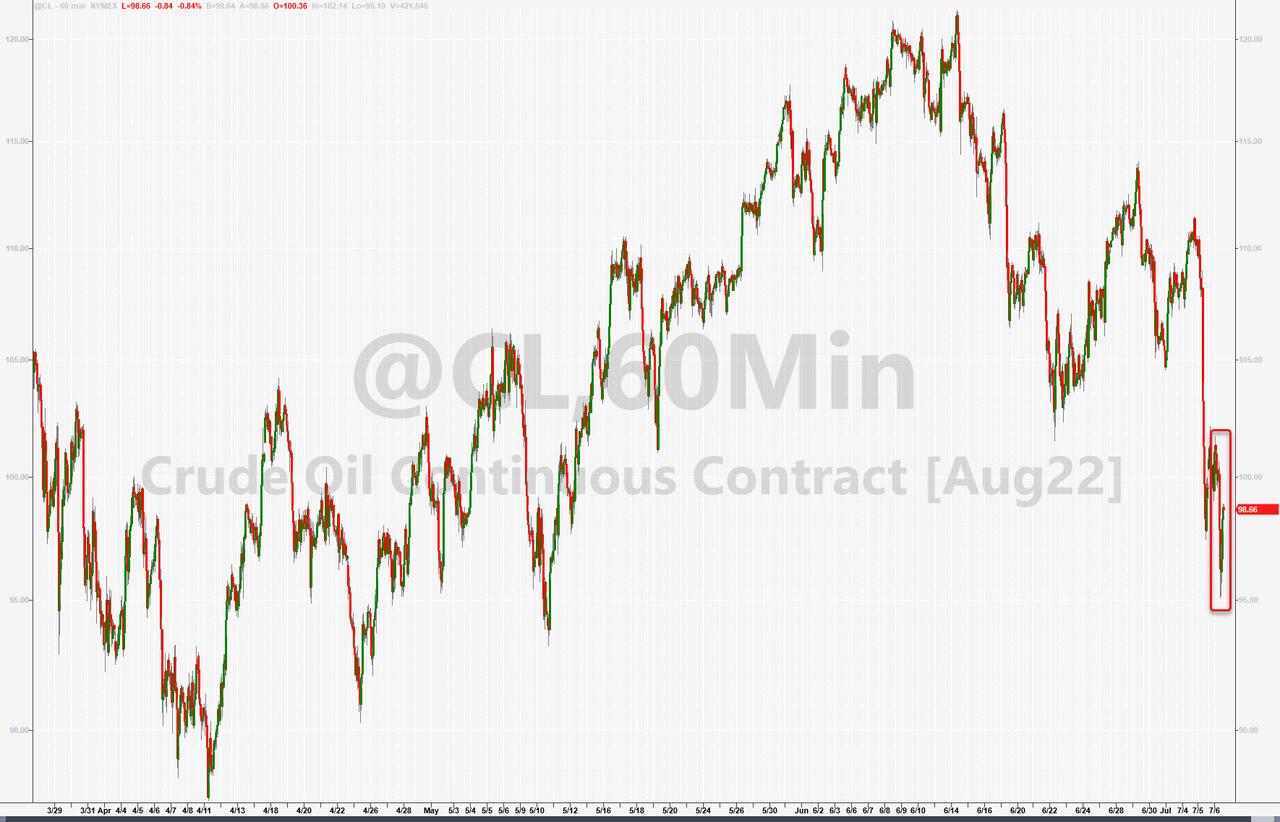
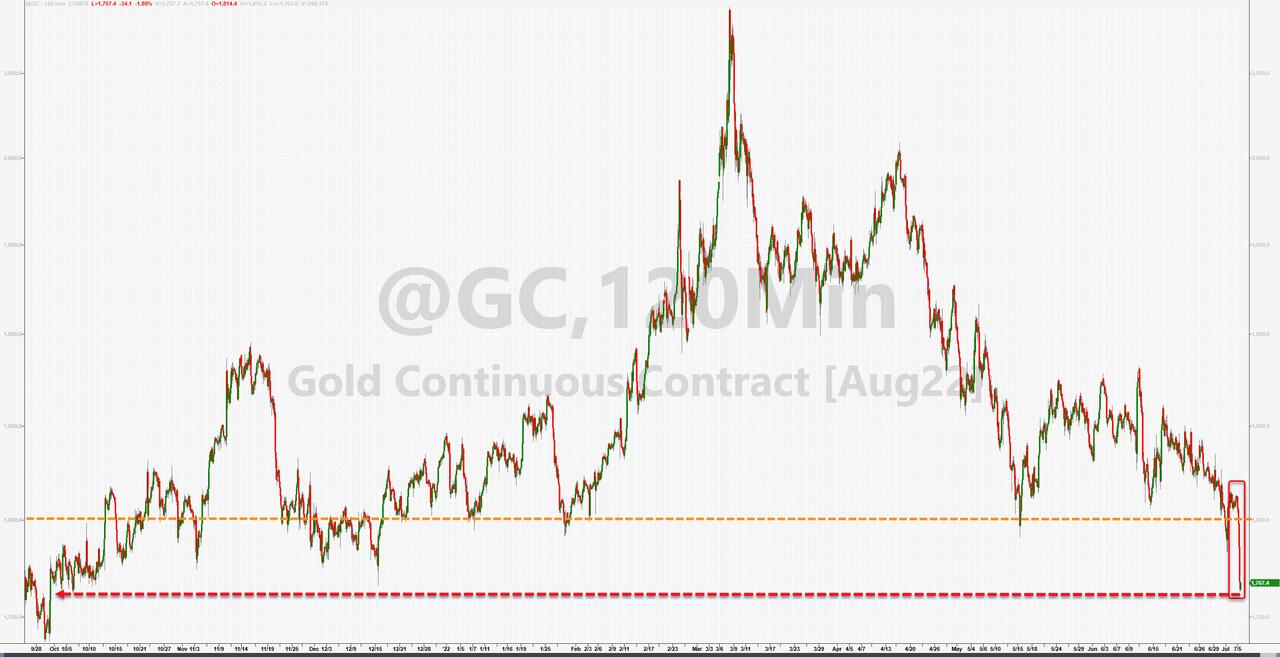
Commodities slipped and Gold followed suit but managed to show a green number today, while Crude Oil showed a similar weekly pattern to the precious metal.
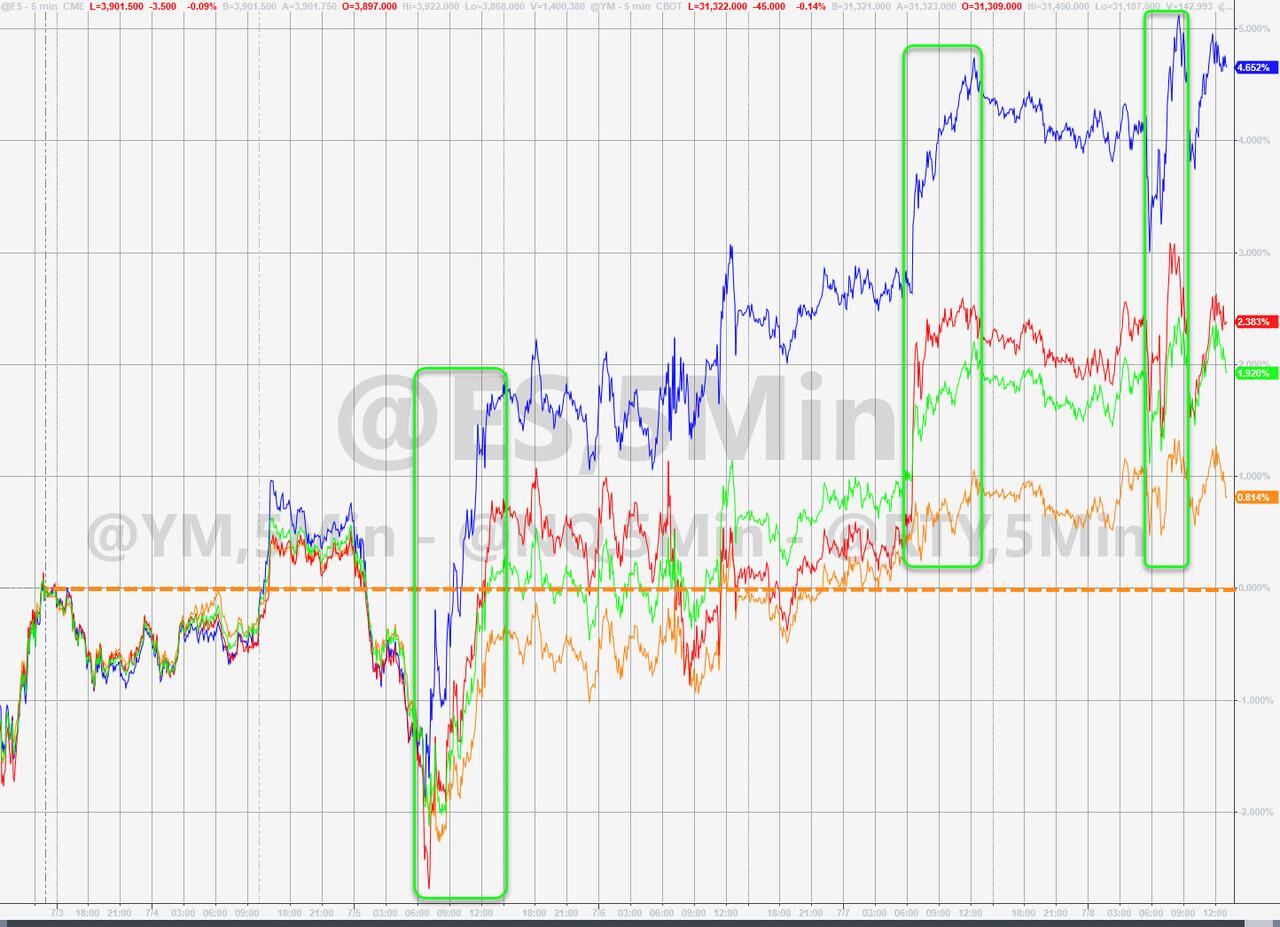
For the record, this two-week period staring July 1st is the most bullish one of the year, as ZH elaborated.
1. From the universe of over 1,800 ETFs, I have selected only those with a trading volume of over $5 million per day (HV ETFs), so that liquidity and a small bid/ask spread are assured.
2. Trend Tracking Indexes (TTIs)
Buy or Sell decisions for Domestic and International ETFs (section 1 and 2), are made based on the respective TTI and its position either above or below its long-term M/A (Moving Average). A crossing of the trend line from below accompanied by some staying power above constitutes a “Buy” signal. Conversely, a clear break below the line constitutes a “Sell” signal. Additionally, I use an 12% trailing stop loss on all positions in these categories to control downside risk.
3. All other investment arenas do not have a TTI and should be traded based on the position of the individual ETF relative to its own respective trend line (%M/A). That’s why those signals are referred to as a “Selective Buy.” In other words, if an ETF crosses its own trendline to the upside, a “Buy” signal is generated. Here too, I recommend trailing sell stop of 12%, or less, depending on your risk tolerance.
If you are unfamiliar with some of the terminology, please see Glossary of Termsand new subscriber information in section 9.
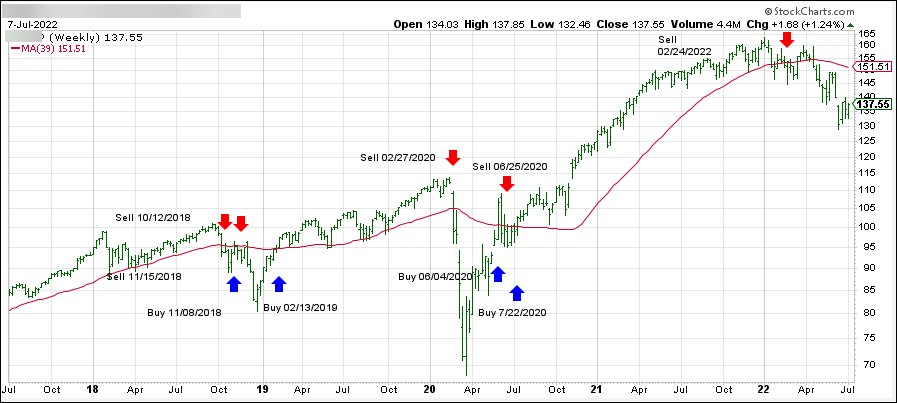
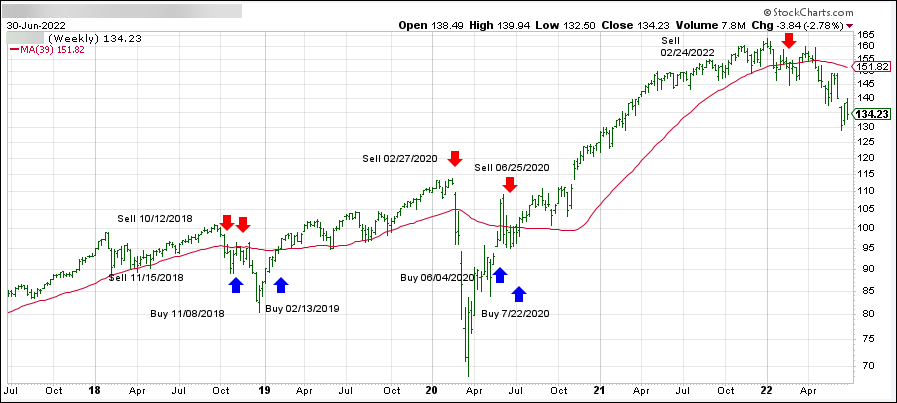
1. DOMESTIC EQUITY ETFs: SELL — since 02/24/2022
Click on chart to enlarge
Our main directional indicator, the Domestic Trend Tracking Index (TTI-green line in the above chart) has broken below its long-term trend line (red) by -9.42% and remains in “SELL” mode.
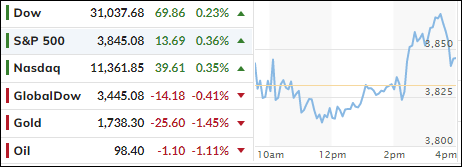
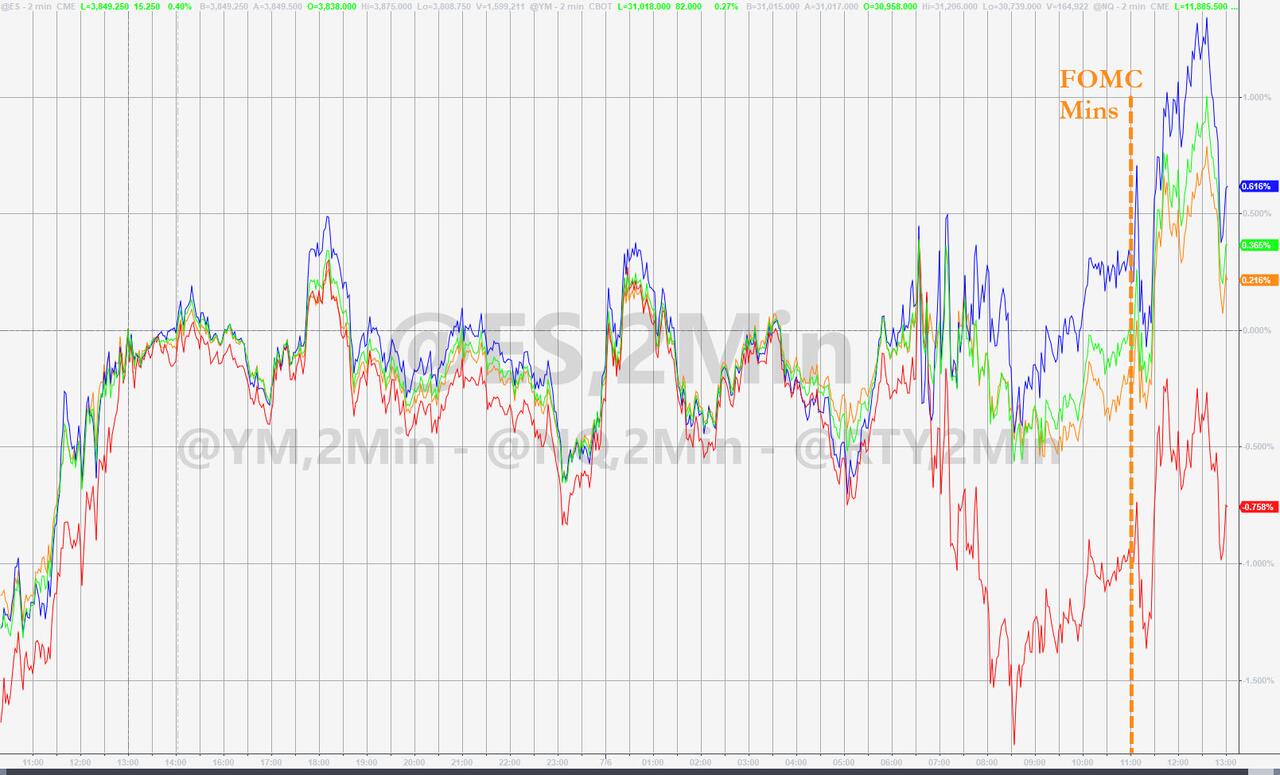
Another wild session had the markets bobbing and weaving, yet the major indexes managed to eke out a small gain. All eyes had been on the release of the Fed’s FOMC minutes from June, which indicated that they had not wavered from their commitment to bring inflation down. The unanswered question was whether we will see a 50bps or 75bps hike in rates later this month.
Traders continued to ascertain whether the Fed would return to its easy money policy not because they had success reducing inflation (they did not) but more so due to weakening economic conditions. So far, there has been no clear answer.
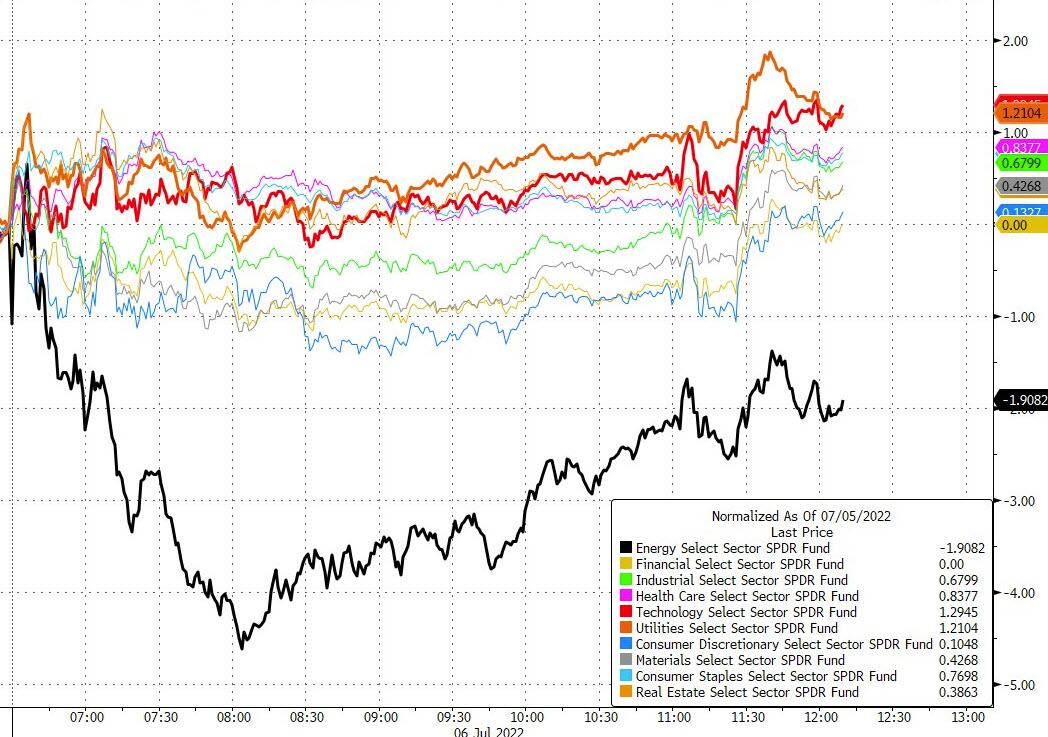
Despite energy rebounding late in the session, it still turned out to be the worst performer of all sectors, with crude oil taking another hit and remaining below the $100 level. It was a “going nowhere” kind of session, as yesterday’s short squeeze died on the vine.
Despite bond yields storming back with a vengeance, as the 10-year rose almost 13 bps to close at 2.93%, stocks were not negatively affected—yet.
The US Dollar continued to edge higher and built on yesterday’s gains, while Gold trended lower to end the day at $1,737.
The question in my mind is this one: Can the upcoming earnings season provide enough impetus via positive numbers and improved outlooks to battle the fact that we are sliding into a recession?
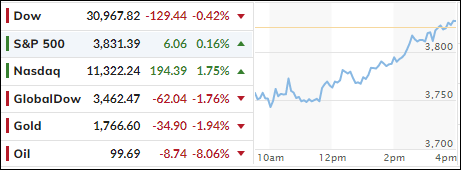
The unpredictable and wild market swings continued today, when the major indexes crashed at the opening with the Dow dumping some 700 points.
As we’ve seen numerous times in the past, a slow and steady climb ensued pulling stocks out of a deep hole, which helped the S&P end a tad in the green, thereby erasing an early 2% loss, while the Dow headed into a much-improved red close. The Nasdaq fared the best and posted a 1.75% gain.
The markets have now dropped four of the past five weeks and remain stuck on the bearish side of their respective trend lines. Economic growth concerns in the face of worsening inflation have added confusion and uncertainty to the markets, as the latest FedNow indicator, which showed 2 consecutive quarters of negative growth, has confirmed a recession.
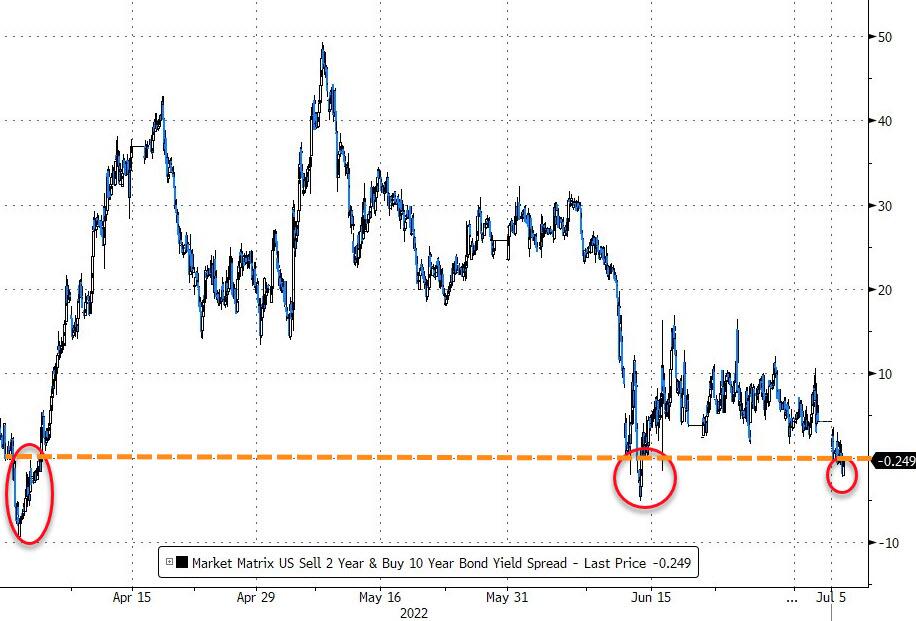
Adding insult to injury was the fact that 10-year bond yield and the 2-year yield inverted today, a move that has historically confirmed a recession in the making. It simply means that when short-term yields trade above long-term ones, it’s a sign that investors anticipate a slowdown, which is usually accompanied by rate cuts.
That puts the Fed between a rock and a hard place, since hiking rates to battle inflationary forces will not bode well within a slowing economy.
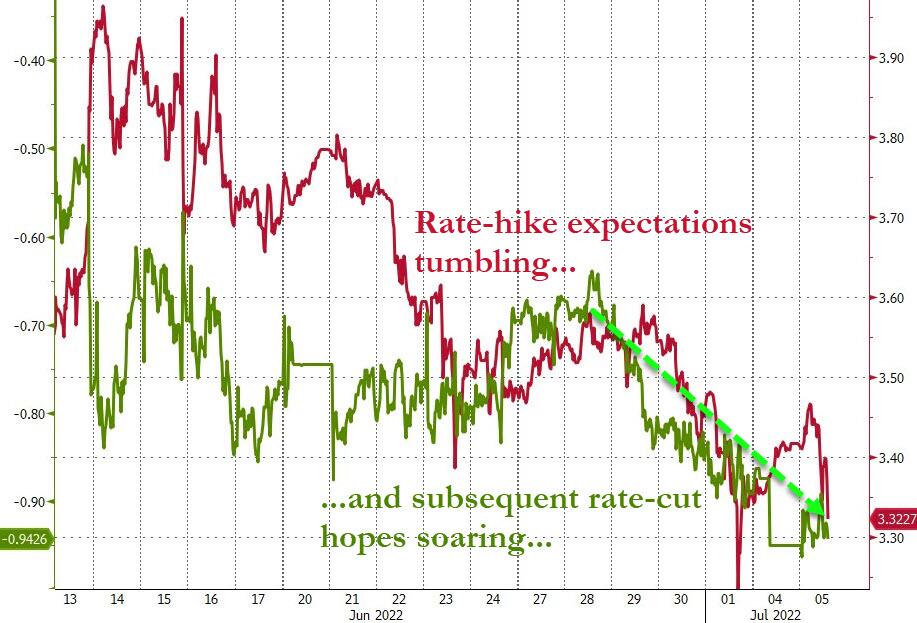
Given this anticipated slowdown, and the accompanying reduction in demand, it came as no surprise that Crude Oil dumped 8% to close below $100 and rate-hike expectations tumbled, as ZH pointed out.
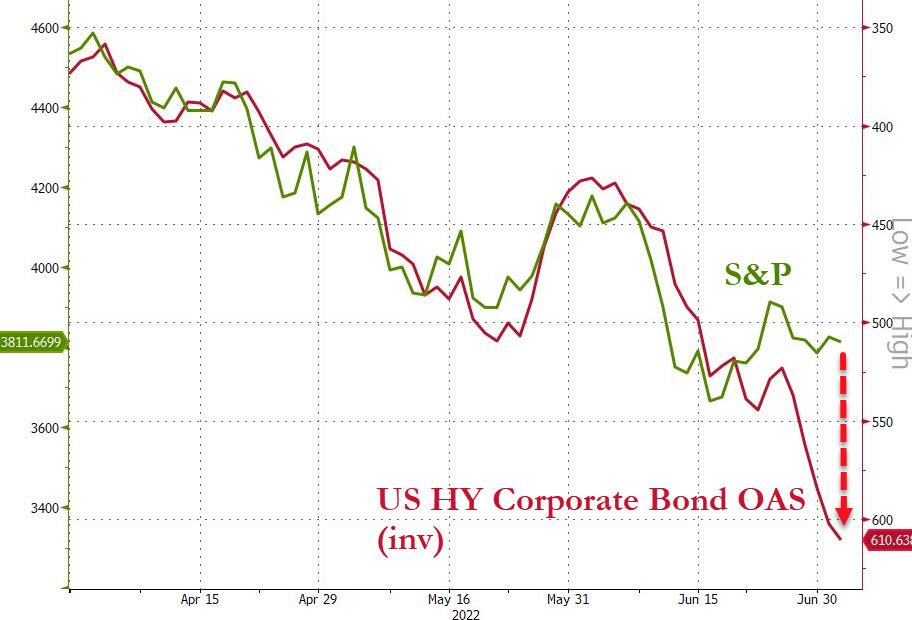
The US Dollar rallied causing Gold to take a hit with the precious metal losing its $1,800 level. Interestingly, junk bonds did not seem to agree with today’s rally, as Bloomberg shows in this chart. Since they tend to be a leading indicator, we may see more downside in equities coming our way.
1. From the universe of over 1,800 ETFs, I have selected only those with a trading volume of over $5 million per day (HV ETFs), so that liquidity and a small bid/ask spread are assured.
2. Trend Tracking Indexes (TTIs)
Buy or Sell decisions for Domestic and International ETFs (section 1 and 2), are made based on the respective TTI and its position either above or below its long-term M/A (Moving Average). A crossing of the trend line from below accompanied by some staying power above constitutes a “Buy” signal. Conversely, a clear break below the line constitutes a “Sell” signal. Additionally, I use an 12% trailing stop loss on all positions in these categories to control downside risk.
3. All other investment arenas do not have a TTI and should be traded based on the position of the individual ETF relative to its own respective trend line (%M/A). That’s why those signals are referred to as a “Selective Buy.” In other words, if an ETF crosses its own trendline to the upside, a “Buy” signal is generated. Here too, I recommend trailing sell stop of 12%, or less, depending on your risk tolerance.
If you are unfamiliar with some of the terminology, please see Glossary of Termsand new subscriber information in section 9.
1. DOMESTIC EQUITY ETFs: SELL — since 02/24/2022
Click on chart to enlarge
Our main directional indicator, the Domestic Trend Tracking Index (TTI-green line in the above chart) has broken below its long-term trend line (red) by -11.82% and remains in “SELL” mode.

