
ETF Tracker StatSheet
You can view the latest version here.
WILL GOOD NEWS BE BAD NEWS AGAIN?
- Moving the markets
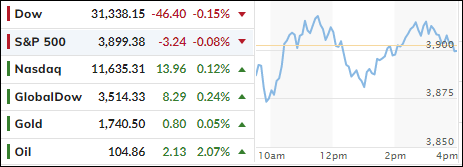
The markets finally managed to eke out a winning week after the relentless losses during the month of June, despite a “good news could be bad news scenario” waiting in the wings.
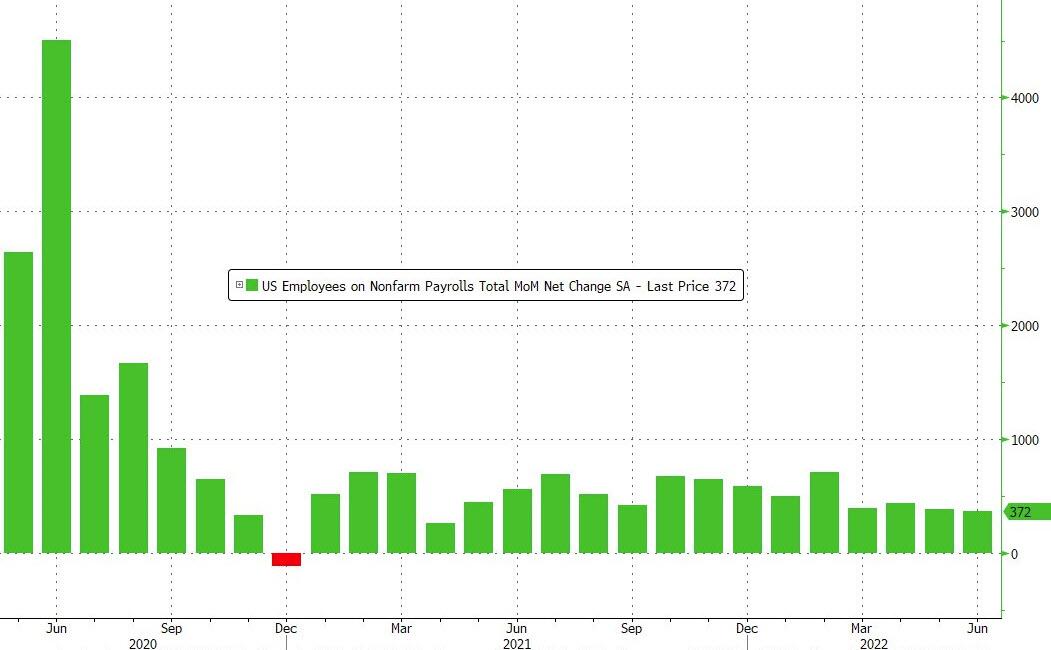
All eyes were on the nonfarm payrolls which, on the surface, came in better than expected. For the month of June, we saw an increase of +372k jobs from the Establishment survey, which was better than the 250k Dow Jones estimate.
Looking under the hood, however, ZeroHedge pointed to an unexplainable discrepancy, namely that the Household survey showed just the opposite via a loss of -315k jobs. That seemed odd, since both numbers run pretty much in sync, as this chart shows.
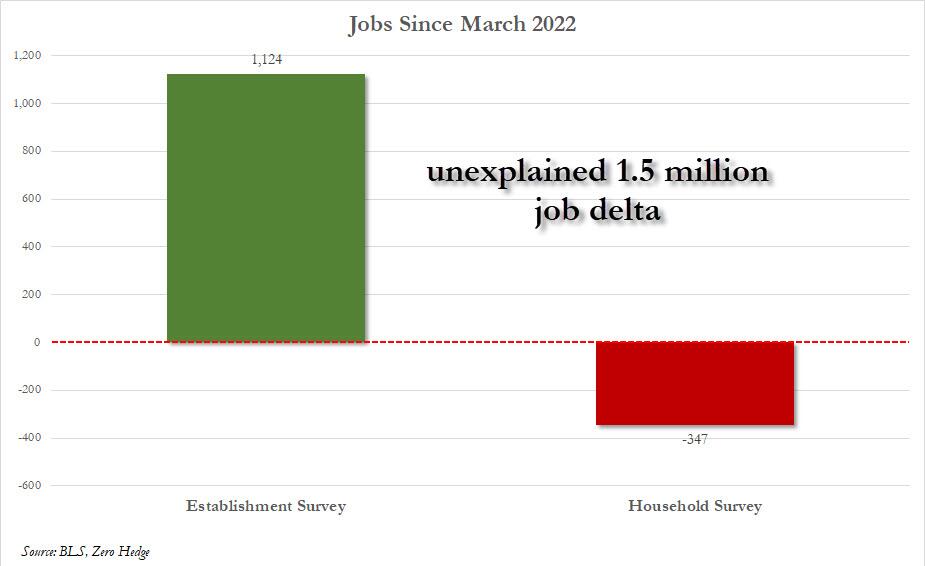
In fact, since March, the Establishment Survey shows a gain of +1.124 million jobs while the Household Survey shows an employment loss of -347K!
Hmm…
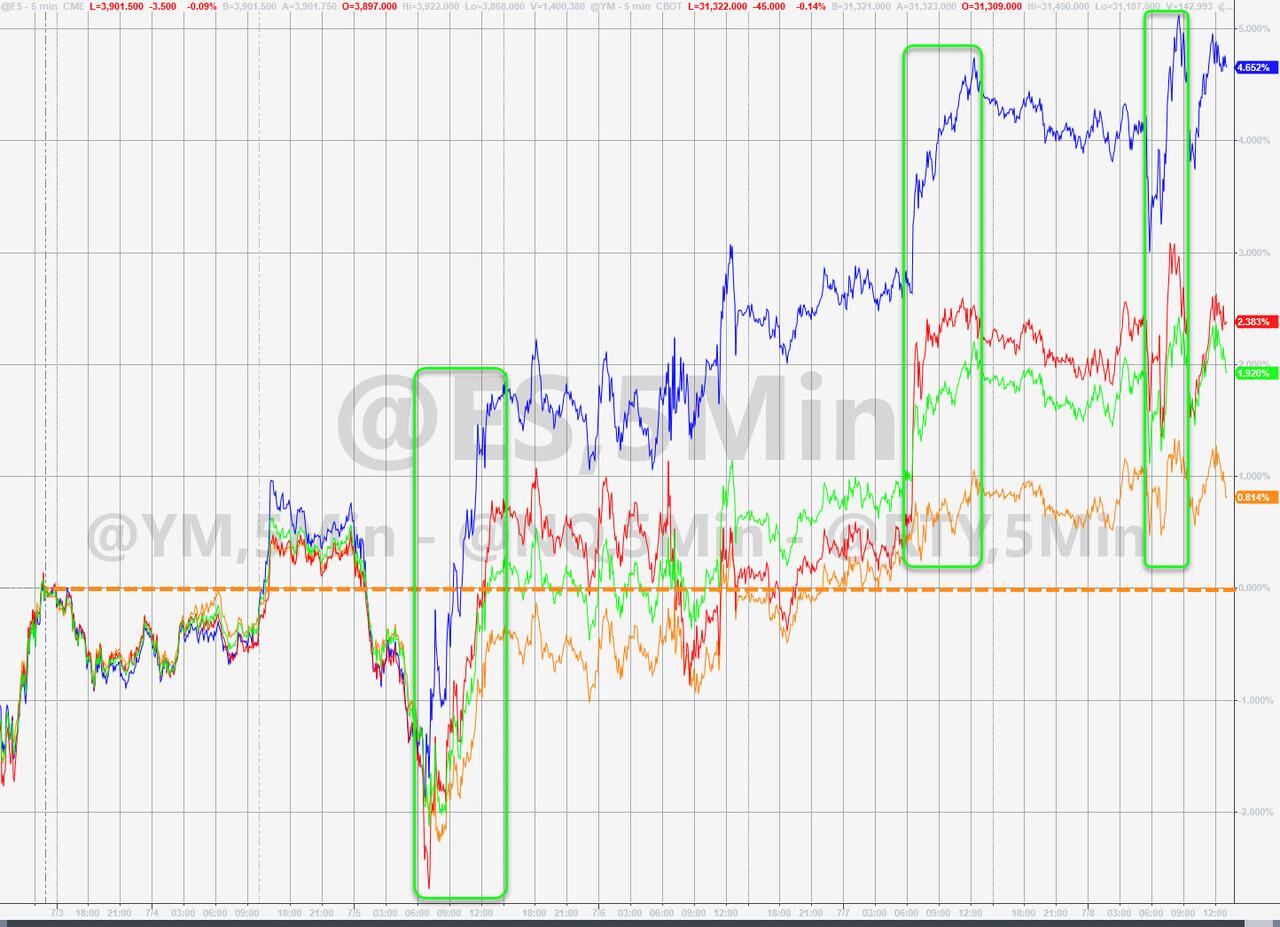
On one side, you could not have asked for a better number in terms of the state of the economy, but on the other, the market now must come to terms with the Fed hiking by 75bps later this month and may not reverse its inflation fighting stance as quickly as had been anticipated.
Rate hike expectations reversed and jumped higher during this week. It was a period of bobbing and weaving, which ZH summed up like this:
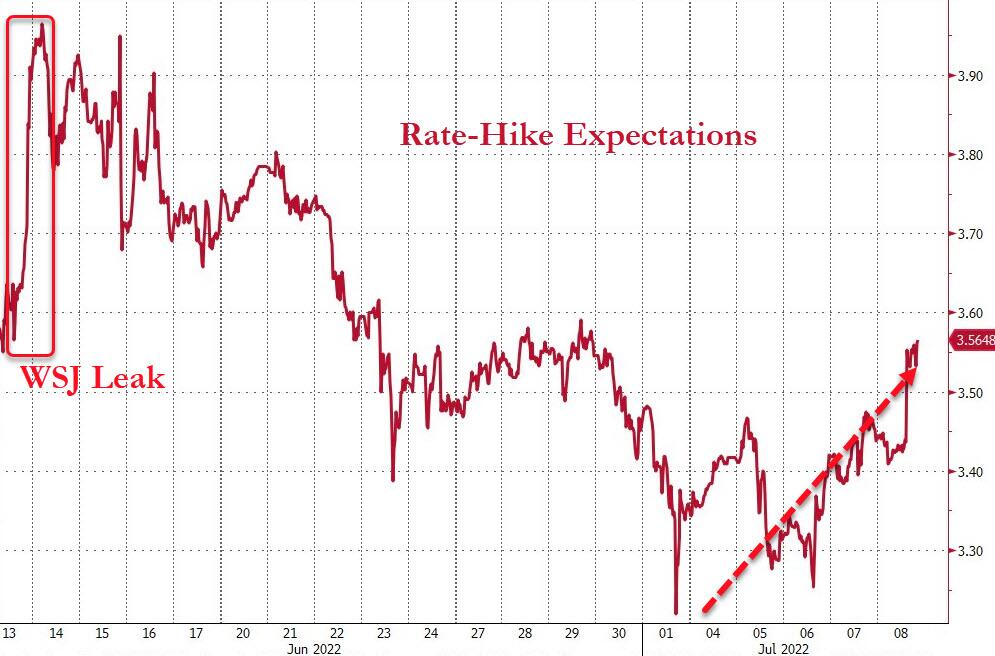
- Commodities crushed – recession anxiety, demand weaker? (but China reopening and stimulus)
- Bonds crushed – strong enough economy, inflation-fighting Fed hawkish
- Stocks strong – recession anxiety, end of Fed easing closer (Growth >> Value)
- Gold down hard – strong enough economy, inflation-fighting Fed hawkish
- Dollar up strong – strong enough economy relative to Europe (Fed ‘hawkisher’ than ECB)
- Payrolls headline strong BUT household survey ugly – so is the economy ‘strong enough’ or a shitshow?
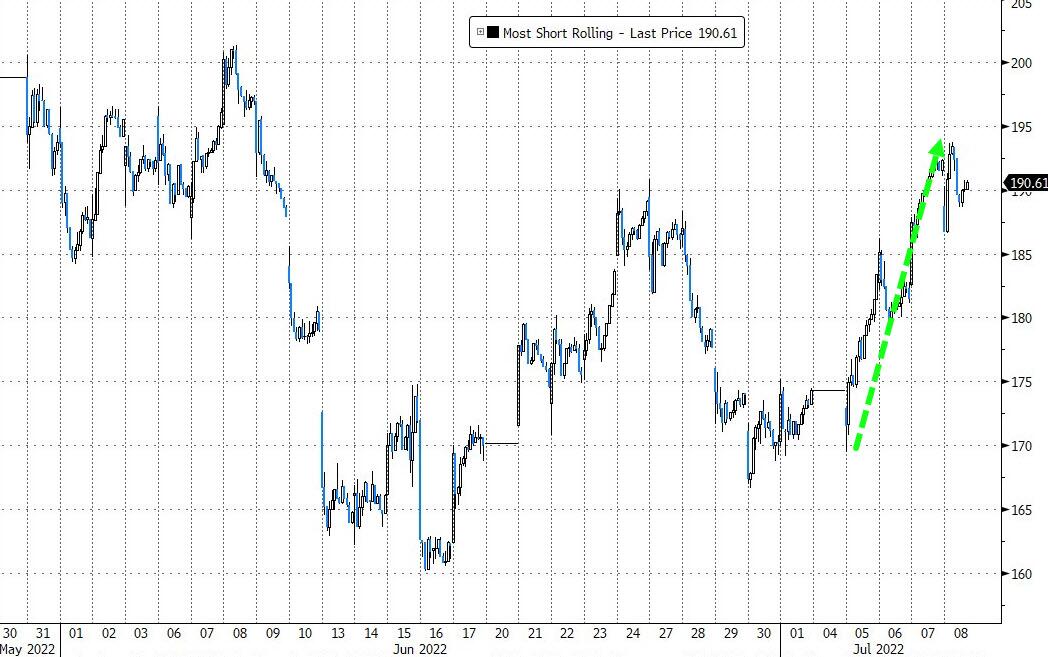
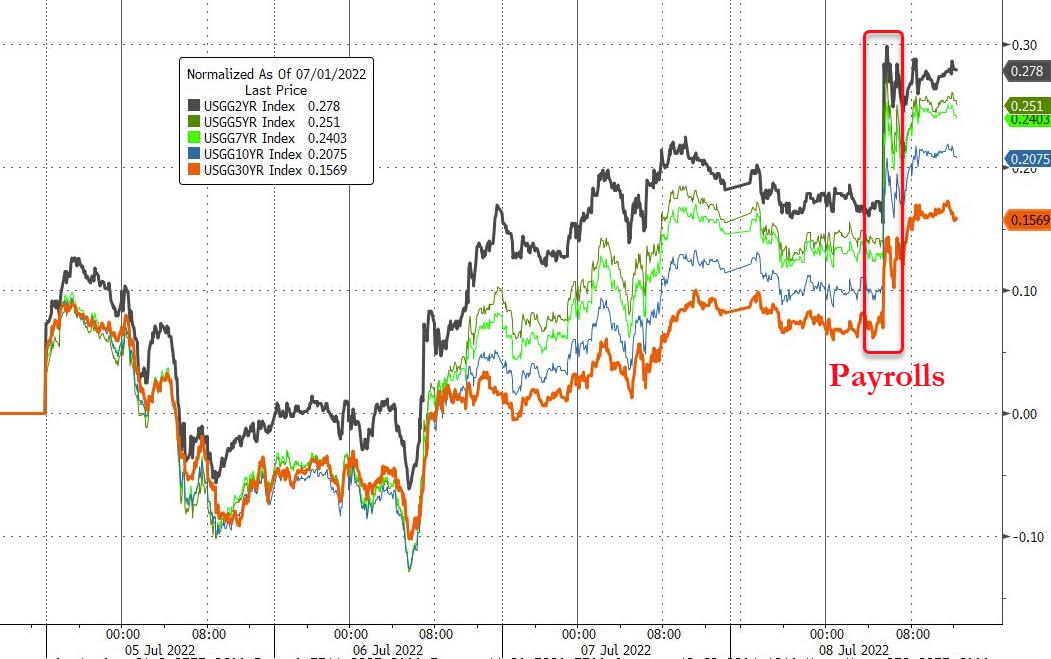
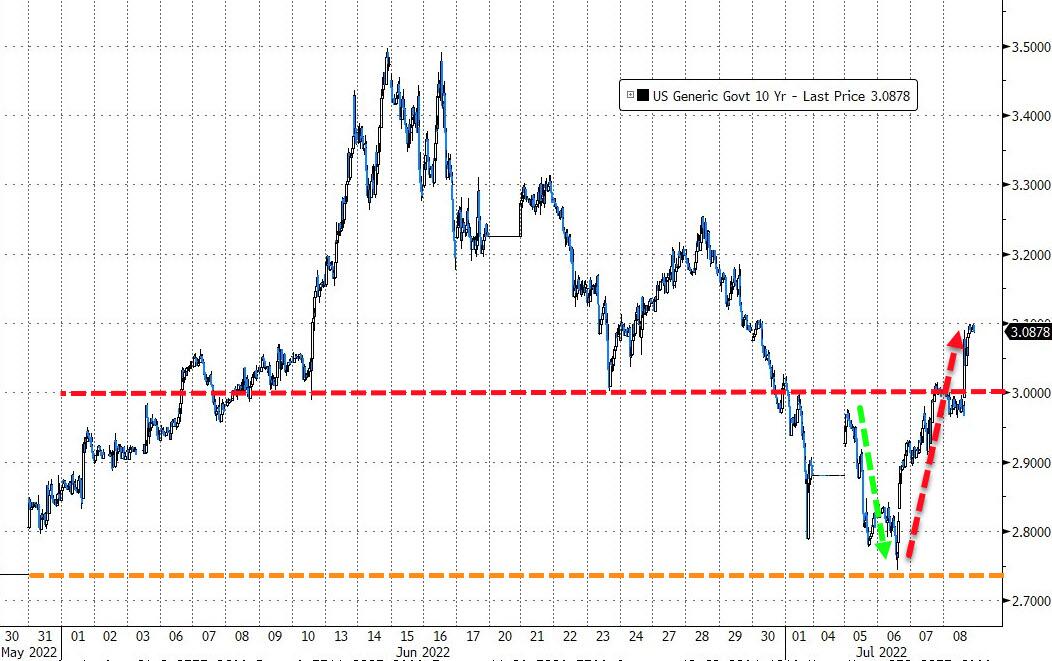
The short squeeze of the past few days ran out of steam, as bond yields headed higher with the 10-year reclaiming its 3% level and closing at 3.08%.
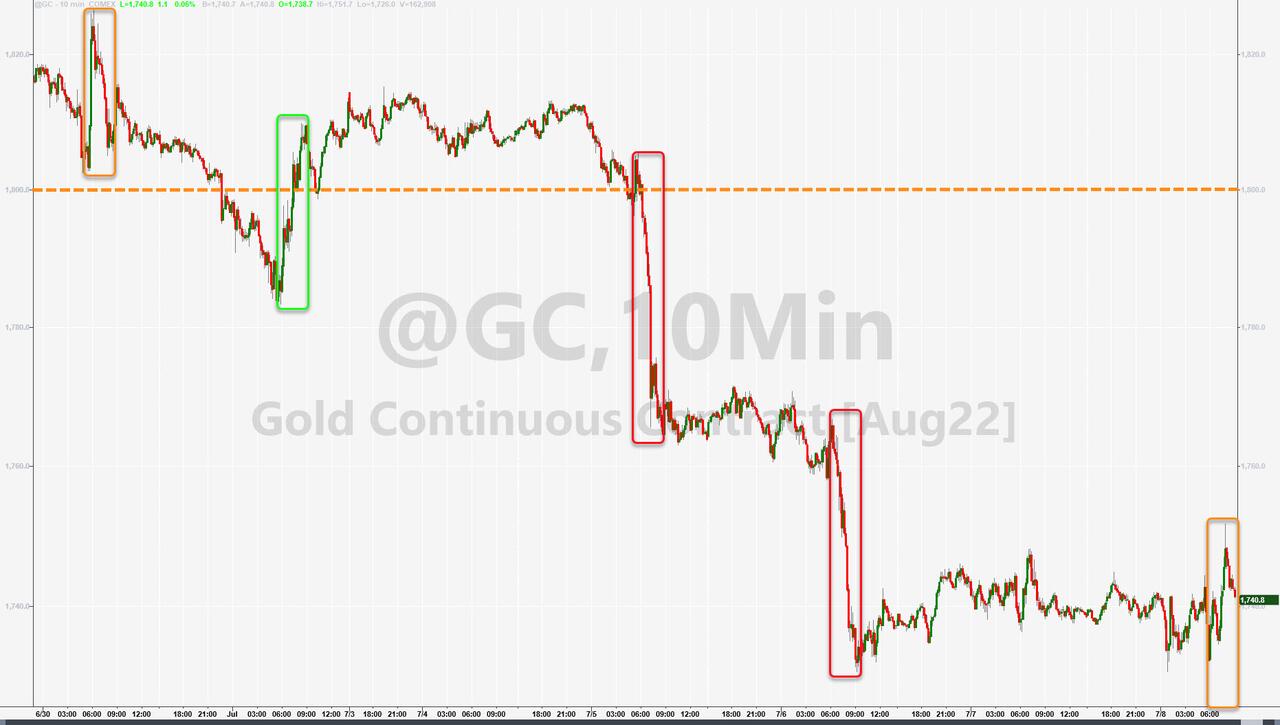
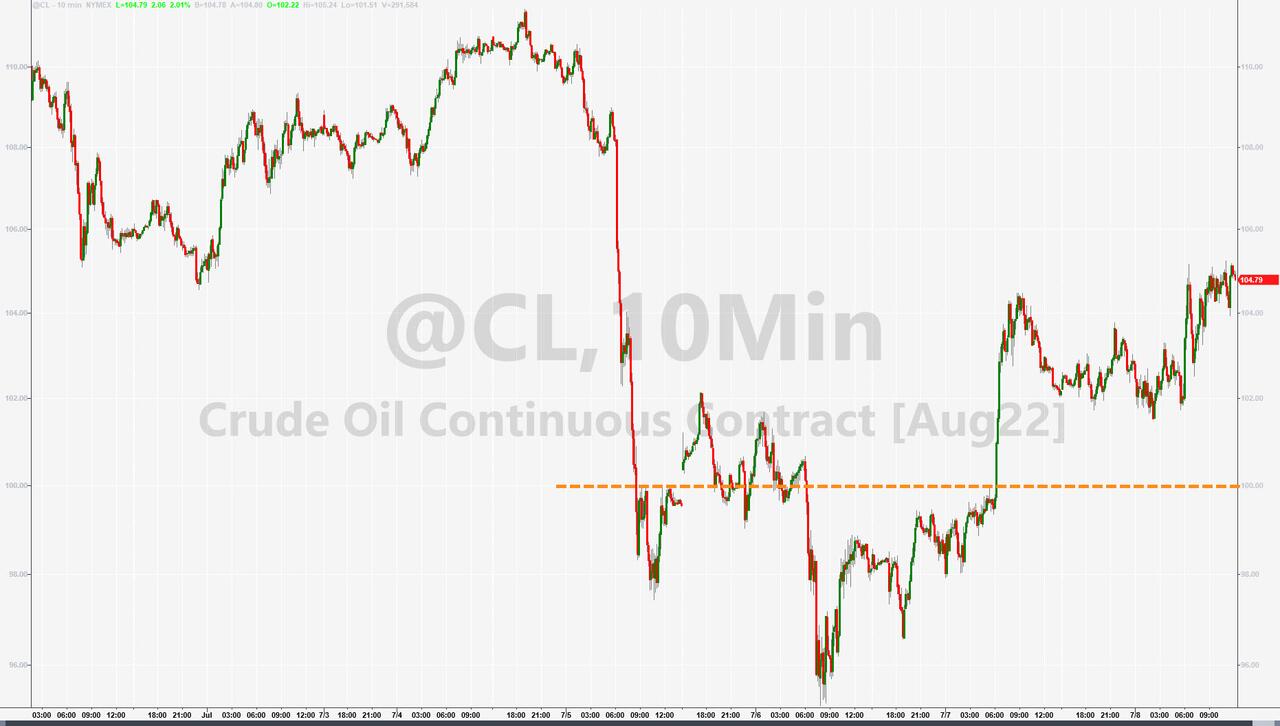
Commodities slipped and Gold followed suit but managed to show a green number today, while Crude Oil showed a similar weekly pattern to the precious metal.
For the record, this two-week period staring July 1st is the most bullish one of the year, as ZH elaborated.
But—will it last?
2. ETFs in the Spotlight
In case you missed the announcement and description of this section, you can read it here again.
It features some of the 10 broadly diversified domestic and sector ETFs from my HighVolume list as posted every Saturday. Furthermore, they are screened for the lowest MaxDD% number meaning they have been showing better resistance to temporary sell offs than all others over the past year.
The below table simply demonstrates the magnitude with which these ETFs are fluctuating above or below their respective individual trend lines (%+/-M/A). A break below, represented by a negative number, shows weakness, while a break above, represented by a positive percentage, shows strength.
For hundreds of ETF choices, be sure to reference Thursday’s StatSheet.
For this closed-out domestic “Buy” cycle (2/24/2022), here’s how some of our candidates have fared:
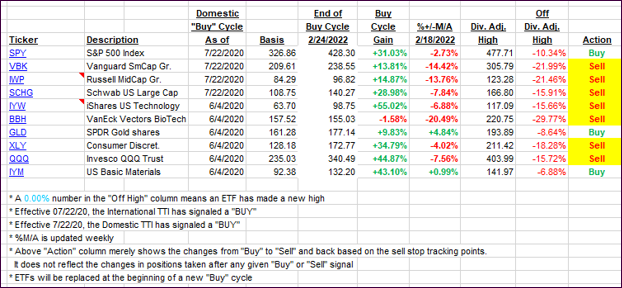
Click image to enlarge.
Again, the %+/-M/A column above shows the position of the various ETFs in relation to their respective long-term trend lines, while the trailing sell stops are being tracked in the “Off High” column. The “Action” column will signal a “Sell” once the -12% point has been taken out in the “Off High” column, which has replaced the prior -8% to -10% limits.
3. Trend Tracking Indexes (TTIs)
Our TTIs barely changed with the major indexes drifting sideways but managing to score a gain for the week.
This is how we closed 07/08/2022:
Domestic TTI: -9.54% below its M/A (prior close -9.42%)—Sell signal effective 02/24/2022.
International TTI: -11.60% below its M/A (prior close -12.10%)—Sell signal effective 03/08/2022.
Disclosure: I am obliged to inform you that I, as well as my advisory clients, own some of the ETFs listed in the above table. Furthermore, they do not represent a specific investment recommendation for you, they merely show which ETFs from the universe I track are falling within the specified guidelines.
All linked charts above are courtesy of Bloomberg via ZeroHedge.
———————————————————-
WOULD YOU LIKE TO HAVE YOUR INVESTMENTS PROFESSIONALLY MANAGED?
Do you have the time to follow our investment plans yourself? If you are a busy professional who would like to have his portfolio managed using our methodology, please contact me directly to get more details.
Contact Ulli