
- Moving the markets
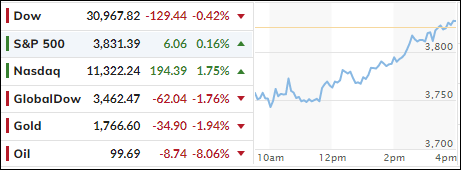
The unpredictable and wild market swings continued today, when the major indexes crashed at the opening with the Dow dumping some 700 points.
As we’ve seen numerous times in the past, a slow and steady climb ensued pulling stocks out of a deep hole, which helped the S&P end a tad in the green, thereby erasing an early 2% loss, while the Dow headed into a much-improved red close. The Nasdaq fared the best and posted a 1.75% gain.
The markets have now dropped four of the past five weeks and remain stuck on the bearish side of their respective trend lines. Economic growth concerns in the face of worsening inflation have added confusion and uncertainty to the markets, as the latest FedNow indicator, which showed 2 consecutive quarters of negative growth, has confirmed a recession.
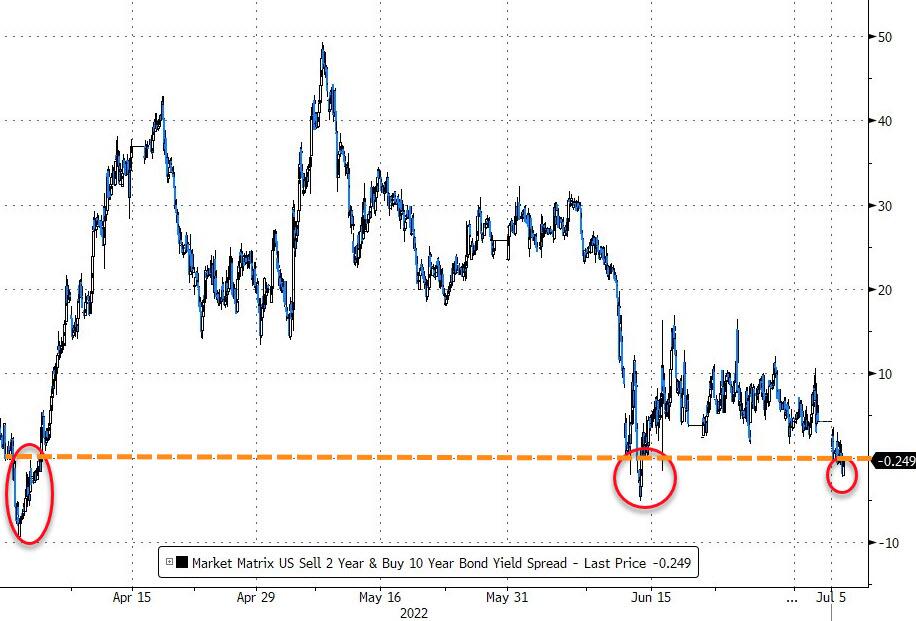
Adding insult to injury was the fact that 10-year bond yield and the 2-year yield inverted today, a move that has historically confirmed a recession in the making. It simply means that when short-term yields trade above long-term ones, it’s a sign that investors anticipate a slowdown, which is usually accompanied by rate cuts.
That puts the Fed between a rock and a hard place, since hiking rates to battle inflationary forces will not bode well within a slowing economy.
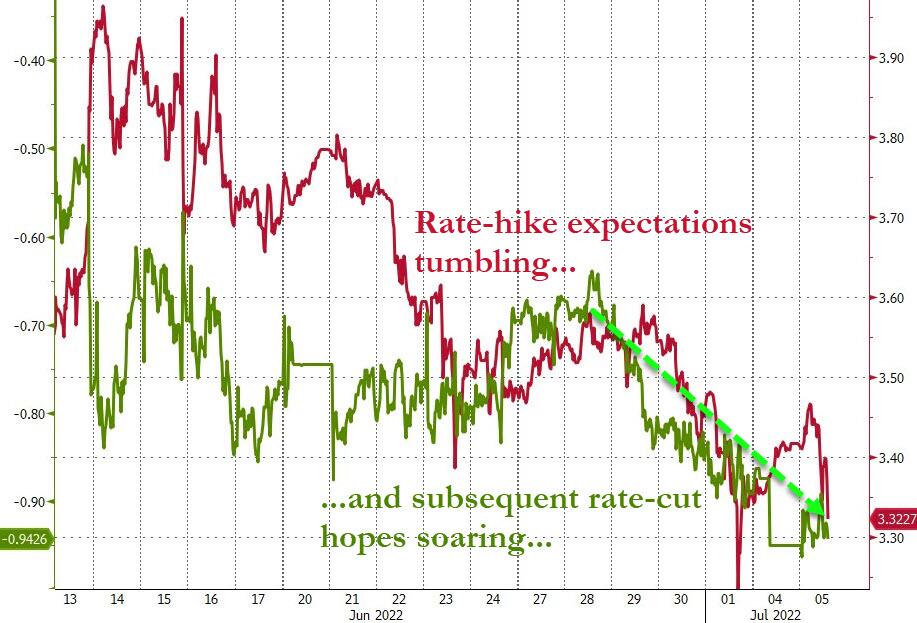
Given this anticipated slowdown, and the accompanying reduction in demand, it came as no surprise that Crude Oil dumped 8% to close below $100 and rate-hike expectations tumbled, as ZH pointed out.
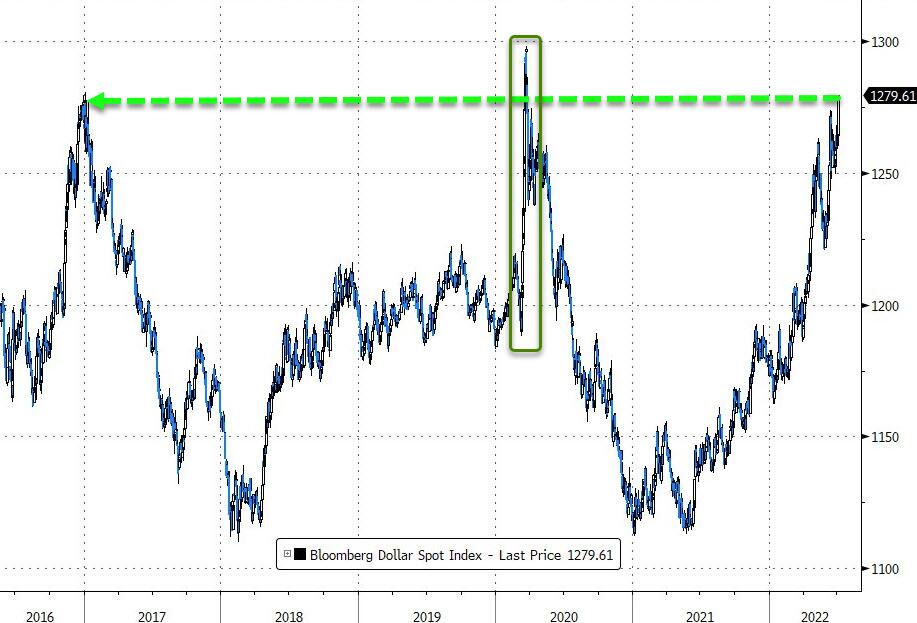
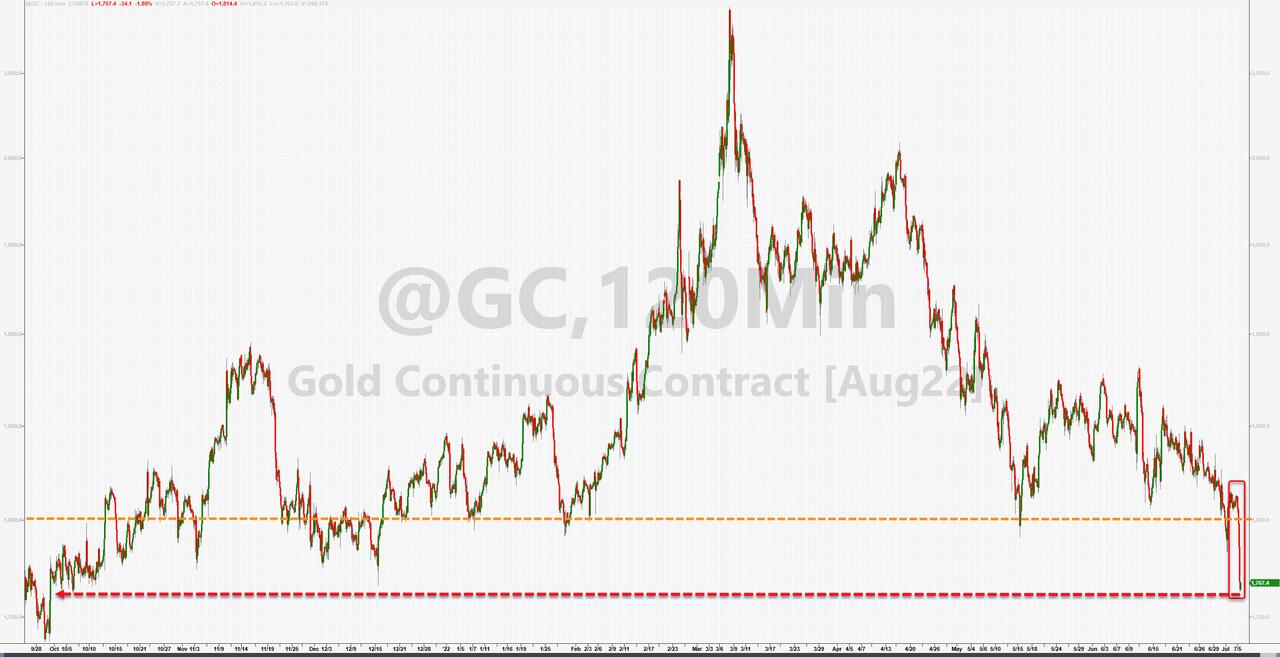
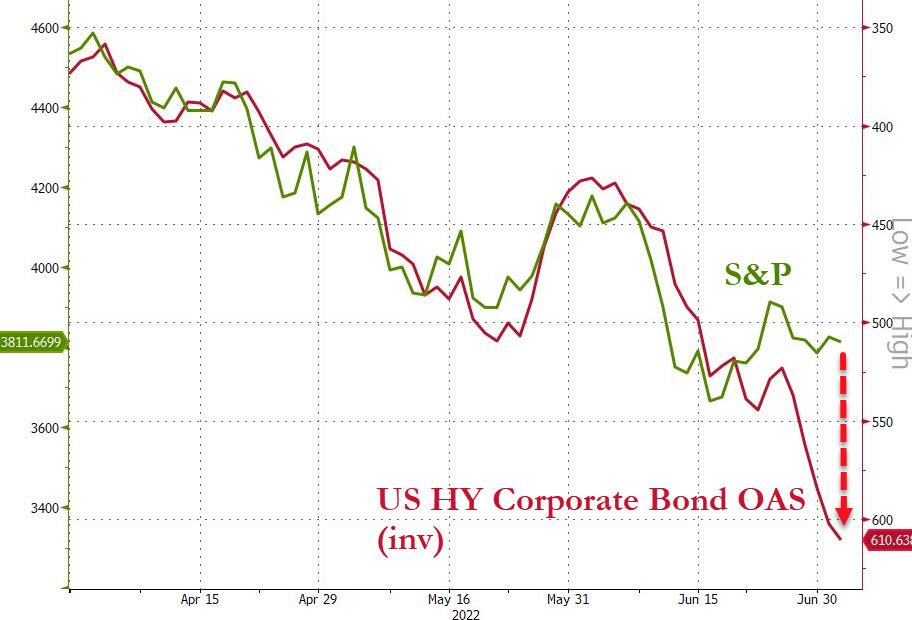
The US Dollar rallied causing Gold to take a hit with the precious metal losing its $1,800 level. Interestingly, junk bonds did not seem to agree with today’s rally, as Bloomberg shows in this chart. Since they tend to be a leading indicator, we may see more downside in equities coming our way.
2. ETFs in the Spotlight
In case you missed the announcement and description of this section, you can read it here again.
It features some of the 10 broadly diversified domestic and sector ETFs from my HighVolume list as posted every Saturday. Furthermore, they are screened for the lowest MaxDD% number meaning they have been showing better resistance to temporary sell offs than all others over the past year.
The below table simply demonstrates the magnitude with which these ETFs are fluctuating above or below their respective individual trend lines (%+/-M/A). A break below, represented by a negative number, shows weakness, while a break above, represented by a positive percentage, shows strength.
For hundreds of ETF choices, be sure to reference Thursday’s StatSheet.
For this closed-out domestic “Buy” cycle (2/24/2022), here’s how some of our candidates have fared:
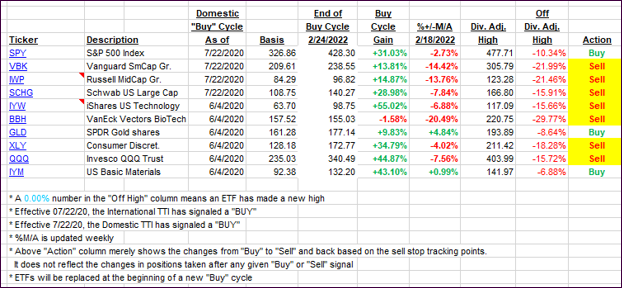
Click image to enlarge.
Again, the %+/-M/A column above shows the position of the various ETFs in relation to their respective long-term trend lines, while the trailing sell stops are being tracked in the “Off High” column. The “Action” column will signal a “Sell” once the -12% point has been taken out in the “Off High” column, which has replaced the prior -8% to -10% limits.
3. Trend Tracking Indexes (TTIs)
Our TTIs dropped with the International one taking a much bigger hit than its domestic cousin.
This is how we closed 07/05/2022:
Domestic TTI: -10.74% below its M/A (prior close -10.53%)—Sell signal effective 02/24/2022.
International TTI: -13.21% below its M/A (prior close -11.92%)—Sell signal effective 03/08/2022.
Disclosure: I am obliged to inform you that I, as well as my advisory clients, own some of the ETFs listed in the above table. Furthermore, they do not represent a specific investment recommendation for you, they merely show which ETFs from the universe I track are falling within the specified guidelines.
All linked charts above are courtesy of Bloomberg via ZeroHedge.
Contact Ulli