
- Moving the markets
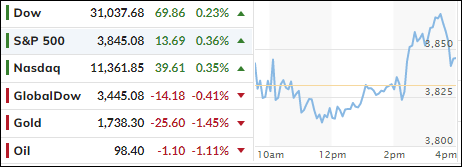
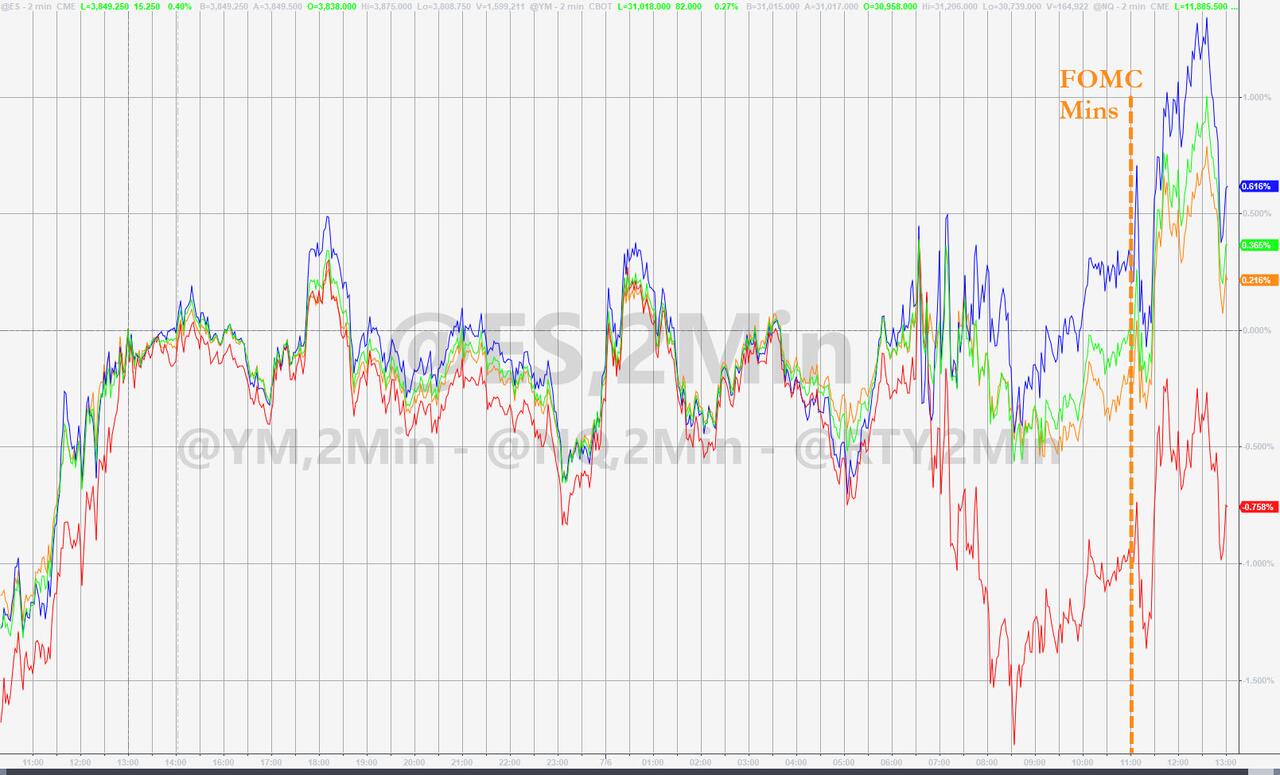
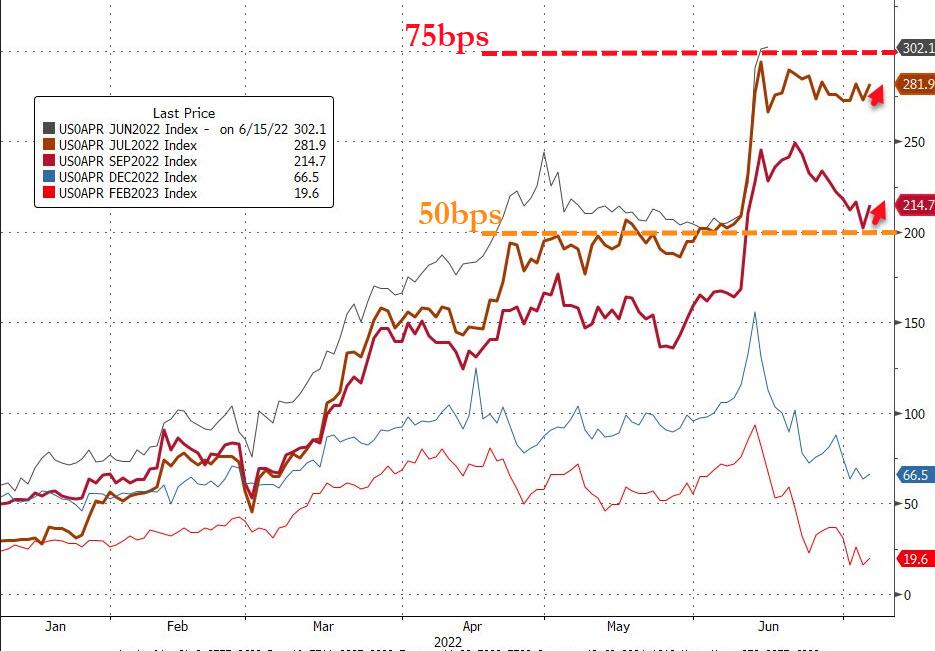
Another wild session had the markets bobbing and weaving, yet the major indexes managed to eke out a small gain. All eyes had been on the release of the Fed’s FOMC minutes from June, which indicated that they had not wavered from their commitment to bring inflation down. The unanswered question was whether we will see a 50bps or 75bps hike in rates later this month.
Traders continued to ascertain whether the Fed would return to its easy money policy not because they had success reducing inflation (they did not) but more so due to weakening economic conditions. So far, there has been no clear answer.
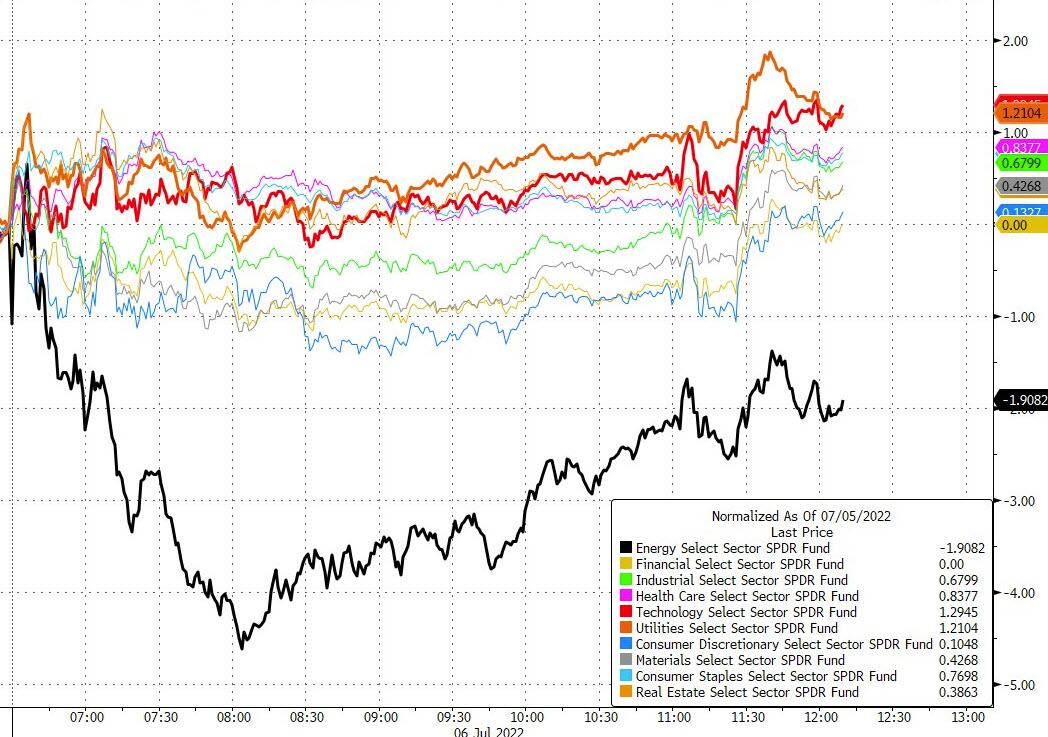
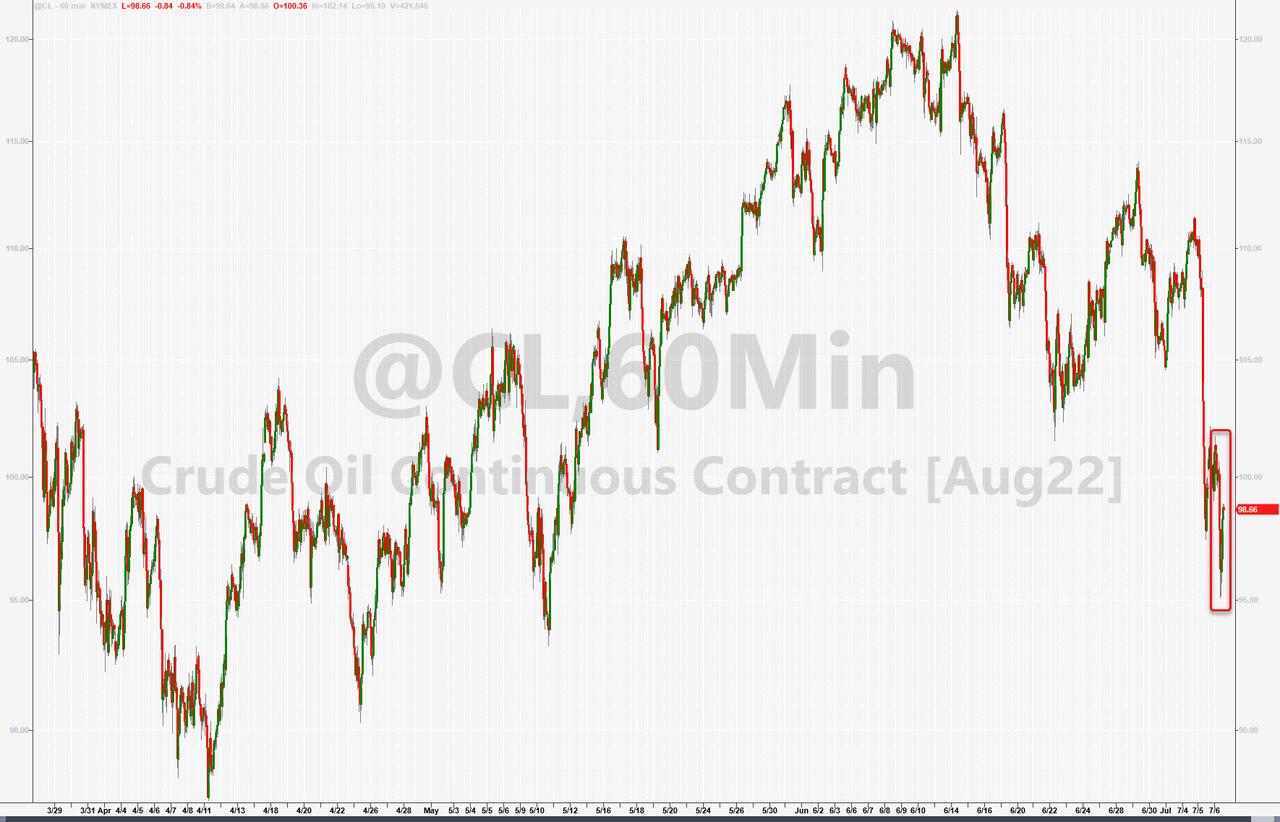
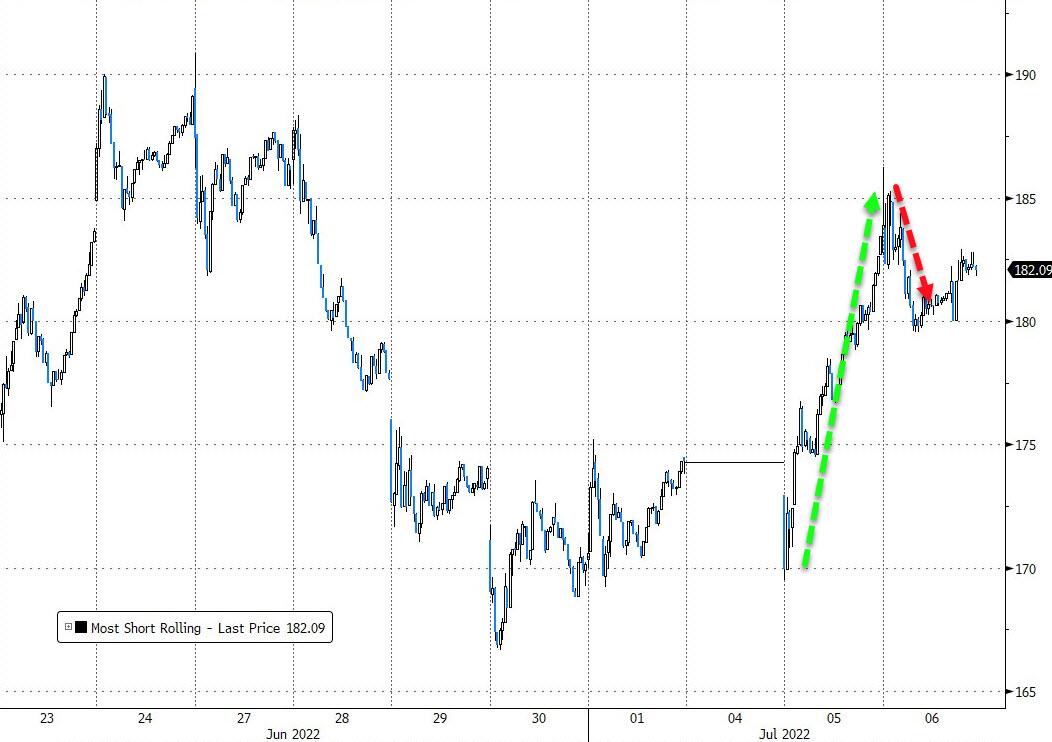
Despite energy rebounding late in the session, it still turned out to be the worst performer of all sectors, with crude oil taking another hit and remaining below the $100 level. It was a “going nowhere” kind of session, as yesterday’s short squeeze died on the vine.
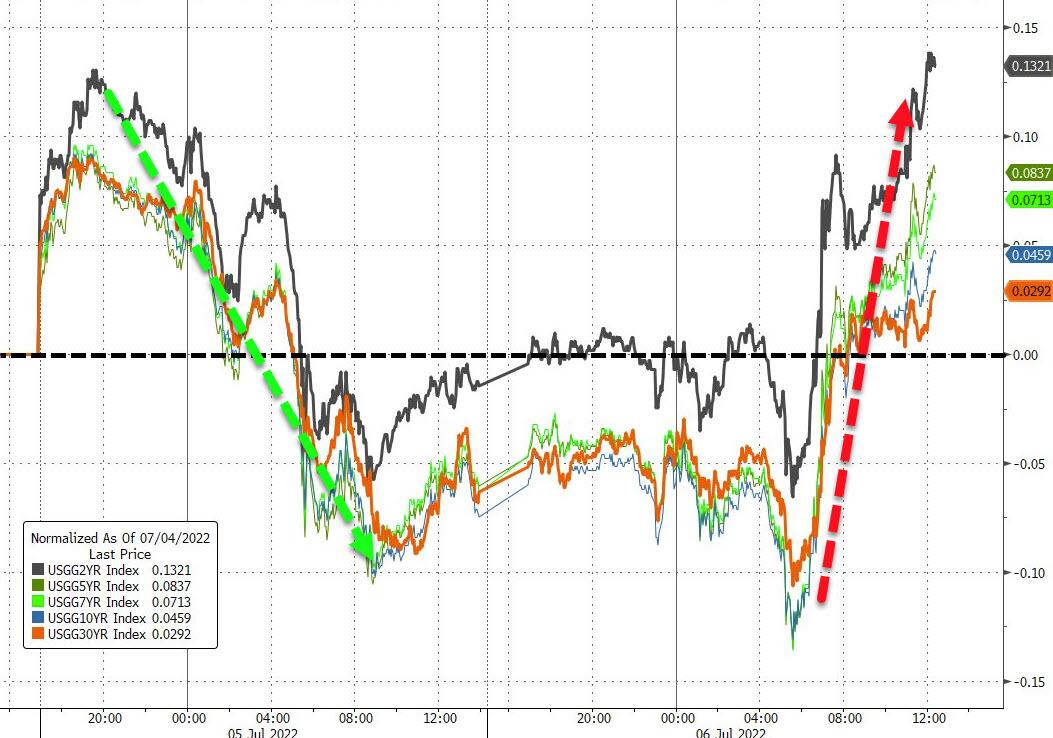
Despite bond yields storming back with a vengeance, as the 10-year rose almost 13 bps to close at 2.93%, stocks were not negatively affected—yet.
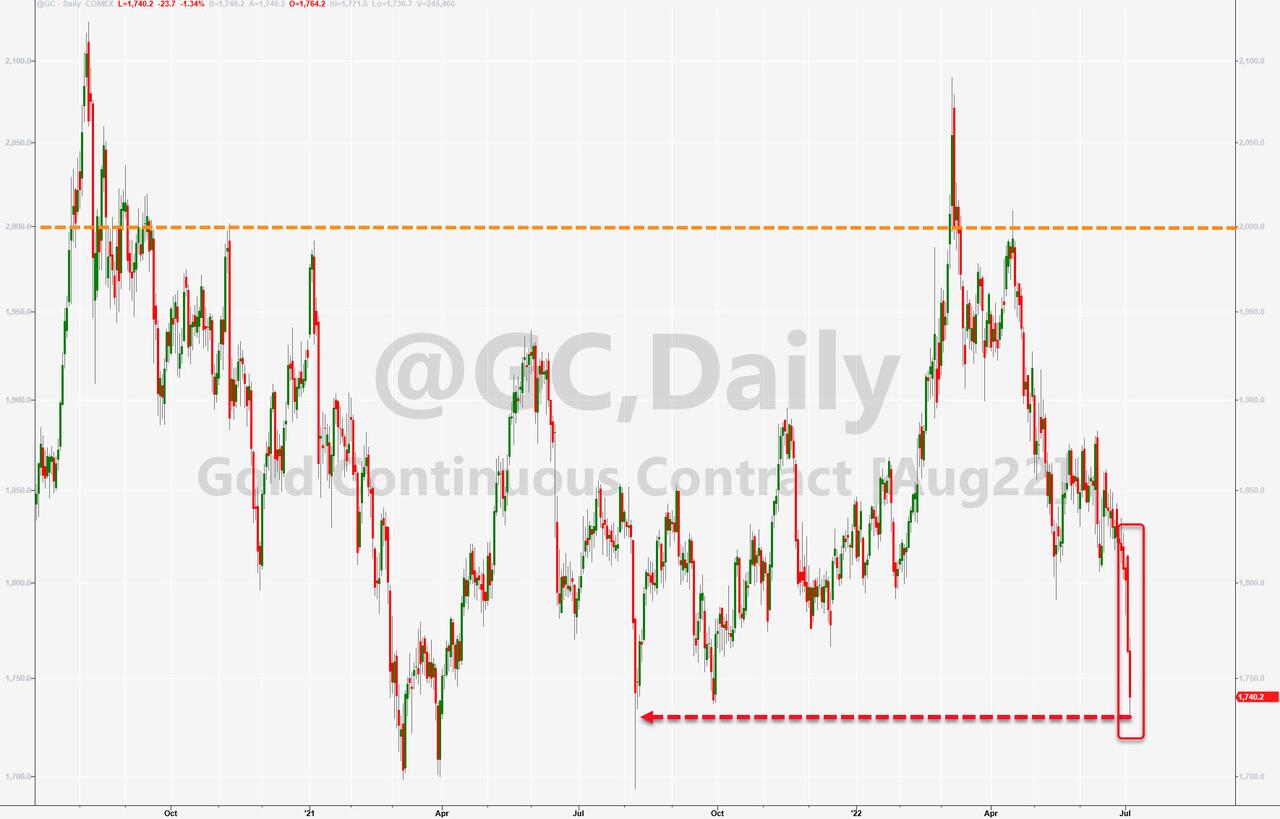
The US Dollar continued to edge higher and built on yesterday’s gains, while Gold trended lower to end the day at $1,737.
The question in my mind is this one: Can the upcoming earnings season provide enough impetus via positive numbers and improved outlooks to battle the fact that we are sliding into a recession?
Hmm…
2. ETFs in the Spotlight
In case you missed the announcement and description of this section, you can read it here again.
It features some of the 10 broadly diversified domestic and sector ETFs from my HighVolume list as posted every Saturday. Furthermore, they are screened for the lowest MaxDD% number meaning they have been showing better resistance to temporary sell offs than all others over the past year.
The below table simply demonstrates the magnitude with which these ETFs are fluctuating above or below their respective individual trend lines (%+/-M/A). A break below, represented by a negative number, shows weakness, while a break above, represented by a positive percentage, shows strength.
For hundreds of ETF choices, be sure to reference Thursday’s StatSheet.
For this closed-out domestic “Buy” cycle (2/24/2022), here’s how some of our candidates have fared:
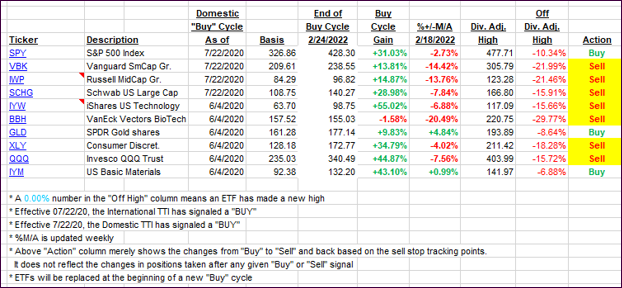
Click image to enlarge.
Again, the %+/-M/A column above shows the position of the various ETFs in relation to their respective long-term trend lines, while the trailing sell stops are being tracked in the “Off High” column. The “Action” column will signal a “Sell” once the -12% point has been taken out in the “Off High” column, which has replaced the prior -8% to -10% limits.
3. Trend Tracking Indexes (TTIs)
Our TTIs changed only immaterially, as the markets were treading water.
This is how we closed 07/06/2022:
Domestic TTI: -10.72% below its M/A (prior close -10.74%)—Sell signal effective 02/24/2022.
International TTI: -13.64% below its M/A (prior close -13.21%)—Sell signal effective 03/08/2022.
Disclosure: I am obliged to inform you that I, as well as my advisory clients, own some of the ETFs listed in the above table. Furthermore, they do not represent a specific investment recommendation for you, they merely show which ETFs from the universe I track are falling within the specified guidelines.
All linked charts above are courtesy of Bloomberg via ZeroHedge.
Contact Ulli