
ETF Tracker StatSheet
You can view the latest version here.
ANOTHER ROLLER COASTER RIDE
- Moving the markets
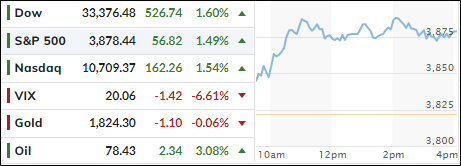
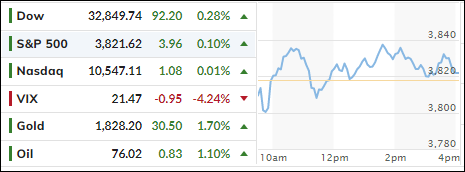
While Wednesday’s rebound rekindled thoughts of a Santa Claus rally, those hopes were wiped out yesterday, when the markets got clubbed and surrendered all the prior day’s gains. The S&P 500 closed yesterday exactly at Wednesday’s level. Go figure…
Thursday, the markets threw a tantrum with Tesla plunging 11%. Hedge fund guru David Tepper threw more gasoline on the fire by commenting that traders should not ignore what the central bankers are saying:
I would probably say I’m leaning short on the equity markets right now because the upside/downside doesn’t make sense to me when I have so many Central banks telling me what they are going to do, what they want to do, what they expect to do.
Not helping matters was an unexpectedly hot 3.2% GDP number (above the 2.9% estimate), which was good news, as far as the economy is concerned, but bad news for equities, with traders fearing that the much hoped for Fed pivot remains nothing but wishful thinking.
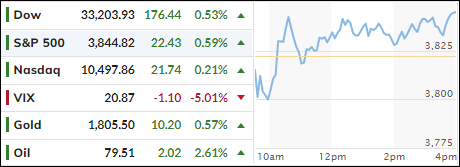
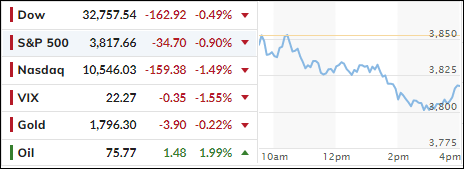
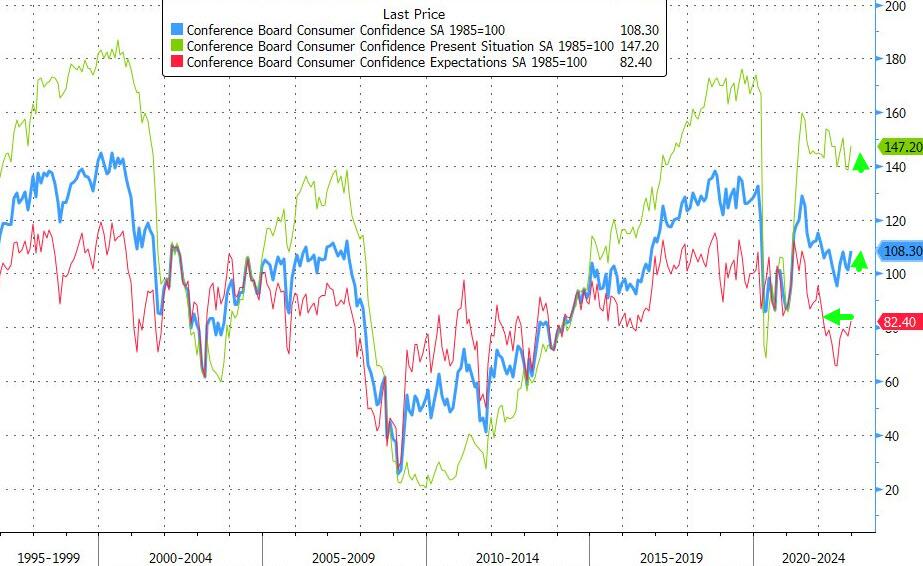
Today, the bulls managed to tip the scales slightly in their favor but, given the losses for the past 5 trading days, the S&P and Nasdaq declined for a third straight week. Recession fears continue to batter sentiment, as the following mixed data points kept traders on edge:
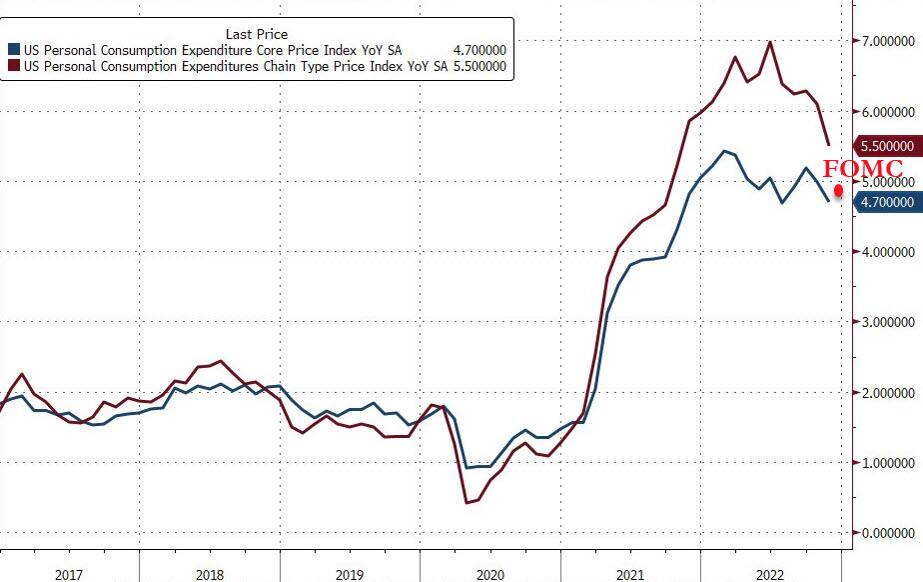
- The Fed’s favorite inflation indicator (PCE) came in hotter than expected (+4.7% YoY vs. +4.6% expected.
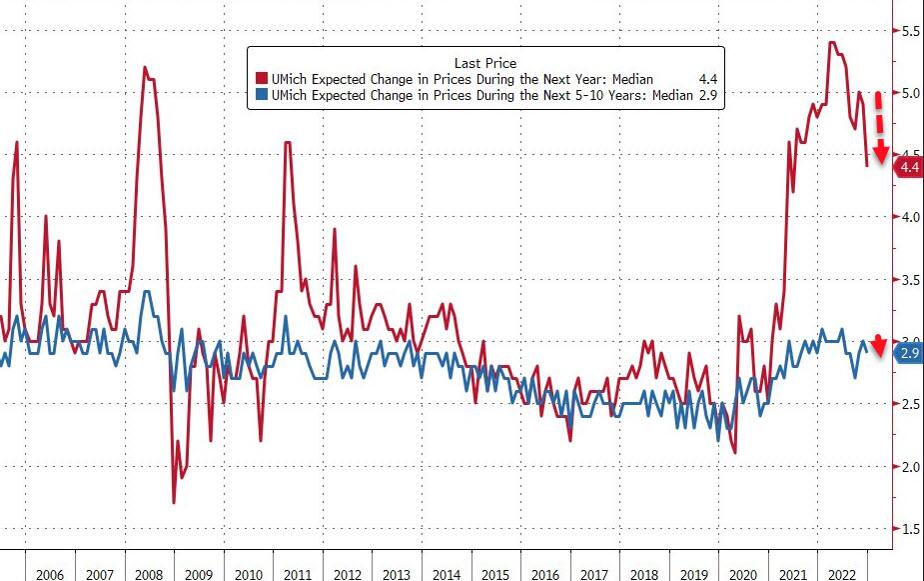
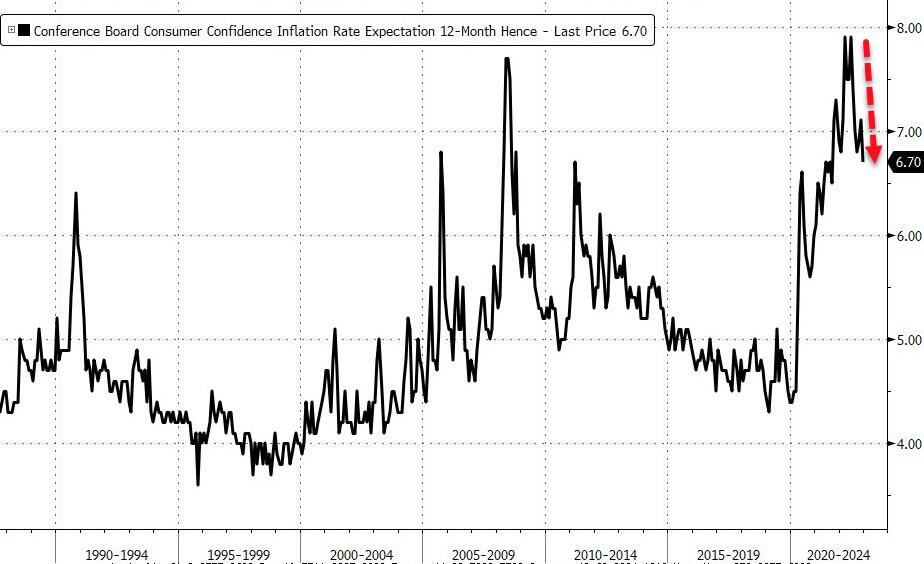
- US Inflation Expectations tumble to 18-month lows
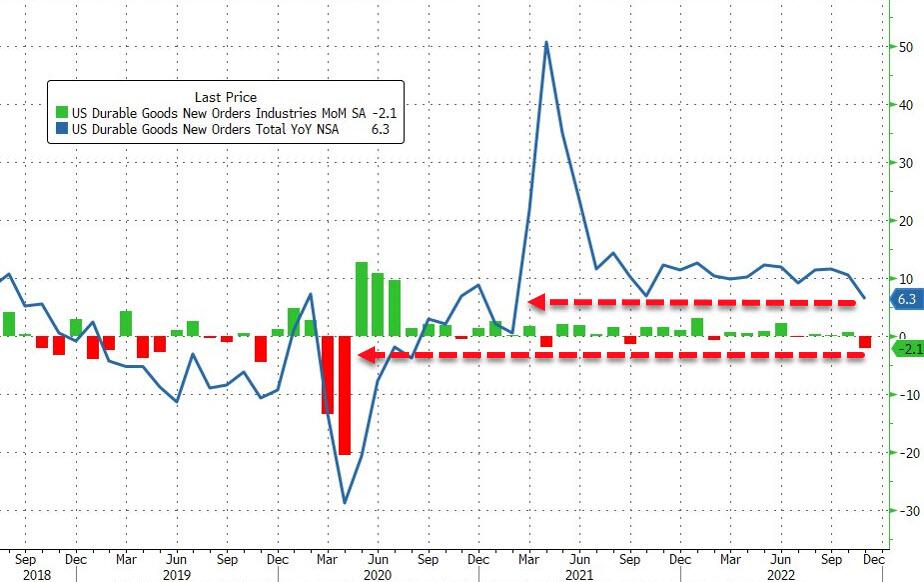
- US Durable Orders plunge in November, biggest drop since Covid
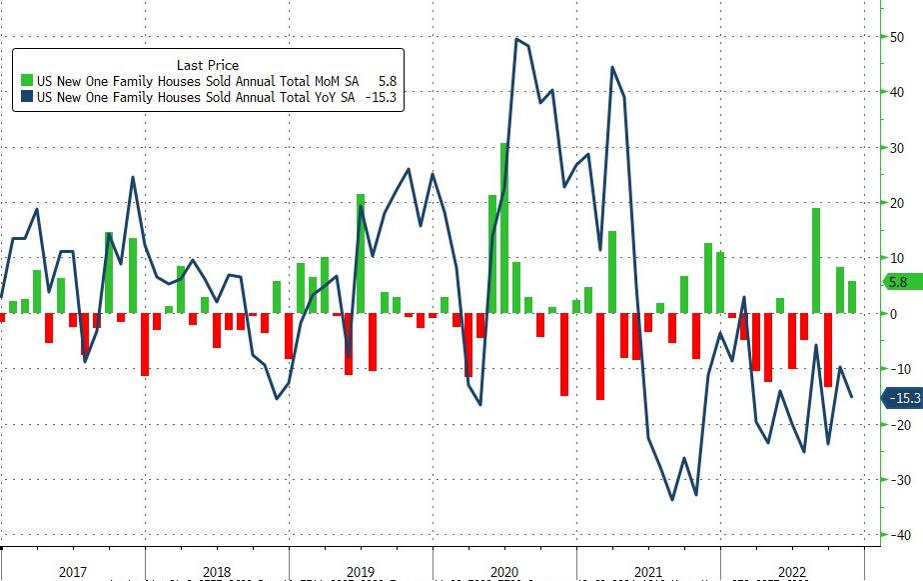
- US New Home Sales unexpectedly soar in November
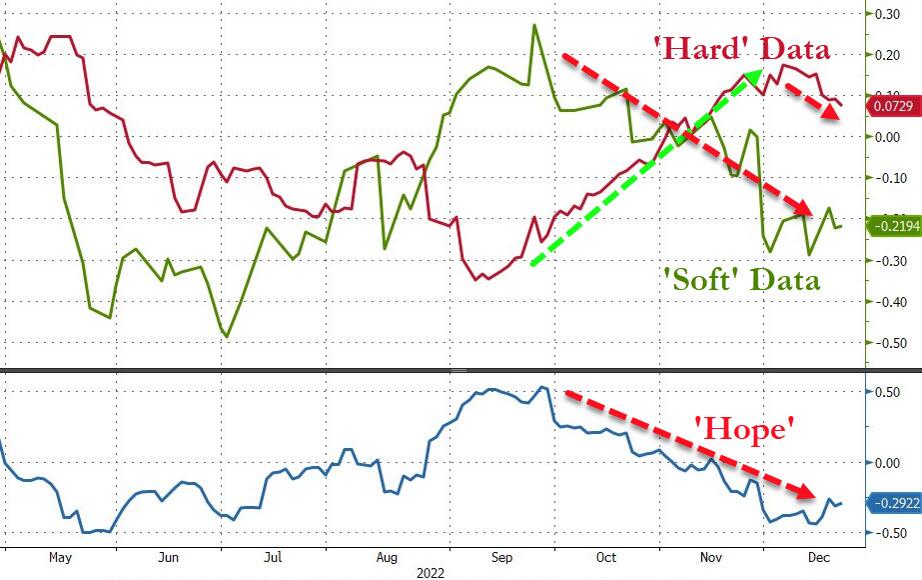
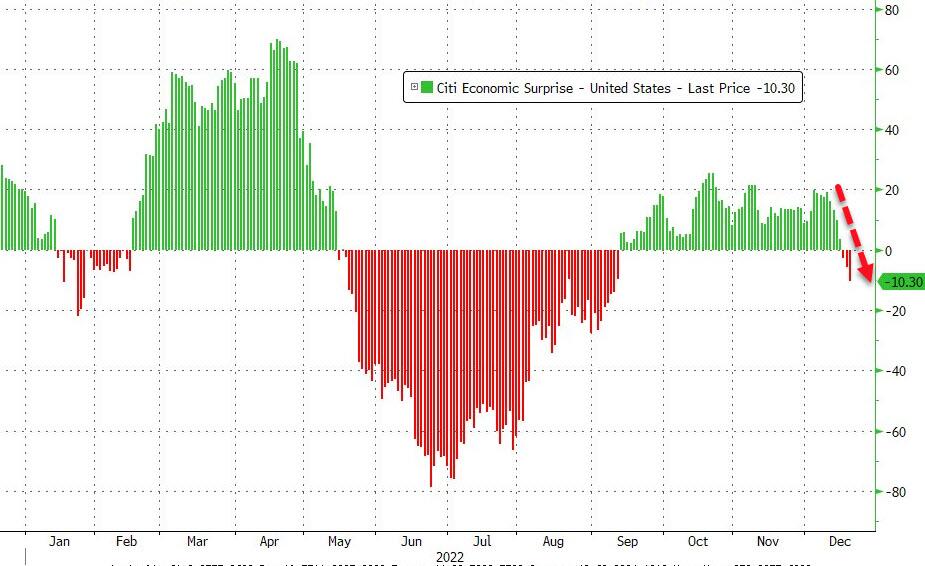
No wonder that the markets are non-directional with weak numbers bringing recession fears and strong numbers creating Fed fears, as MarketWatch put it. Hard data and soft data seem to be converging, as ZeroHedge pointed out, which does not favor a soft landing.
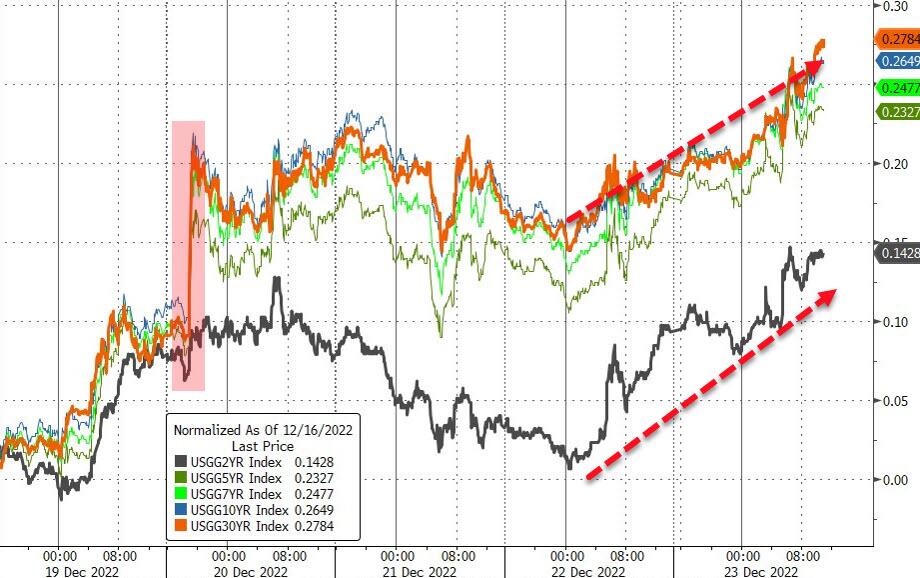
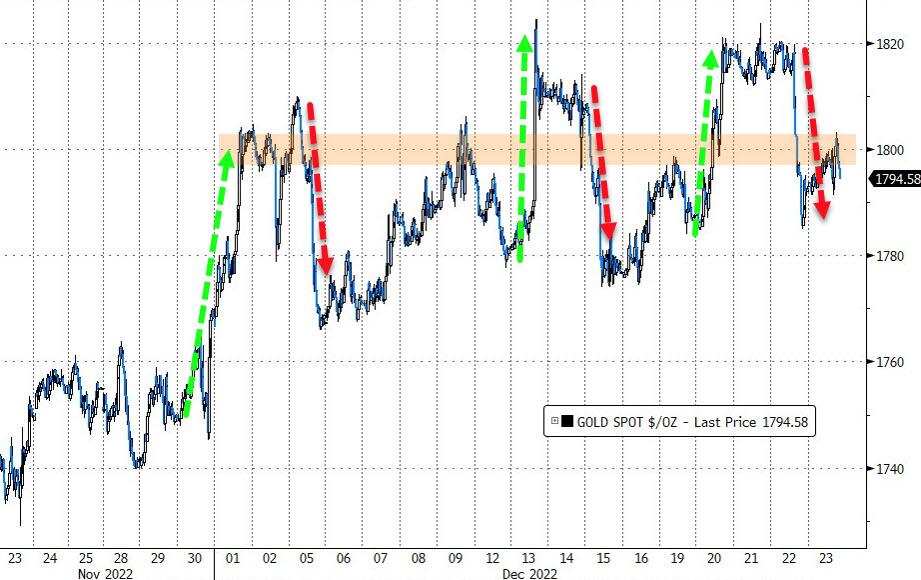
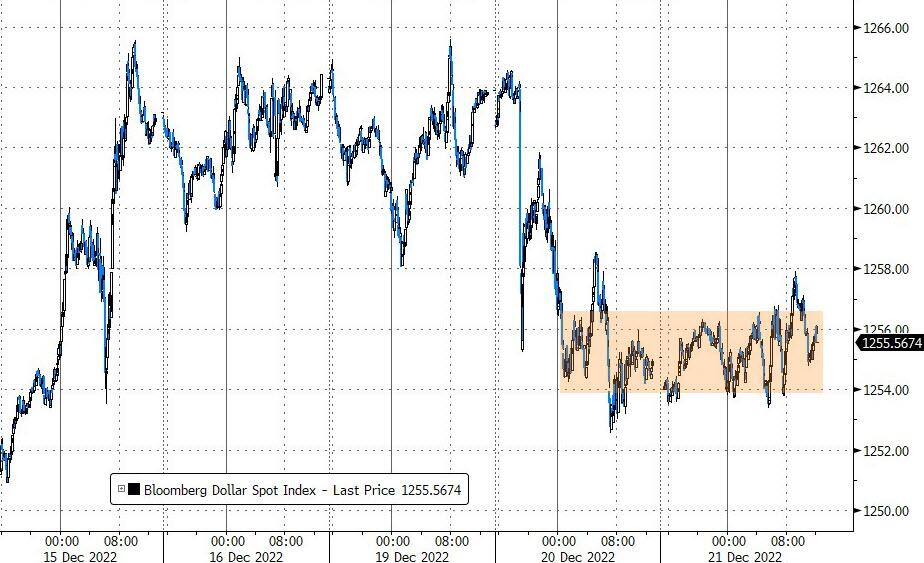
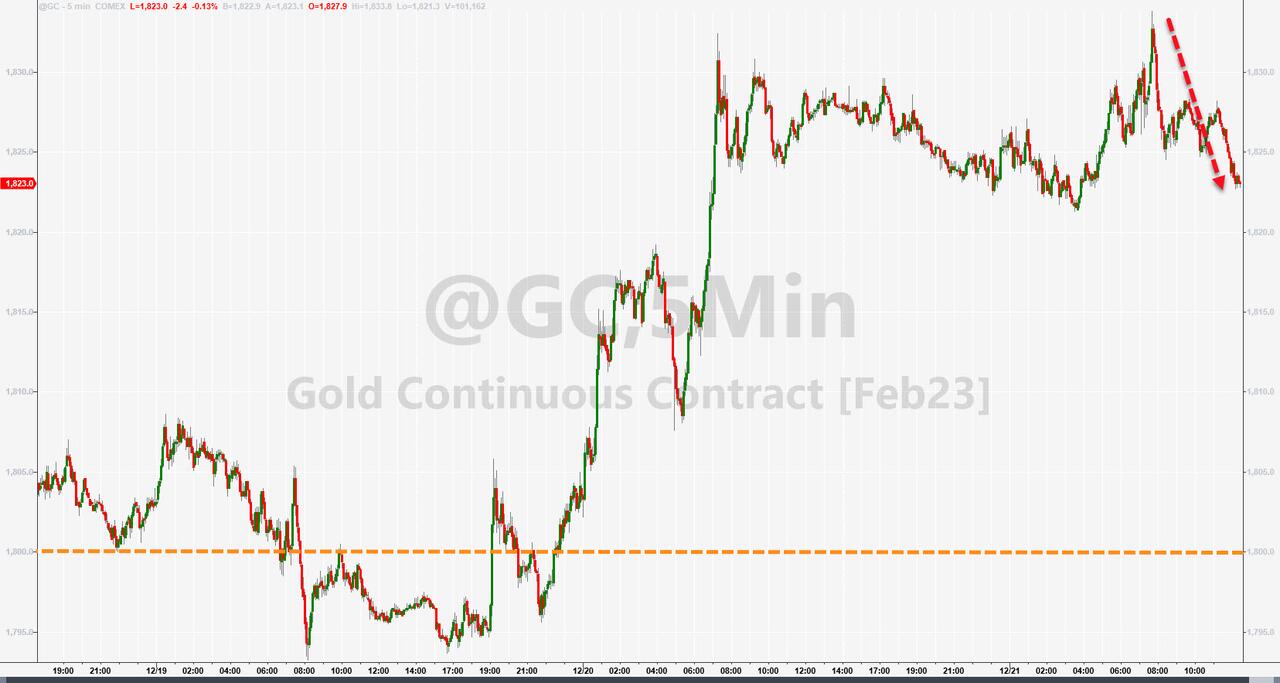
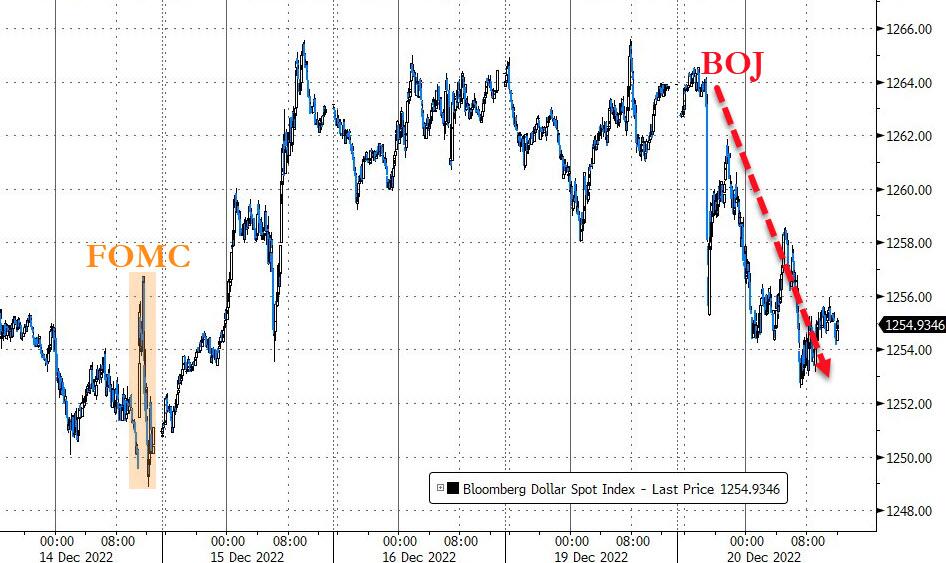
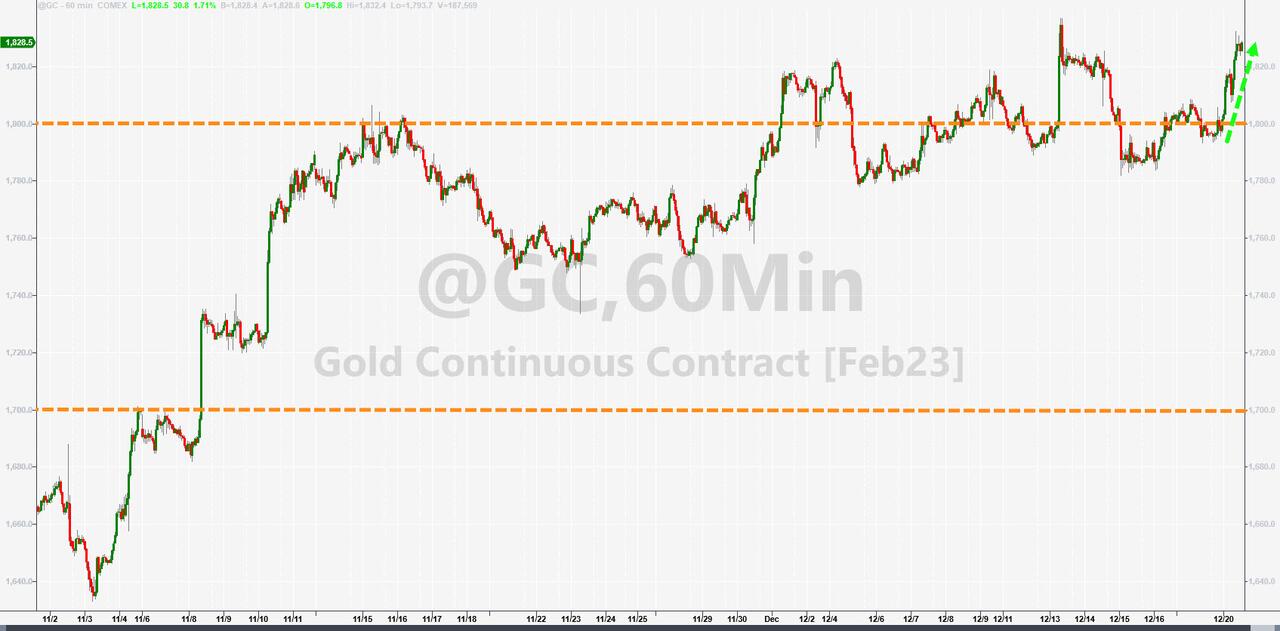
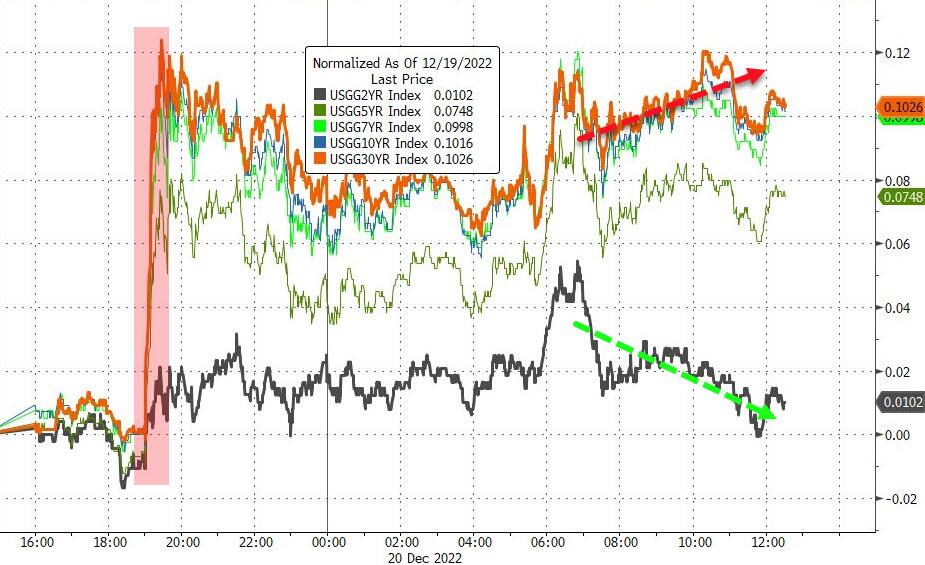
Bond yields surged this week with the 10-year taking the lead by gaining 26 bps to close at 3.75%, while the US Dollar slipped, yet Gold ended the week unchanged after zig-zagging the entire December.
If traders don’t step up to the plate and create some bullish momentum during the last 4 trading days of 2022, tech stocks will end up notching their 2nd worst December ever.
Have a very Merry Christmas!
Read More