Below, please find the latest High-Volume ETF Cutline report, which shows how far above or below their respective long-term trend lines (39-week SMA) my currently tracked ETFs are positioned.
This report covers the HV ETF Master List from Thursday’s StatSheet and includes 312 High Volume ETFs, defined as those with an average daily volume of more than $5 million, of which currently 105 (last report: 100) are hovering in bullish territory. The yellow line separates those ETFs that are positioned above their trend line (%M/A) from those that have dropped below it.
In case you are not familiar with some of the terminology used in the reports, please read the Glossary of Terms. If you missed the original post about the Cutline approach, you can read it here.
EQUITIES FINISH THEIR WORST YEAR SINCE 2008 WITH A SELL-OFF
[Chart courtesy of MarketWatch.com]
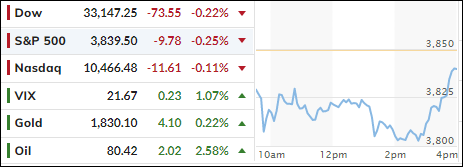
Moving the markets
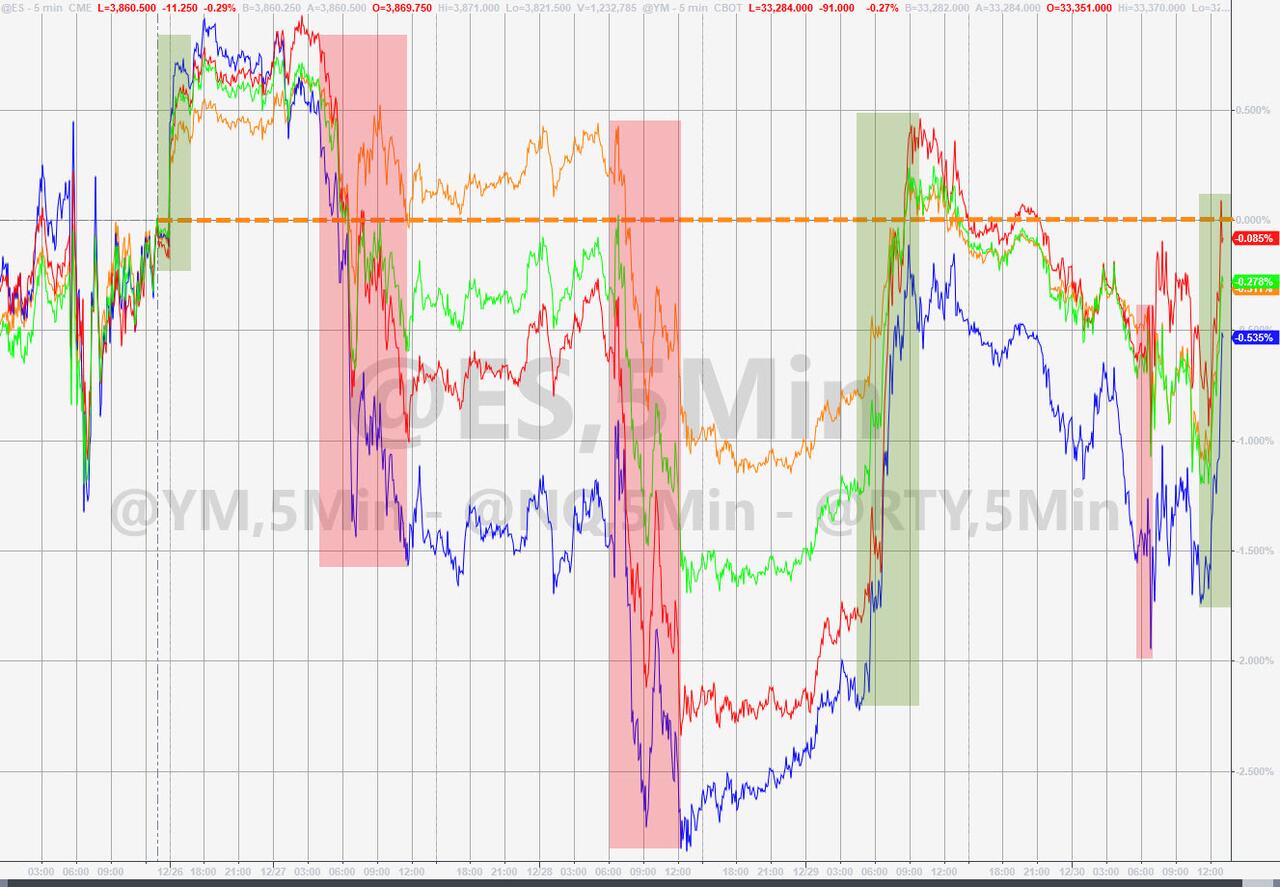
Despite the market’s successful attempt at staging a rally yesterday, it was not enough to overcome the weakness in equities, as the indexes simply got whiplashed with nothing to show for when looking at the past week.
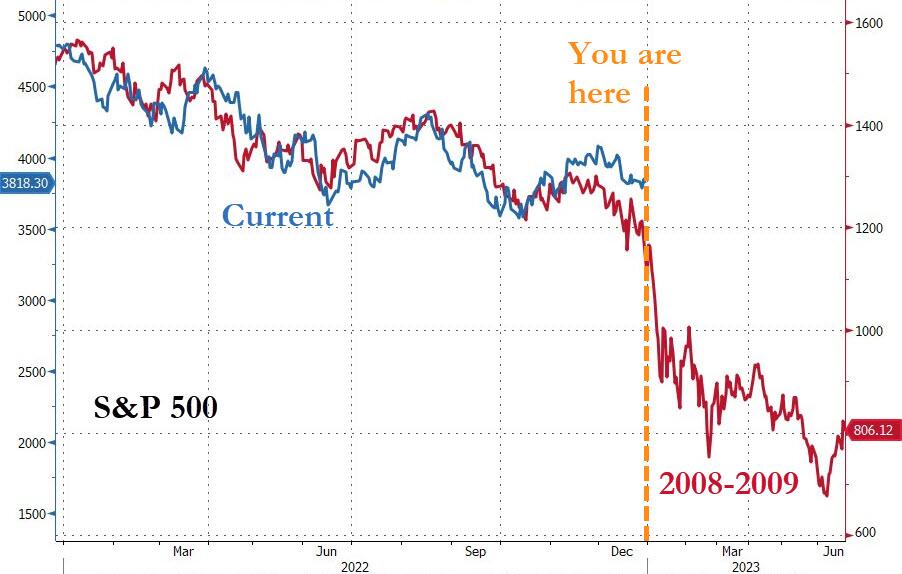
This type of activity pretty much reflects how 2022 played out, with the indexes notching their worst year since 2008 and leaving the buy and hold crowd with steep losses, despite a positive the 4th quarter.
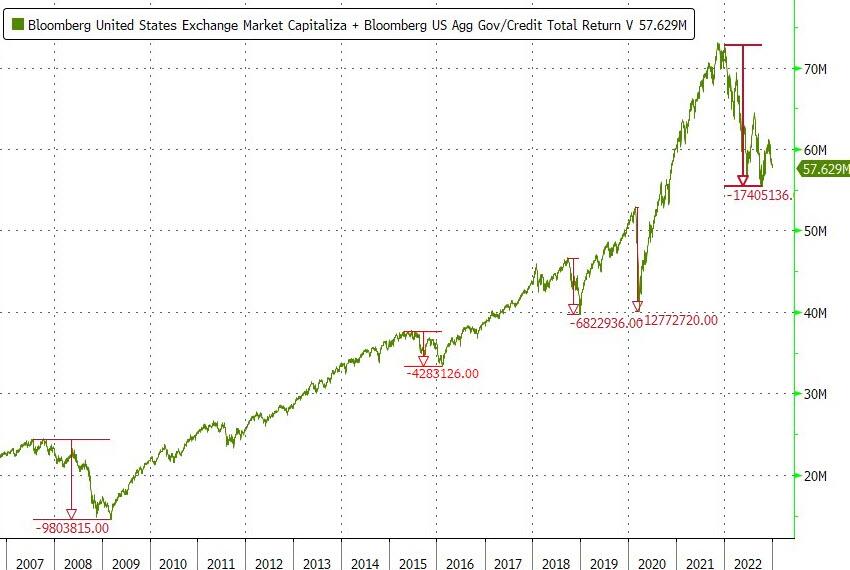
YTD, the S&P 500 (SPY) dropped around -19.3% with bonds faring far worse, as the widely held Bond ETF TLT dumped an amazing -32%, which was only “outdone” by the Nasdaq’s -33% loss. So much for the perceived safety of bonds. Combined, US equity and bond markets lost $17.4 trillion at their October lows. Ouch!
The current environment is best described as skittish, which is clearly demonstrated by the lack of direction of our Trend Tracking Indexes (TTIs), which have now been hugging their trendlines for several weeks (section 3).
Geopolitical worries and mixed economic date are here to stay and will keep the Wall Street crowd on edge. After all, the menu of concerns has not been reduced, and we will still have to deal with Covid problems in China, the Ukraine conflict, slowing global growth, upcoming 4th quarter earnings, the potential slowdown in Q1 2023 earnings—and Fed policies.
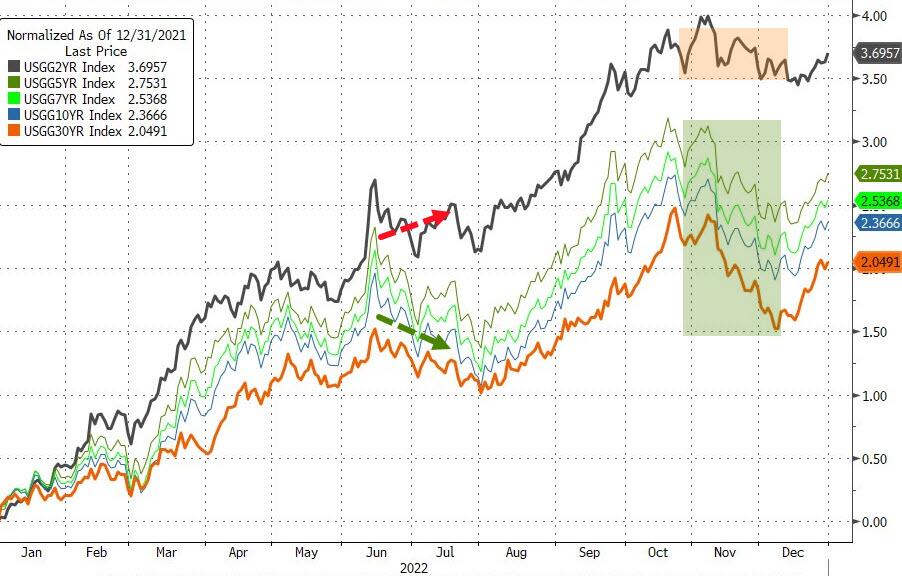
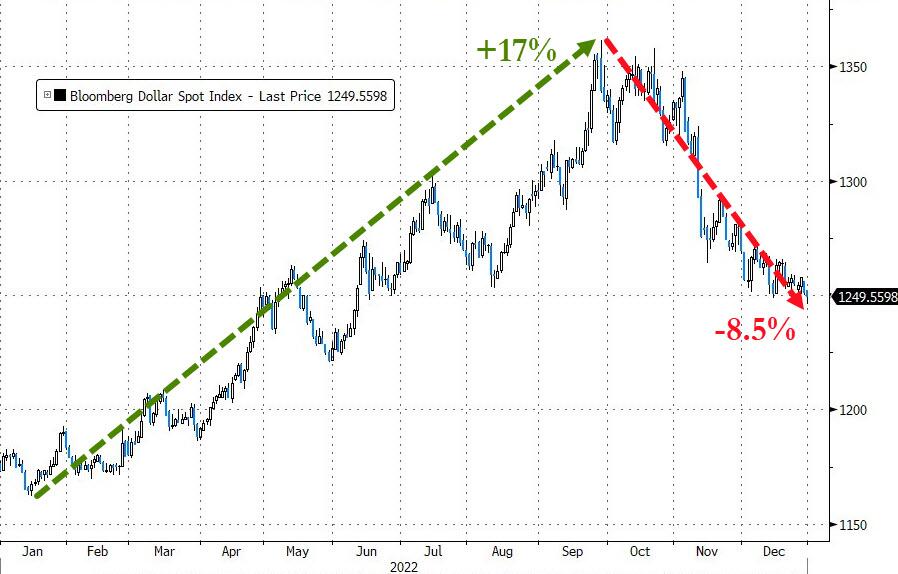
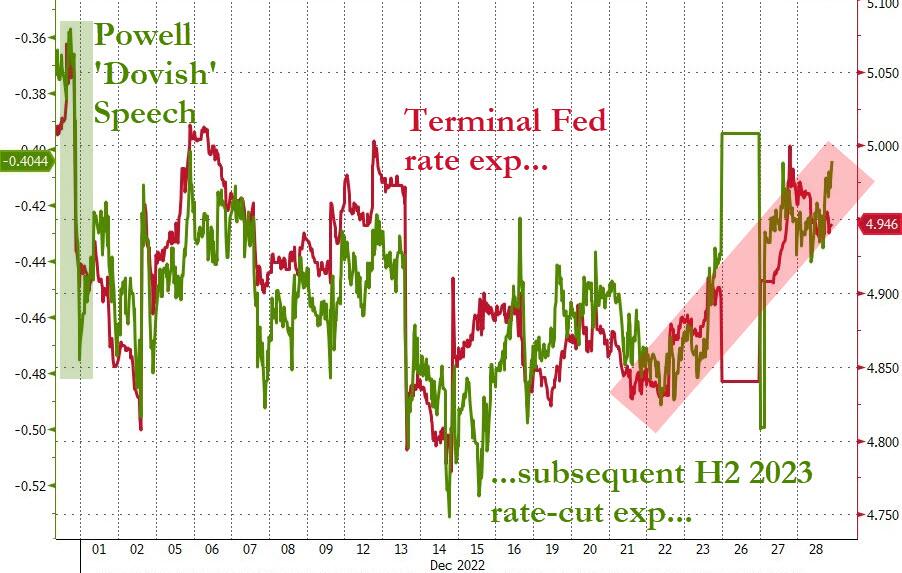
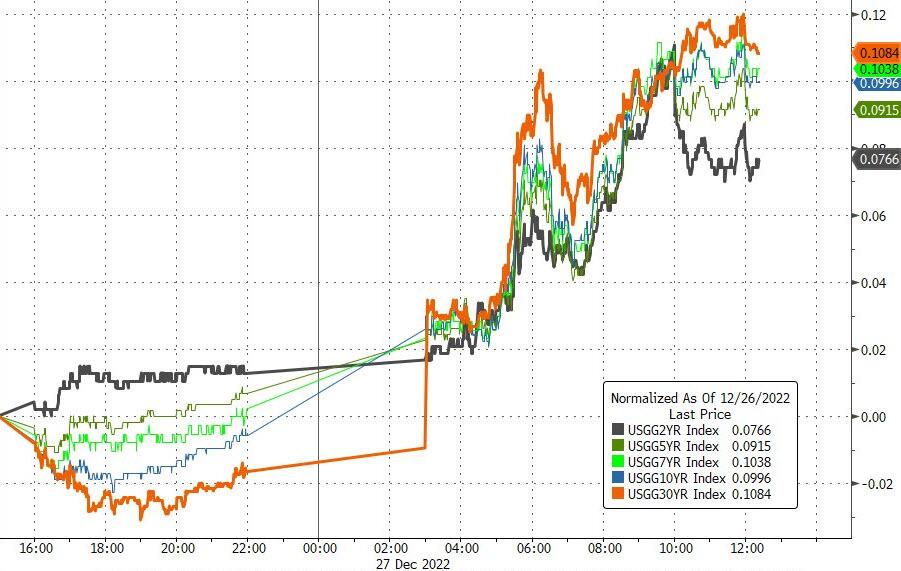
Bond yields exploded higher this year, as the Fed followed through with its inflation fighting endeavors causing the US Dollar to surge, despite a 4th quarter sell-off. Gold rode the rollercoaster but managed to close out the year unchanged.
And for the last time in 2022, the 2008-2009 analog now looks like this.
ETF Data updated through Thursday, December 29, 2022
Methodology/Use of this StatSheet:
1. From the universe of over 1,800 ETFs, I have selected only those with a trading volume of over $5 million per day (HV ETFs), so that liquidity and a small bid/ask spread are assured.
2. Trend Tracking Indexes (TTIs)
Buy or Sell decisions for Domestic and International ETFs (section 1 and 2), are made based on the respective TTI and its position either above or below its long-term M/A (Moving Average). A crossing of the trend line from below accompanied by some staying power above constitutes a “Buy” signal. Conversely, a clear break below the line constitutes a “Sell” signal. Additionally, I use a 12% trailing stop loss on all positions in these categories to control downside risk.
3. All other investment arenas do not have a TTI and should be traded based on the position of the individual ETF relative to its own respective trend line (%M/A). That’s why those signals are referred to as a “Selective Buy.” In other words, if an ETF crosses its own trendline to the upside, a “Buy” signal is generated. Here too, I recommend trailing sell stop of 12%, or less, depending on your risk tolerance.
If you are unfamiliar with some of the terminology, please see Glossary of Termsand new subscriber information in section 9.
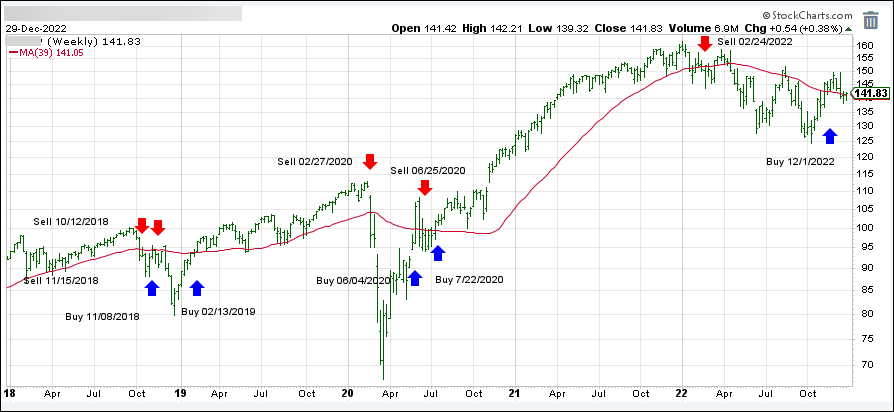
1. DOMESTIC EQUITY ETFs: BUY — since 12/01/2022
Click on chart to enlarge
Our main directional indicator, the Domestic Trend Tracking Index (TTI-green line in the above chart) has reclaimed its long-term trend line (red) by +0.30% and remains in “Buy” mode for the time being.
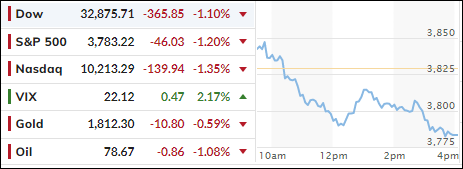
Despite a green opening, the bulls lost control in a hurry, as the bears took over and dominated the rest of the session as if to add insult to injury to a year that is shaping up to be the worst since 2008. The S&P is now on track to close 2022 with a loss of over 20%.
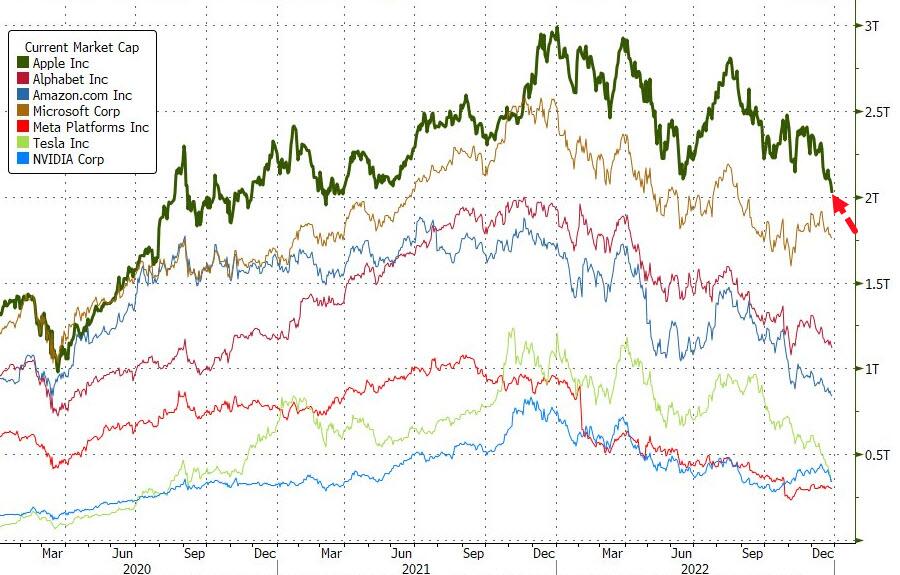
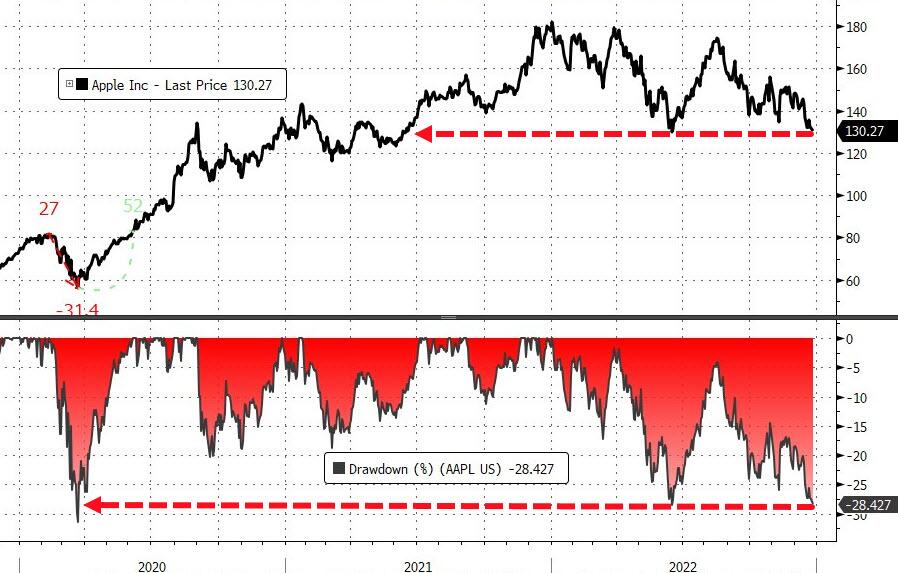
Powerhouse Apple fell another 3% and dropped through a key support level to a 52-week low. Energy was big laggard with Crude Oil now below $80, and Southwest Airlines continued its slide by another 5% amid an additional surge of flight cancellations.
Traders are now simply wishing that due to bullish momentum appearing to have been exhausted, with the much hoped for technical rally fast disappearing in the rear-view mirror, that Friday afternoon arrives without much more carnage.
Ok, but what are we looking at once the first trading day of 2023 arrives next week? China, Covid, energy issues, a weakening economy (lower earnings?), Ukraine, and hawkish Central Banks do not paint a picture of calmness or balance conducive for the bulls.
With my Trend Tracking Indicators (TTIs-section 3) having hugged their trend lines in the recent past, but now are showing a southerly tendency, I would not be surprised to see a “Sell” signal in the near future, which could be as soon as next week.
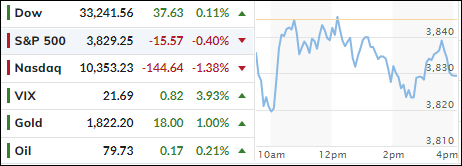
Rising bond yields took center stage today and kept equities in a tight trading range, as the first of the last 4 days of trading in 2022 provided no ammunition for the bulls to try to end a brutal year on a positive.
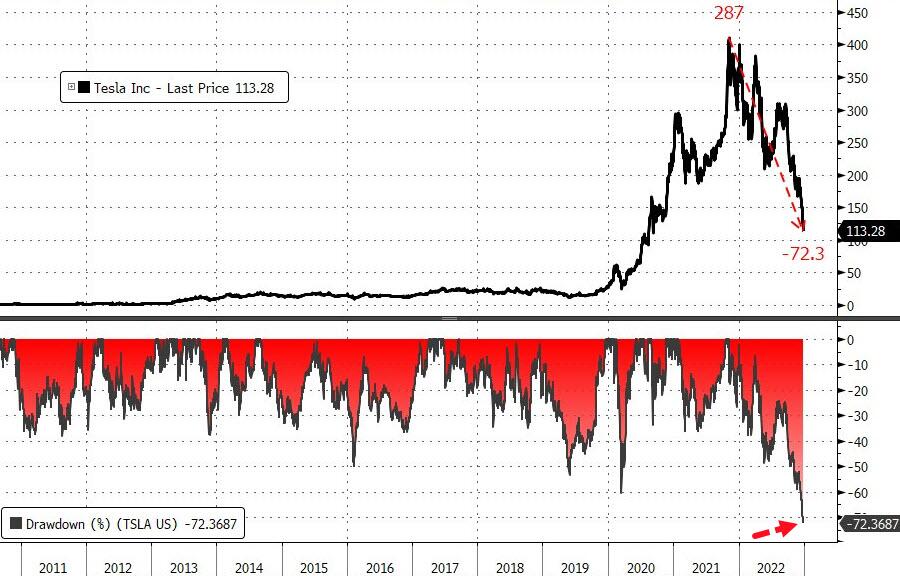
China’s loosening of Covid restrictions helped their stock market, but domestically no upside driver emerged, as Tesla dropped another 8% due to an extended production pause, with the stock now being on target for its worst year ever. Ouch! Southwest Airlines lost around 5%, as thousands of flights had to be cancelled.
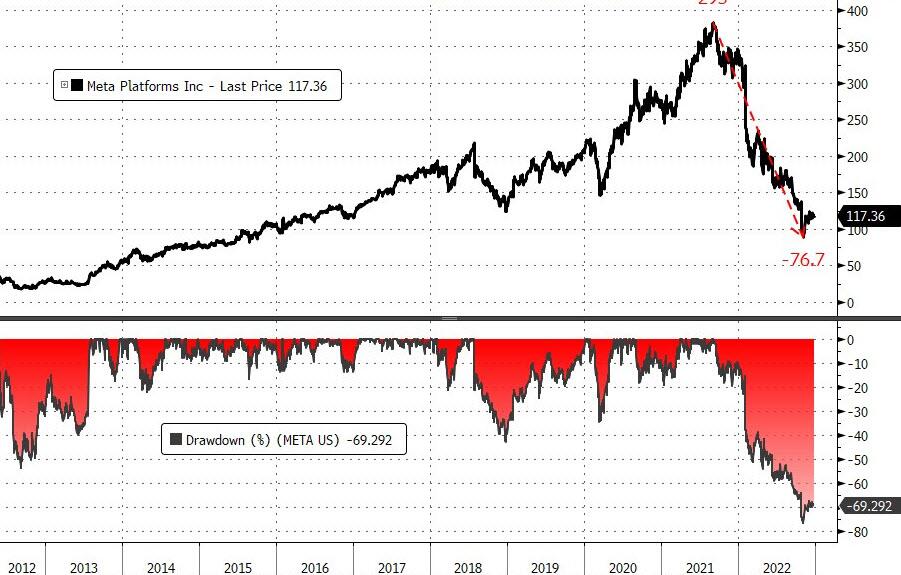
Even powerhouse Apple has now come off its recent highs by 29% and is testing its June 2022 lows. A reduction in production and consumption lies at the forefront of its malaise. But top billing for worst performance goes to Meta, which is down 70% from its highs.
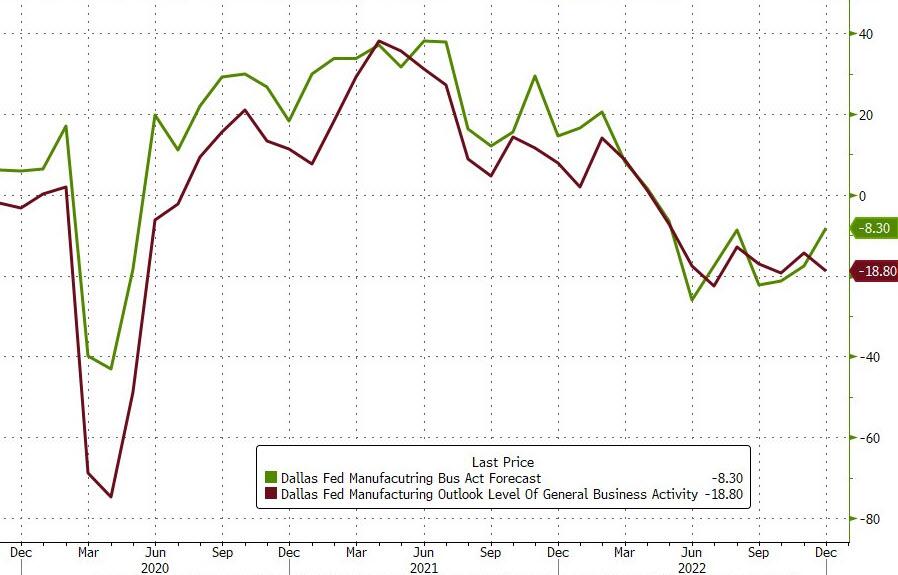
Concerns about next year’s economic outlook preoccupied traders’ minds, as the latest Dallas Manufacturing Survey showed a September plunge to -18.8 (vs. -14.4 expected), a number that did nothing to soothe the sour mood on Wall Street.
On the positive, the US Trade Deficit shrank significantly, as ZeroHedge pointed out, which should have been good news, but wasn’t, when considering that the Fed’s “higher for longer” rate narrative may now not be crushed, which might have been the case had the deficit worsened.
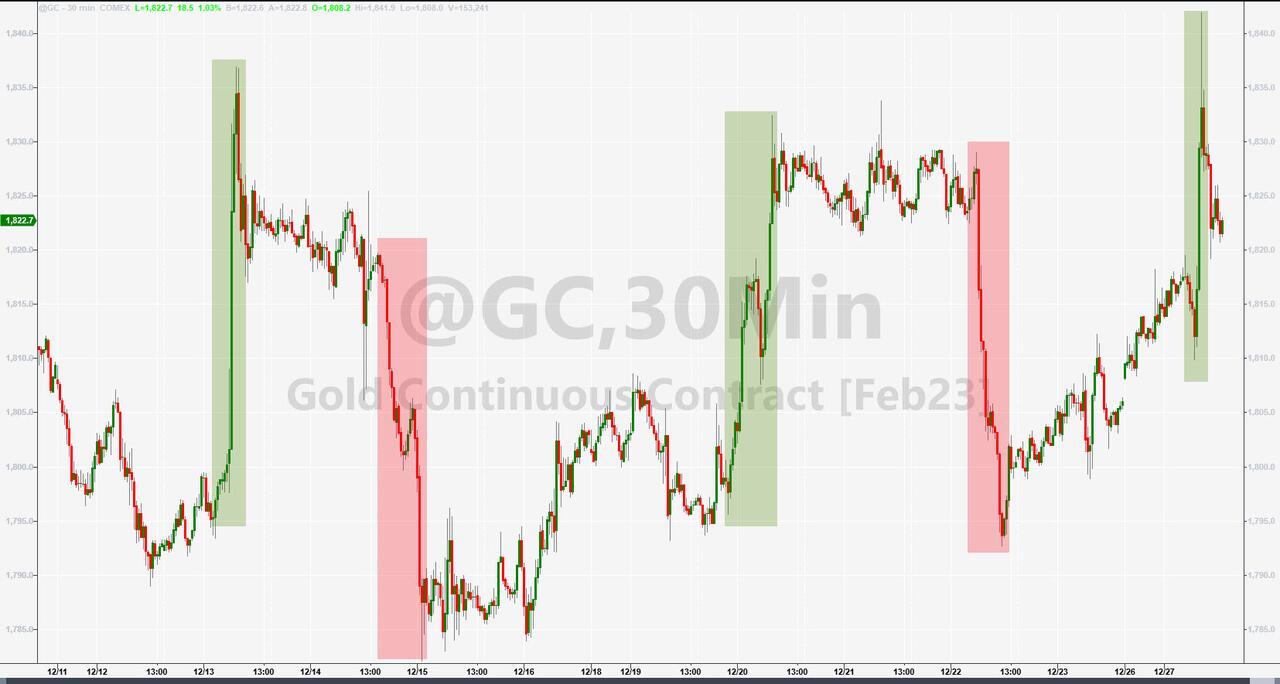
The US Dollar went nowhere, but gold was a top performer for the day by gaining 1% and solidifying its position above the $1,800 level.
Below, please find the latest High-Volume ETF Cutline report, which shows how far above or below their respective long-term trend lines (39-week SMA) my currently tracked ETFs are positioned.
This report covers the HV ETF Master List from Thursday’s StatSheet and includes 312 High Volume ETFs, defined as those with an average daily volume of more than $5 million, of which currently 100 (last report: 88) are hovering in bullish territory. The yellow line separates those ETFs that are positioned above their trend line (%M/A) from those that have dropped below it.
In case you are not familiar with some of the terminology used in the reports, please read the Glossary of Terms. If you missed the original post about the Cutline approach, you can read it here.

