
- Moving the markets
All eyes were on today’s release of the Fed’s Beige Book, which showed again that bad news can be good news, as far as the markets are concerned. To sum it up, key words that assisted the bulls were “downgraded growth,” “softening demand,” and “moderating price increases.”
Manufacturing was mixed, with supply chain bottlenecks limiting activity, while labor markets remained tight. However, what really mattered was Fed Vice Chair Brainard’s affirmation that the Central Bank would do what it takes to restrain inflation. She also noted the potential risks of going too far, and that was the part of her speech that traders and algos alike focused on, and the rally was on.
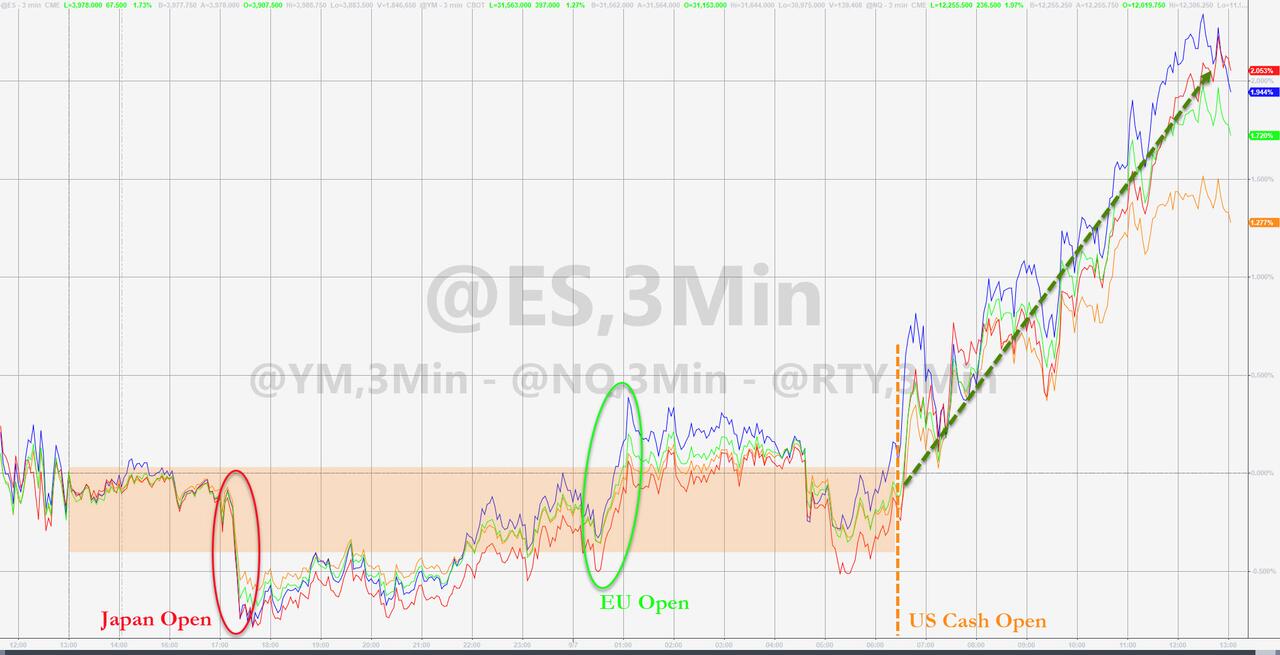
Some support came from the fact that the markets were oversold, after the beating of the last 3 weeks, during which the S&P 500 got spanked at the tune of over 9%. Other comments from the Fed’s Barr (inflation is “far too high”) and Collins (inflation is “simply too high”) should have taken the starch out of today’s rally—but didn’t.
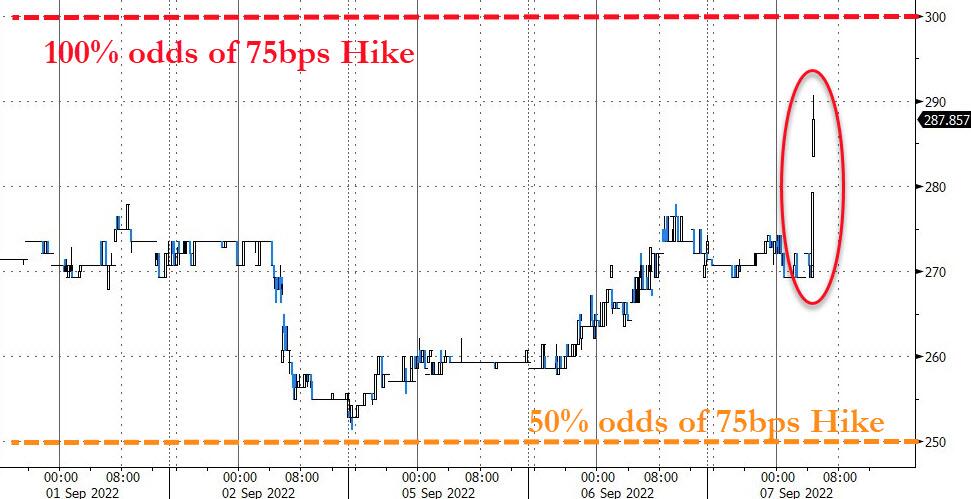
However, the comments sent the odds of a 75bps hike in September up to 90%, which also was an event that stocks simply ignored, as the goal appeared to be to end the worst losing streak in 6 years, as ZeroHedge put it.
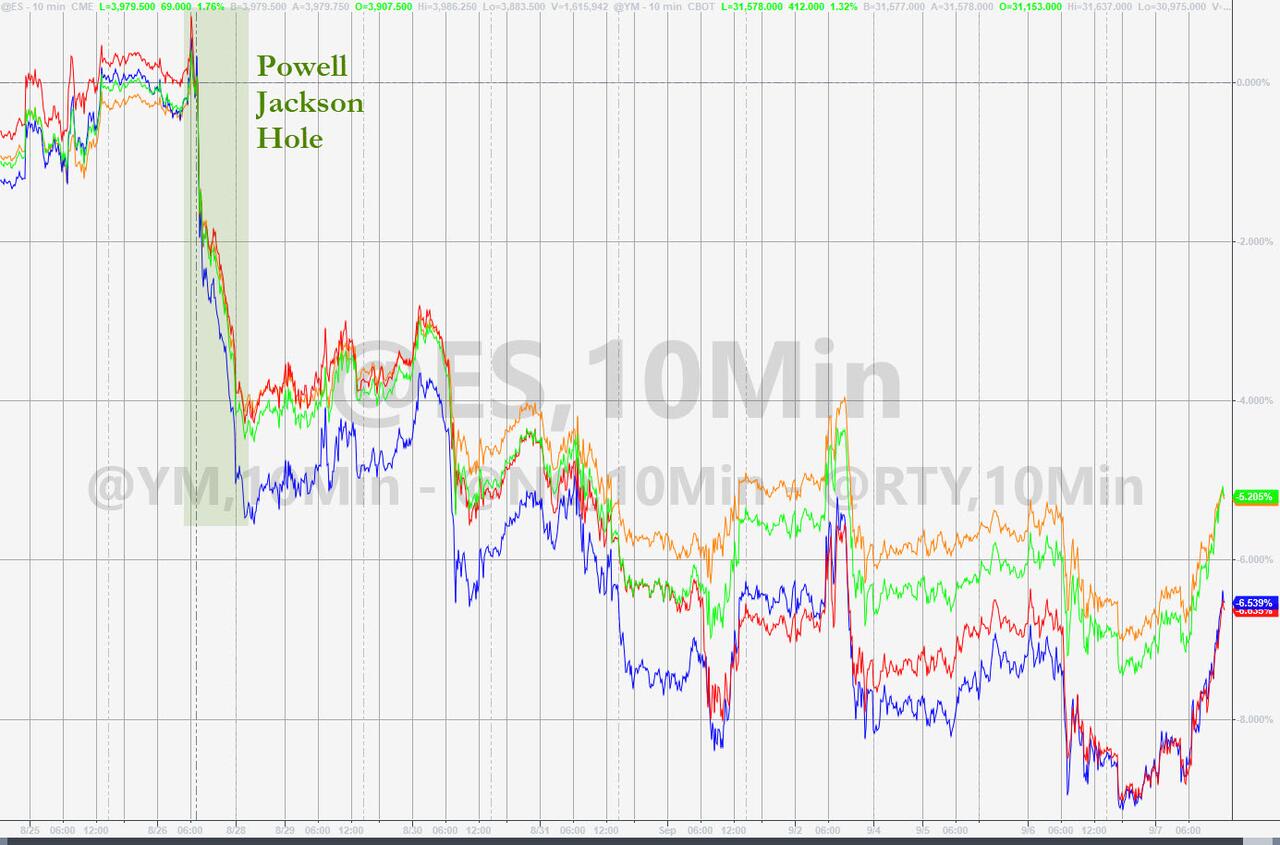
I consider today’s rebound to be another bear market rally, which barely made a dent in the losses sustained for buy-and-holders, since Powell’s Jackson Hole comments.
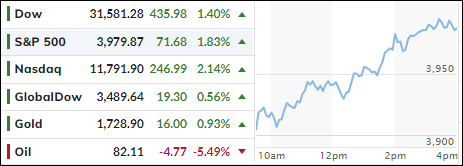
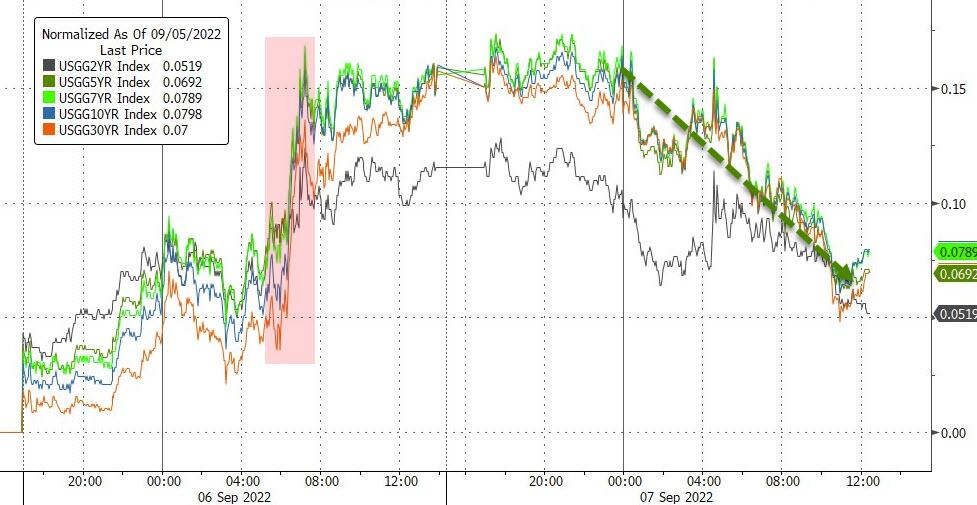
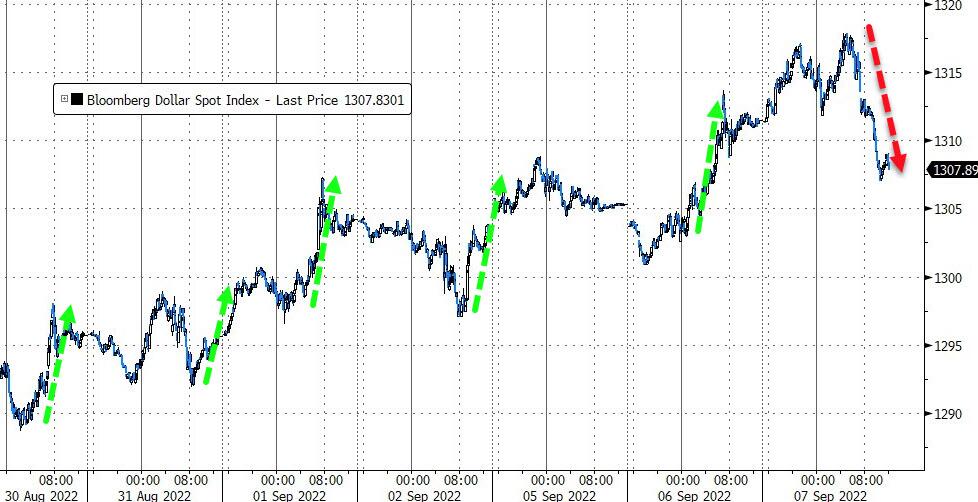
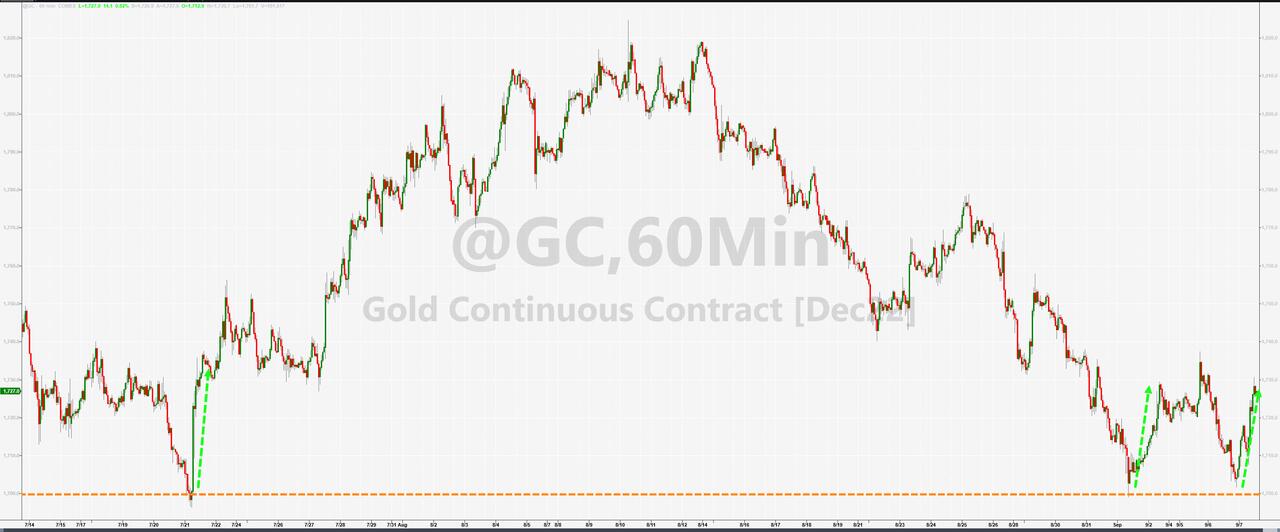
Bond yields softened from yesterday’s vicious rebound, the US Dollar took a dive, and Gold bounced off its $1,700 level again.
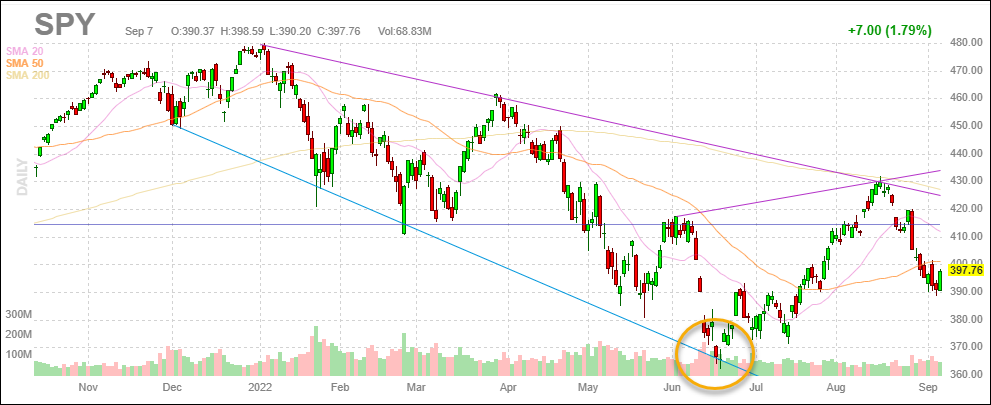
Despite many opinions to the contrary, I believe the June bottom (yellow circle) will be still taken out:
2. ETFs in the Spotlight
In case you missed the announcement and description of this section, you can read it here again.
It features some of the 10 broadly diversified domestic and sector ETFs from my HighVolume list as posted every Saturday. Furthermore, they are screened for the lowest MaxDD% number meaning they have been showing better resistance to temporary sell offs than all others over the past year.
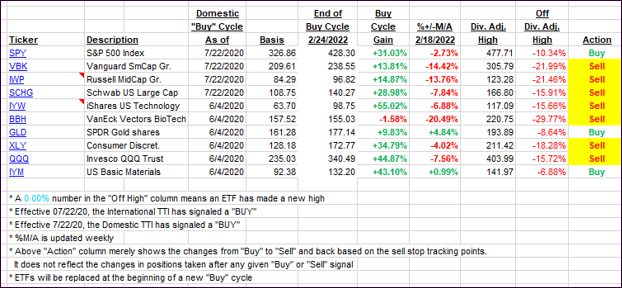
The below table simply demonstrates the magnitude with which these ETFs are fluctuating above or below their respective individual trend lines (%+/-M/A). A break below, represented by a negative number, shows weakness, while a break above, represented by a positive percentage, shows strength.
For hundreds of ETF choices, be sure to reference Thursday’s StatSheet.
For this closed-out domestic “Buy” cycle (2/24/2022), here’s how some of our candidates have fared. Keep in mind that our Domestic Trend Tracking Index (TTI) signaled a “Sell” on that date, which overrode the existing “Buys” shown for SPY and IYM:
Click image to enlarge.
Again, the %+/-M/A column above shows the position of the various ETFs in relation to their respective long-term trend lines, while the trailing sell stops are being tracked in the “Off High” column. The “Action” column will signal a “Sell” once the -12% point has been taken out in the “Off High” column, which has replaced the prior -8% to -10% limits.
3. Trend Tracking Indexes (TTIs)
Our TTI’s went into rally mode, as poor economic news turned was interpreted as good news for the markets.
This is how we closed 09/07/2022:
Domestic TTI: -4.35% below its M/A (prior close -6.40%)—Sell signal effective 02/24/2022.
International TTI: -10.04% below its M/A (prior close -10.58%)—Sell signal effective 03/08/2022.
Disclosure: I am obliged to inform you that I, as well as my advisory clients, own some of the ETFs listed in the above table. Furthermore, they do not represent a specific investment recommendation for you, they merely show which ETFs from the universe I track are falling within the specified guidelines.
All linked charts above are courtesy of Bloomberg via ZeroHedge.
Contact Ulli