
ETF Tracker StatSheet
You can view the latest version here.
SHATTERING A 3-WEEK SLUMP
- Moving the markets
Despite the Fed having gone all out with its resolve of fighting inflation confirmed via a variety of speeches by Fed governors and Fed head Powell himself during his Jackson Hole 10-minute closing speech, the markets are simply not buying it and calling his bluff.
Here’s what he said:
Restoring price stability will take some time and requires using our tools forcefully to bring demand and supply into better balance. Reducing inflation is likely to require a sustained period of below-trend growth. Moreover, there will very likely be some softening of labor market conditions. While higher interest rates, slower growth, and softer labor market conditions will bring down inflation, they will also bring some pain to households and businesses. These are the unfortunate costs of reducing inflation. But a failure to restore price stability would mean far greater pain.
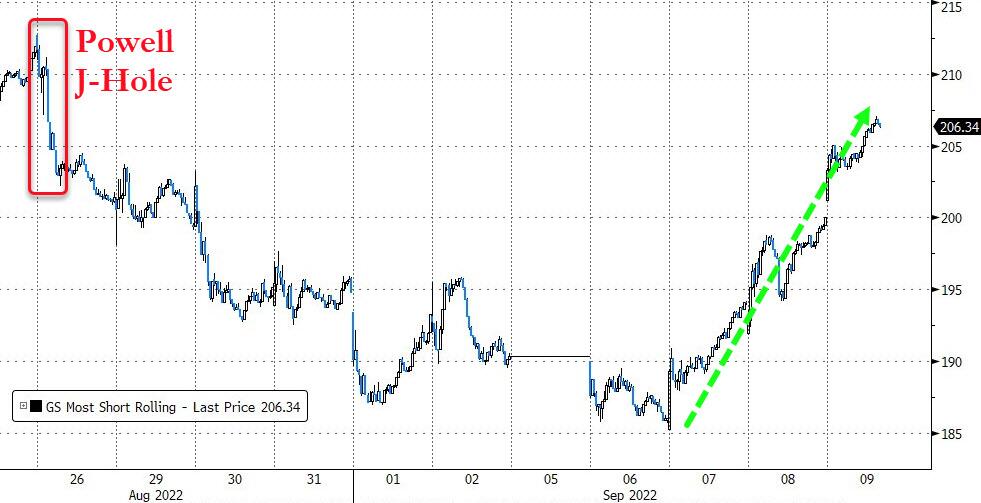
The markets tanked originally over a 3-week span, but during this Holiday shortened week, traders and algos alike challenged his conviction of not turning dovish soon and pumped stocks higher hoping/wishing/concluding that the much-awaited pivot will be close at hand. And that despite another host of hawkish announcements, as ZeroHedge posted:
- *BULLARD SAYS MARKETS UNDERPRICING ‘HIGHER FOR LONGER’ RATES
- *BULLARD SAYS GOOD CPI REPORT SHOULDN’T AFFECT SEPT. FED CALL
- *WALLER BACKS ‘ANOTHER SIGNIFICANT’ RATE HIKE IN SEPTEMBER
- *WALLER: INFLATION FAR TOO HIGH, PREMATURE TO JUDGE IT’S PEAKED
- *WALLER: IF WE DON’T GET INFLATION DOWN, WE’RE IN TROUBLE
- *GEORGE: FED HAS SOME ROOM TO RUN TO BRING INTEREST RATES UP
- *GEORGE: WARNS OF POSSIBLE DIFFICULT PATH IN LOWERING INFLATION
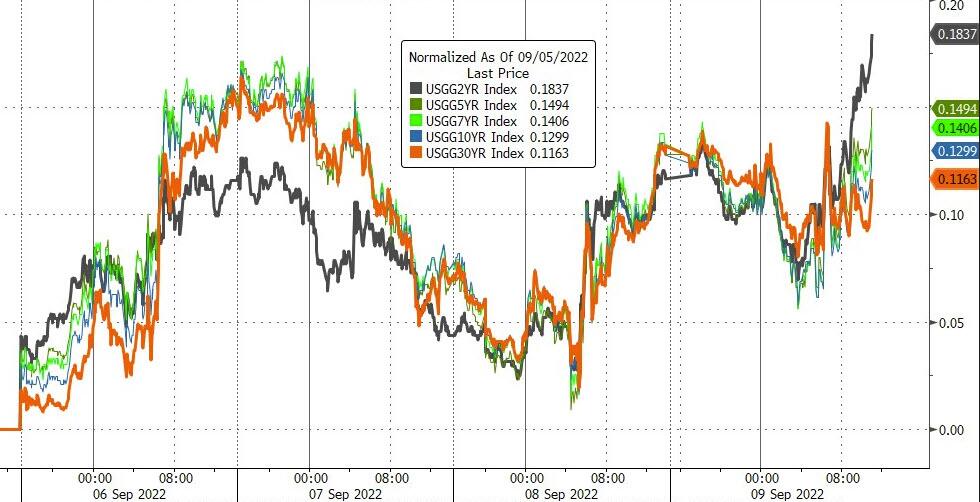
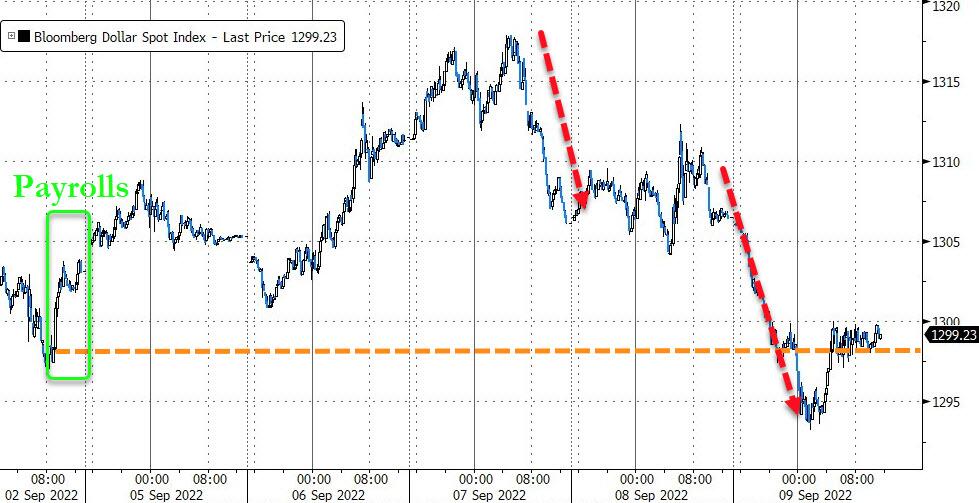
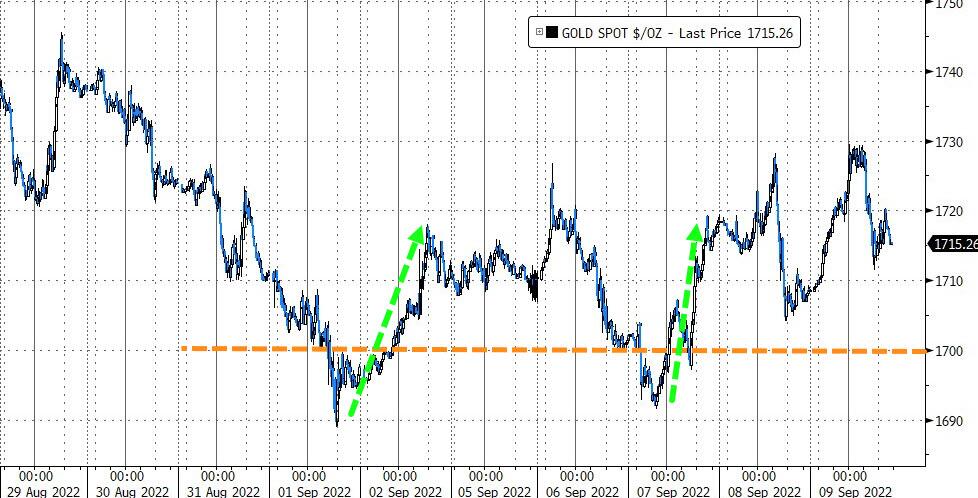
Even a continued surge in Rate Hike Expectations did nothing to stop the bulls from pushing the indexes higher. Just as higher bond yields did not change traders’ minds. The US Dollar slipped off its mid-week high, which enabled Gold to recapture its $1,700 level.
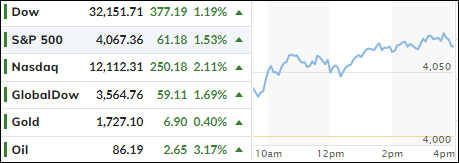
In the end, the S&P 500 gained 3.6% during the past 4 trading days, thereby wiping out the past 2 weeks of losses. While it’s too early to tell if this week’s activity turns out to be another head fake, it’s clear to me that the Fed will continue its mission to tighten monetary policy, which will be a headwind for equities going forward.
Nevertheless, bear market bounces will always be part of that equation, but we must be prepared that out of one those rebounds a new bull market may emerge.
2. ETFs in the Spotlight
In case you missed the announcement and description of this section, you can read it here again.
It features some of the 10 broadly diversified domestic and sector ETFs from my HighVolume list as posted every Saturday. Furthermore, they are screened for the lowest MaxDD% number meaning they have been showing better resistance to temporary sell offs than all others over the past year.
The below table simply demonstrates the magnitude with which these ETFs are fluctuating above or below their respective individual trend lines (%+/-M/A). A break below, represented by a negative number, shows weakness, while a break above, represented by a positive percentage, shows strength.
For hundreds of ETF choices, be sure to reference Thursday’s StatSheet.
For this closed-out domestic “Buy” cycle (2/24/2022), here’s how some of our candidates have fared. Keep in mind that our Domestic Trend Tracking Index (TTI) signaled a “Sell” on that date, which overrode the existing “Buys” shown for SPY and IYM:
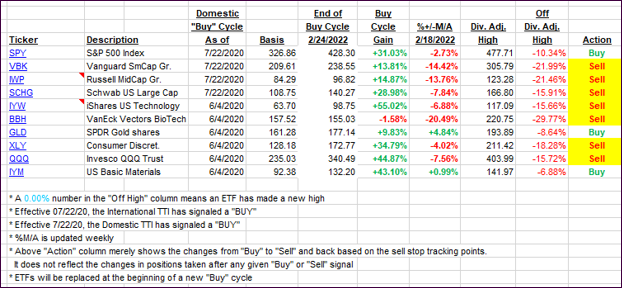
Click image to enlarge.
Again, the %+/-M/A column above shows the position of the various ETFs in relation to their respective long-term trend lines, while the trailing sell stops are being tracked in the “Off High” column. The “Action” column will signal a “Sell” once the -12% point has been taken out in the “Off High” column, which has replaced the prior -8% to -10% limits.
3. Trend Tracking Indexes (TTIs)
Our TTI’s improved quite a bit this week, as the bulls dominated in the face of surging bond yields thereby moving us closer to a potential new “Buy” signal.
This is how we closed 09/09/2022:
Domestic TTI: -2.00% below its M/A (prior close -3.52%)—Sell signal effective 02/24/2022.
International TTI: -7.81% below its M/A (prior close -9.56%)—Sell signal effective 03/08/2022.
Disclosure: I am obliged to inform you that I, as well as my advisory clients, own some of the ETFs listed in the above table. Furthermore, they do not represent a specific investment recommendation for you, they merely show which ETFs from the universe I track are falling within the specified guidelines.
All linked charts above are courtesy of Bloomberg via ZeroHedge.
———————————————————-
WOULD YOU LIKE TO HAVE YOUR INVESTMENTS PROFESSIONALLY MANAGED?
Do you have the time to follow our investment plans yourself? If you are a busy professional who would like to have his portfolio managed using our methodology, please contact me directly to get more details.
Contact Ulli