
- Moving the markets
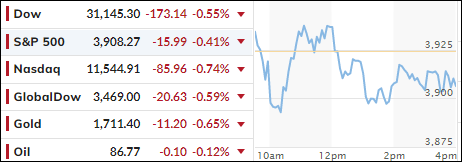
A feeble rebound attempt right after the opening was easily rebuffed with the major indexes swinging wildly throughout the session, but the bearish theme outlasted any bullish attempts, so we closed in the red—again. The Nasdaq posted its 7th straight day of declines, its longest losing streak since November 2016, according to ZeroHedge.
A better-than-expected ISM reading (Purchasing Managers Index), following Friday’s jobs report, added to concerns that a more solid economy will give the Fed further reason to hike aggressively when they meet later this month.
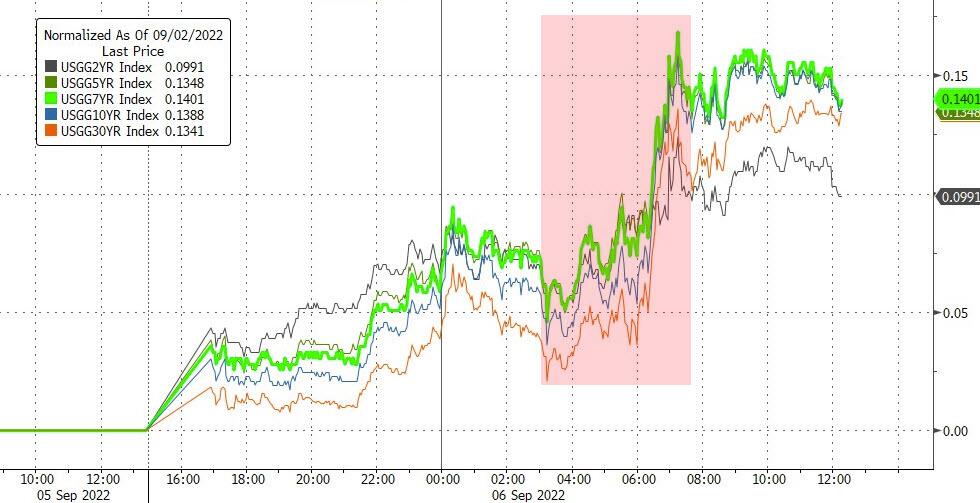
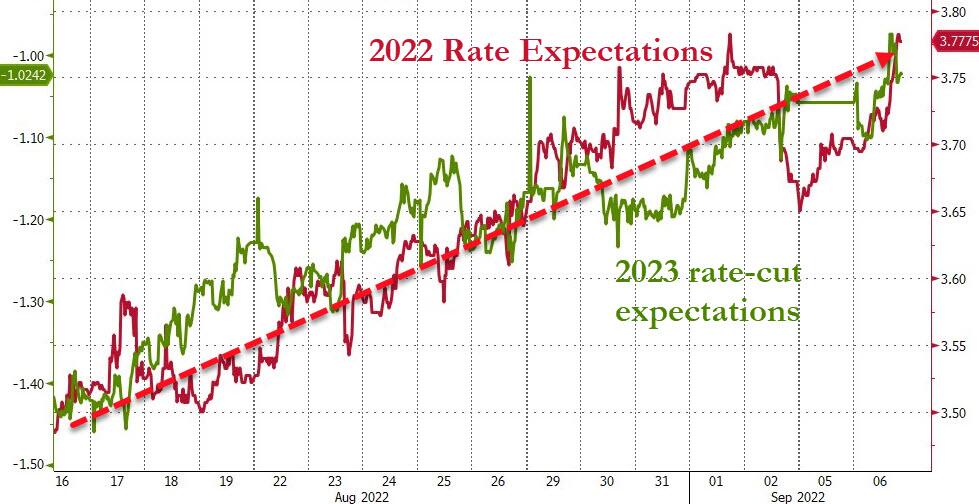
That did not bode well for equities and sent bond yields sharply higher, with the 10-year at one point being up 16bps to 3.53% before retreating and settling at 3.34%. Rate hike expectations surged along with future rate cut expectations to validate the current hawkish tendencies.
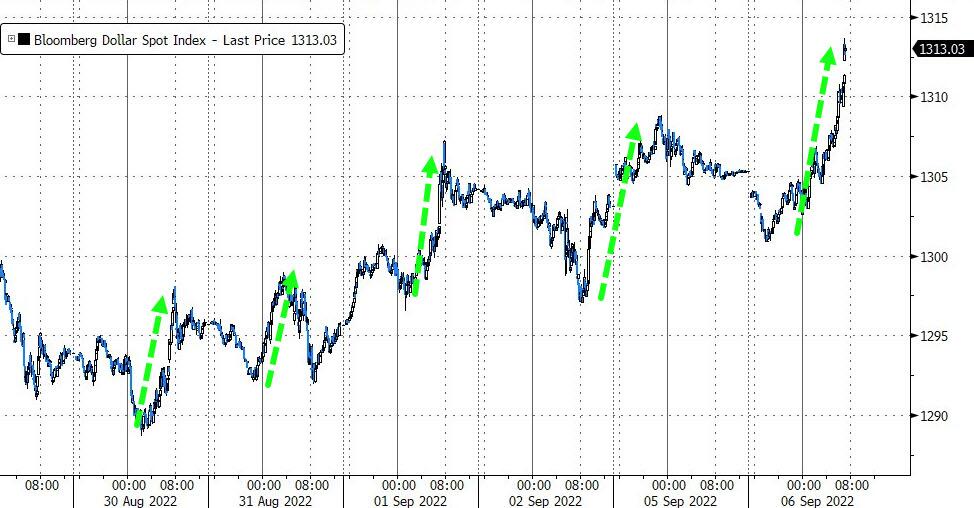
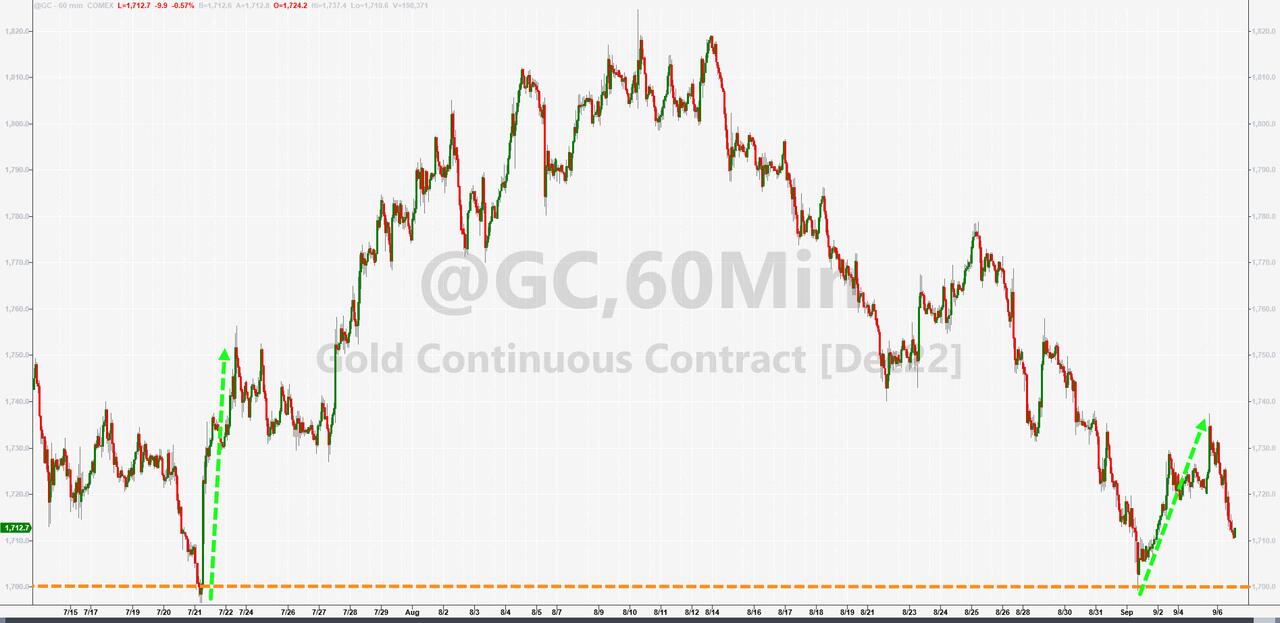
As a result, the US Dollar reversed Friday’s course and ripped higher and, in the process, pulled Gold back down after last week’s rally attempt.
Economist Dr. Doom, AKA Nouriel Roubini, added this warning:
I worry about a stagflationary debt crisis because you have the worst of the ’70s in terms of supply shocks, and you have the worst of the global financial crisis because of too much debt, and that combination is dangerous.
If you’re behind the curve, eventually the recession is going to be more severe, the loss of jobs and income and wages is going to be more severe.
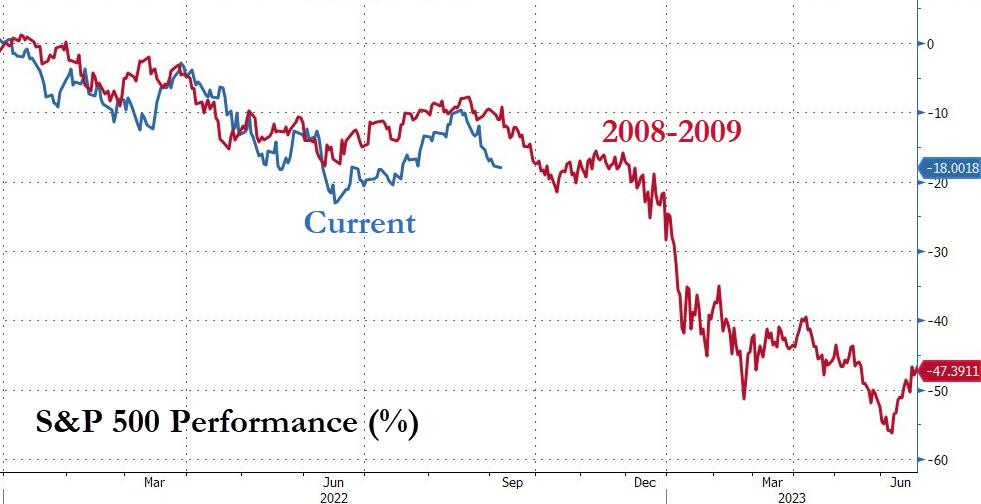
Makes me wonder if the analog to 2008-2009 will continue to be on target?
2. ETFs in the Spotlight
In case you missed the announcement and description of this section, you can read it here again.
It features some of the 10 broadly diversified domestic and sector ETFs from my HighVolume list as posted every Saturday. Furthermore, they are screened for the lowest MaxDD% number meaning they have been showing better resistance to temporary sell offs than all others over the past year.
The below table simply demonstrates the magnitude with which these ETFs are fluctuating above or below their respective individual trend lines (%+/-M/A). A break below, represented by a negative number, shows weakness, while a break above, represented by a positive percentage, shows strength.
For hundreds of ETF choices, be sure to reference Thursday’s StatSheet.
For this closed-out domestic “Buy” cycle (2/24/2022), here’s how some of our candidates have fared. Keep in mind that our Domestic Trend Tracking Index (TTI) signaled a “Sell” on that date, which overrode the existing “Buys” shown for SPY and IYM:
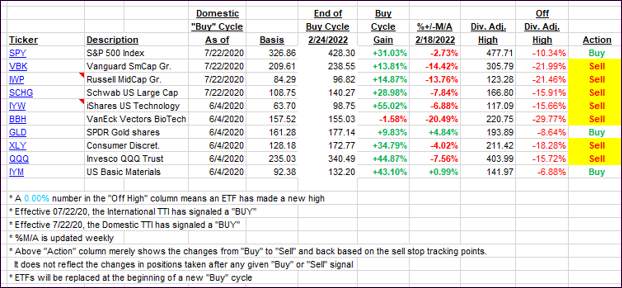
Click image to enlarge.
Again, the %+/-M/A column above shows the position of the various ETFs in relation to their respective long-term trend lines, while the trailing sell stops are being tracked in the “Off High” column. The “Action” column will signal a “Sell” once the -12% point has been taken out in the “Off High” column, which has replaced the prior -8% to -10% limits.
3. Trend Tracking Indexes (TTIs)
Our TTI’s headed south as several rally attempts were rejected.
This is how we closed 09/06/2022:
Domestic TTI: -6.40% below its M/A (prior close -6.14%)—Sell signal effective 02/24/2022.
International TTI: -10.58% below its M/A (prior close -9.80%)—Sell signal effective 03/08/2022.
Disclosure: I am obliged to inform you that I, as well as my advisory clients, own some of the ETFs listed in the above table. Furthermore, they do not represent a specific investment recommendation for you, they merely show which ETFs from the universe I track are falling within the specified guidelines.
All linked charts above are courtesy of Bloomberg via ZeroHedge.
Contact Ulli